


Introduction
Primary liver cancer (PLC) is the sixth commonly diagnosed carcinoma, and it remains the fourth leading cause of cancer-related death. Of note, death from PLC among males is next to lung cancer [1]. The number of PLC patients is increasing worldwide which will lead to a serious health issue and high economic burden. In addition to rare hepatocellular-cholangiocarcinoma (H-ChC), the most common PLC pathological types were hepatocellular carcinoma (HCC) and intrahepatic cholangiocarcinoma (ICC) [2].
The proportion of HCC in PLC was 70%-80%. HCC originates from liver cells. Some risk factors are responsible for its occurrence and development, including hepatitis virus infection, excessive alcohol consumption, autoimmune diseases, and aflatoxin. ICC is the second most common PLC, accounting for 8% - 15% of liver malignant tumors [3]. It originates from intrahepatic bile duct epithelial cells and is mainly associated with biliary tract diseases, for example, sclerosing cholangitis and hepatolithiasis [4].
For some hepatic occupied diseases with atypical imaging and biomarker changes, it is usually difficult to accurately identify the benign and malignant lesions. Because the treatment methods of HCC and ICC are completely different, misdiagnosed may bring disastrous consequences to the patients. Sorafenib was the first systemic therapy approved for the first-line treatment of advanced HCC [5]. While the combination of cisplatin and gemcitabine is the current first-line chemotherapy for patients with advanced-stage cholangiocarcinoma [6]. Accurate diagnosis of PLC type is very important for selecting appropriate treatment methods and making a follow-up schedule. Previous studies have demonstrated that serum biomarkers such as CA19–9 and AFP could be used to differentiate HCC from ICC but the sensitivity and specificity were not satisfied [7]. Therefore, some strategies are urgently needed to improve the certainty and feasibility of diagnosis.
DNA methylation in the promoter CpG island (CGI) of the tumor suppressor gene (TSG), as an important mechanism, usually induces the occurrence and progression of many kinds of cancers [8]. Abnormal methylation of CpG sites in TSGs promoter can change the spatial structure of chromatin, resulting in low or no expression of tumor suppressor genes [9]. Recent studies have shown that abnormal gene methylation is closely correlated with the occurrence of HCC and ICC, which has a potential role in screening the diagnostic biomarkers and therapeutic targets. A previous study demonstrated that circulating tumor DNA methylation markers can be used to distinguish HCC from normal tissues, with a sensitivity of 85.7% and a specificity of 94.3% [10]. Furthermore, DNA methylation of ten CpG sites could be used to distinguish tumor and normal tissue in patients with liver cancer, with a sensitivity of 86% and specificity of 100% [11]. However, these studies only focus on the diagnostic markers of HCC. Few studies are concentrating on the diagnostic markers to distinguish HCC from ICC. In this context, this study aimed to screen methylation biomarkers that could be used to not only confirm the PLC but also distinguish HCC from ICC, which is extremely important for the choice of the subsequent treatment plan.
Results
Landscapes of differentially methylated sites in HCC and ICC
From the training data set in Table 1, methylation data of 96 normal samples and 402 HCC samples were compared. A total of 8,177 hypermethylated sites and 3,152 hypomethylated sites were identified in HCC. While in the comparison of 96 normal samples and 108 ICC samples, there were 33,449 hypermethylated sites and 1,049 hypomethylated sites in ICC. Then according to the genomic region, we visualized the distribution of these DMC sites and corresponding genes. We can see that hypermethylation mainly occurred in CpG islands regardless of HCC (Supplementary Table 1 and Figure 1A, 1B) or ICC (Supplementary Table 1 and Figure 1E, 1F). However, hypomethylation accounted for a higher proportion in the HCC gene body (Supplementary Table 1 and Figure 1C, 1D) compared with ICC (Supplementary Table 1 and Figure 1G, 1H). In promoter regions, both cancer types were dominated by hypermethylation (Supplementary Table 1 and Figure 1C, 1D, 1G, 1H). Such hypermethylation in promoter and hypomethylation in the gene body was considered to be the characteristics of solid tumors. The difference in gene body methylation level also indicates the heterogeneity between HCC and ICC, which proves the feasibility of using DMC sites as potential diagnostic biomarkers.
Table 1. The data sets of DNA methylation.
| Training data set | Na | ICCb | HCCc | Total | |||||||||||||||||||||||||||||||||||||||||||||||||||||||||||||||||||||||||||||||||||||||||||||||
| TCGA-CHOL | 8 | 30 | 0 | 38 | |||||||||||||||||||||||||||||||||||||||||||||||||||||||||||||||||||||||||||||||||||||||||||||||
| GSE32079 [20] | 0 | 50 | 0 | 50 | |||||||||||||||||||||||||||||||||||||||||||||||||||||||||||||||||||||||||||||||||||||||||||||||
| GSE49656 [21] | 4 | 26 | 0 | 30 | |||||||||||||||||||||||||||||||||||||||||||||||||||||||||||||||||||||||||||||||||||||||||||||||
| GSE60753 [22] | 34 | 2 | 32 | 68 | |||||||||||||||||||||||||||||||||||||||||||||||||||||||||||||||||||||||||||||||||||||||||||||||
| TCGA-LIHC | 50 | 0 | 370 | 420 | |||||||||||||||||||||||||||||||||||||||||||||||||||||||||||||||||||||||||||||||||||||||||||||||
| Total | 96 | 108 | 402 | 606 | |||||||||||||||||||||||||||||||||||||||||||||||||||||||||||||||||||||||||||||||||||||||||||||||
| Validation data set | N | ICC | HCC | Total | |||||||||||||||||||||||||||||||||||||||||||||||||||||||||||||||||||||||||||||||||||||||||||||||
| GSE89803 [23] | 4 | 96 | 0 | 100 | |||||||||||||||||||||||||||||||||||||||||||||||||||||||||||||||||||||||||||||||||||||||||||||||
| DS4-pumch [11] | 10 | 0 | 10 | 20 | |||||||||||||||||||||||||||||||||||||||||||||||||||||||||||||||||||||||||||||||||||||||||||||||
| GSE48325 [24] | 18 | 0 | 0 | 18 | |||||||||||||||||||||||||||||||||||||||||||||||||||||||||||||||||||||||||||||||||||||||||||||||
| GSE54503 [25] | 66 | 0 | 66 | 132 | |||||||||||||||||||||||||||||||||||||||||||||||||||||||||||||||||||||||||||||||||||||||||||||||
| GSE56588 [17] | 10 | 0 | 224 | 234 | |||||||||||||||||||||||||||||||||||||||||||||||||||||||||||||||||||||||||||||||||||||||||||||||
| GSE75041 | 0 | 0 | 66 | 66 | |||||||||||||||||||||||||||||||||||||||||||||||||||||||||||||||||||||||||||||||||||||||||||||||
| GSE77269 [26] | 20 | 0 | 20 | 40 | |||||||||||||||||||||||||||||||||||||||||||||||||||||||||||||||||||||||||||||||||||||||||||||||
| GSE89852 [27] | 37 | 0 | 37 | 74 | |||||||||||||||||||||||||||||||||||||||||||||||||||||||||||||||||||||||||||||||||||||||||||||||
| GSE99036 [28] | 0 | 0 | 15 | 15 | |||||||||||||||||||||||||||||||||||||||||||||||||||||||||||||||||||||||||||||||||||||||||||||||
| GSE107038 [29] | 40 | 0 | 0 | 40 | |||||||||||||||||||||||||||||||||||||||||||||||||||||||||||||||||||||||||||||||||||||||||||||||
| GSE113017 [30] | 29 | 0 | 29 | 58 | |||||||||||||||||||||||||||||||||||||||||||||||||||||||||||||||||||||||||||||||||||||||||||||||
| GSE113019 [30] | 18 | 0 | 37 | 55 | |||||||||||||||||||||||||||||||||||||||||||||||||||||||||||||||||||||||||||||||||||||||||||||||
| Total | 252 | 96 | 504 | 852 | |||||||||||||||||||||||||||||||||||||||||||||||||||||||||||||||||||||||||||||||||||||||||||||||
| aThe number of the normal samples. | |||||||||||||||||||||||||||||||||||||||||||||||||||||||||||||||||||||||||||||||||||||||||||||||||||
| bThe number of the ICC samples. | |||||||||||||||||||||||||||||||||||||||||||||||||||||||||||||||||||||||||||||||||||||||||||||||||||
| cThe number of the HCC samples. | |||||||||||||||||||||||||||||||||||||||||||||||||||||||||||||||||||||||||||||||||||||||||||||||||||
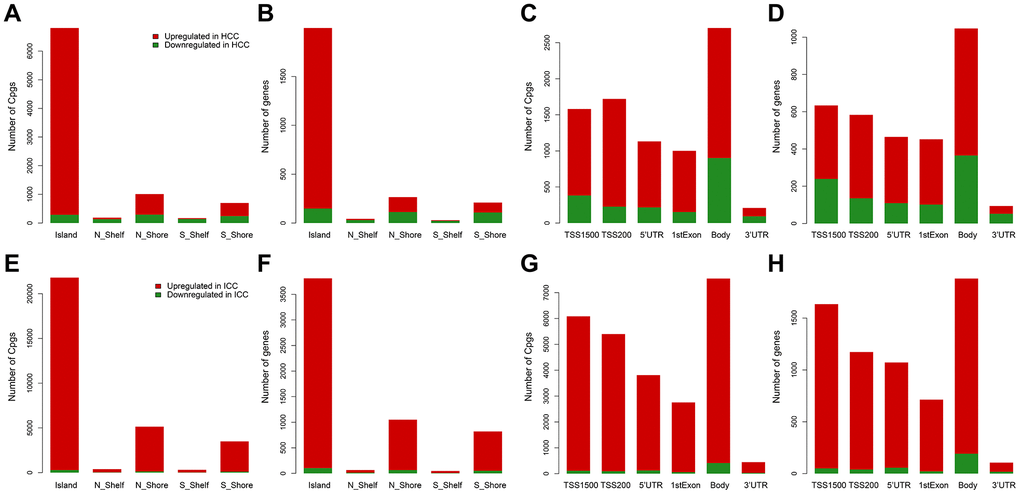
Figure 1. Distribution of differentially methylated sites and genes in HCC and ICC. Distribution of differentially methylated sites according to CpG island location in HCC (A) and ICC (E). Distribution of differentially methylated genes according to CpG island location in HCC (B) and ICC (F). Distribution of differentially methylated sites according to the distance to the TSS in HCC (C) and ICC (G). Distribution of differentially methylated genes according to the distance to the TSS in HCC (D) and ICC (H).
The sites selection strategy of the diagnostic model
To distinguish PLC from benign tumors of the liver, we selected the 6,565 common hypermethylated sites and 187 common hypomethylated sites between HCC and ICC as PLC specific sites pool. Based on the mean decrease of Gini values of methylation sites calculated through the random forest method, we tried different combinations from the top 1 site to the top 10 sites as diagnostic models (Supplementary Table 2 and Figure 2A). As Supplementary Table 3 and Figure 2B shows, the training set AUC values raised as the number of sites increases, while the validation set AUC values declined after 7 sites were included. Hence, to avoid overfitting and ensure the performance of the model, 3 sites (cg24035245, cg21072795, and cg00261162) were selected for economy and simplicity. After model evaluation, the PLC and normal diagnostic error rates are less than 6% (Figure 2C). The AUCs were 0.991 and 0.979 in the training set and validation set, respectively (Figure 2D, 2E).
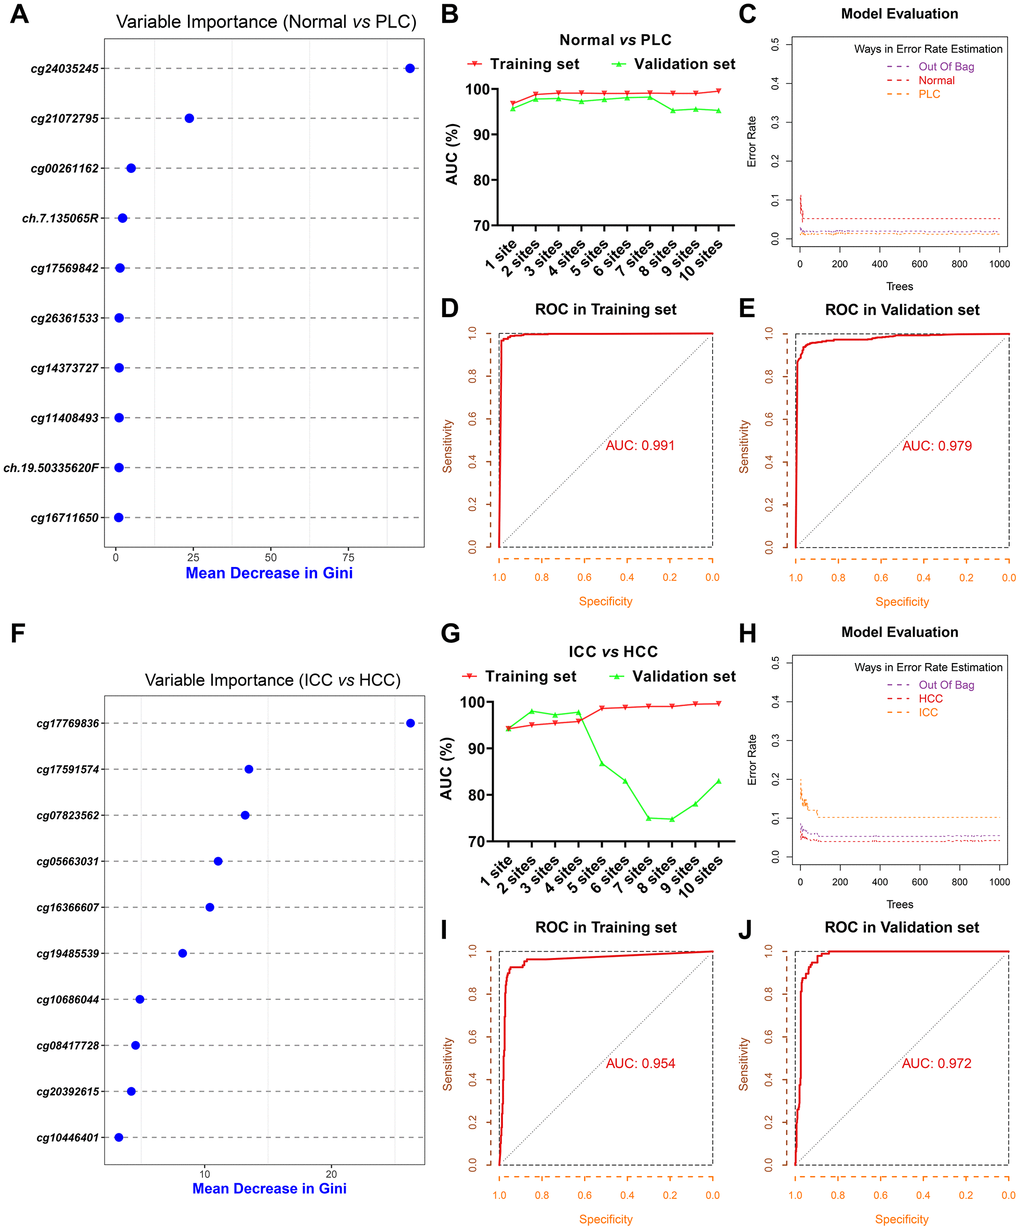
Figure 2. Screening of diagnostic sites. The top 10 methylation sites with indicated Gini values for distinguishing PLC and normal (A). The AUC curves of the diagnostic prediction model (PLC versus Normal) in the training and validation sets based on indicated sites combination (B). Evaluation of diagnostic model (PLC versus Normal) based on three sites (C). The receiver operating characteristic (ROC) curves of diagnostic model (PLC versus Normal) based on three sites in the training (D) and validation sets (E). The top 10 methylation sites with indicated Gini values for distinguishing HCC and ICC (F). The AUC curves of the diagnostic prediction model (HCC versus ICC) in the training and validation sets based on indicated sites combination (G). Evaluation of diagnostic model (HCC versus ICC) based on three sites (H). The receiver operating characteristic (ROC) curves of diagnostic model (HCC versus ICC) based on three sites in the training (I) and validation sets (J).
Next, 11,759 DMC sites between ICC and HCC were used to construct the model for differentiating HCC from ICC followed the same method as described above. The top 10 sites with Gini values were displayed in Supplementary Table 2 and Figure 2F. Although the training set AUC ascended significantly with the augment of the number of sites, the validation set AUC dropped sharply more than 4 sites (Supplementary Table 3 and Figure 2G). The misdiagnosis rate of ICC is about 10%, slightly higher than that of HCC (Figure 2H). The AUC in the training set and validation set based on 3 sites (cg17769836, cg17591574, and cg07823562) are 0.954 and 0.972, respectively (Figure 2I, 2J).
Performance of the diagnostic model
In the training set consisting of 96 normal and 510 PLC, the true positive rate and the true negative rate were 98.8% (504/510) and 94.8% (91/96), respectively (Figure 3A). Because one PLC sample has missing values, 252 normal and 599 PLC were combined as a validation set. The sensitivity and specificity were 97.3% (583/599) and 81% (204/252), respectively (Figure 3C). Compared with the normal group, cg24035245 was hypermethylated, cg21072795 and cg00261162 were hypomethylated in the HCC group regardless of training set or verification set (Figure 3B, 3D).
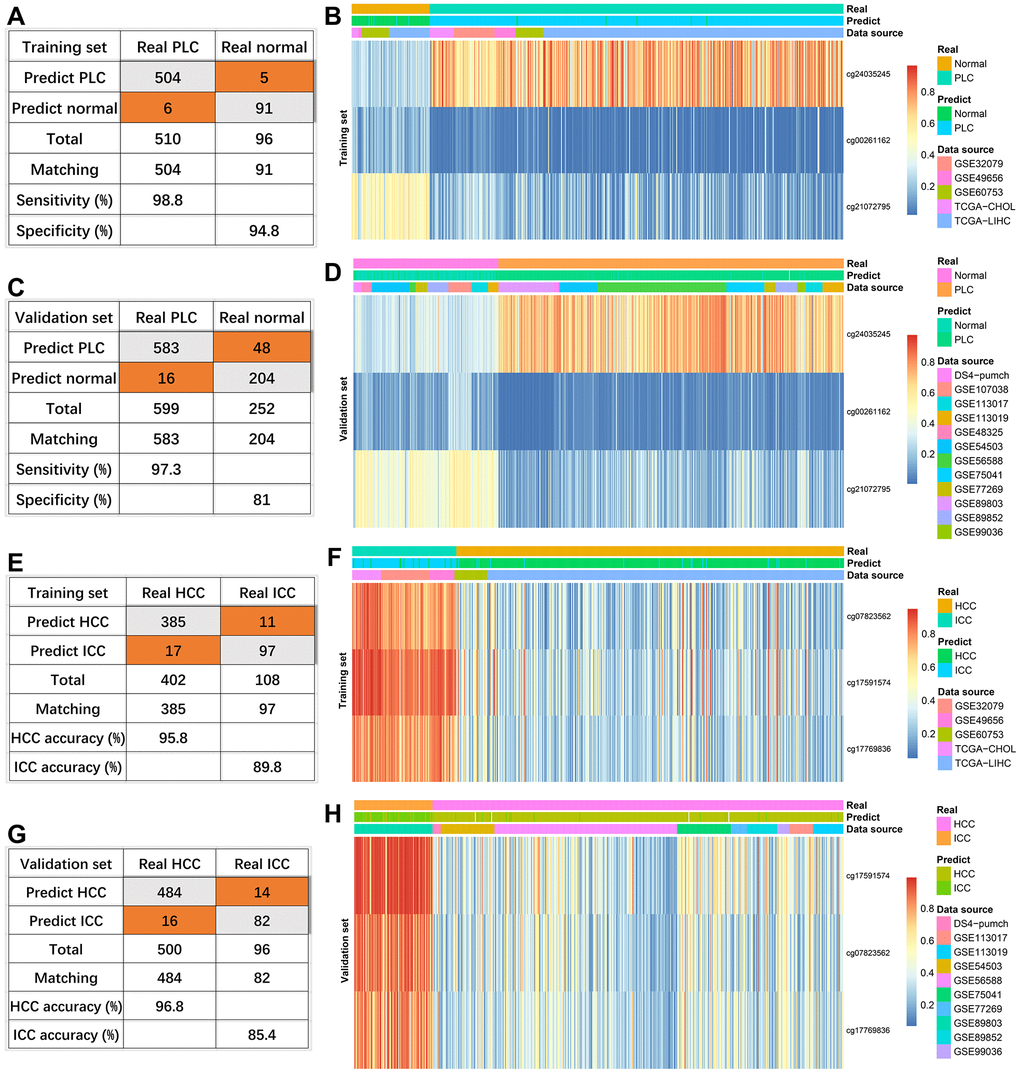
Figure 3. Effectiveness of diagnostic models. The diagnosis efficiency of the model for distinguishing between PLC and normal in the training set (A) and validation set (C). The heatmaps (PLC versus Normal) including real status, predict status, data source, and methylation values of indicated sites in the training set (B) and validation set (D). The diagnosis efficiency of the model for distinguishing between HCC and ICC in the training set (E) and validation set (G). The heatmaps (HCC versus ICC) including real status, predict status, data source, and methylation values of indicated sites in the training set (F) and validation set (H).
For three sites discriminating HCC and ICC, four HCC samples with missing values were removed. The diagnostic accuracies of HCC were 95.8% (385/402) and 96.8% (484/500) in the training set and external validation (Figure 3E, 3G). Consistent with the previous results (Figure 2H), the diagnostic accuracies of ICC were lower, 89.8% (97/108) in the training set (Figure 3E) and 85.4% (82/96) in the validation set (Figure 3G). Compared with HCC, the methylation levels of the three sites were higher in ICC in the training set and verification set (Figure 3F, 3H).
Taken together, diagnostic models based on random forest algorithm performed well in distinguishing PLC from normal and distinguishing HCC from ICC.
DNA methylation-driven genes and related pathways in HCC and ICC
DNA methylation in the promoter region or near transcription initiation sites always negatively regulated corresponding gene transcription [12]. Among these DMC sites, a total of 89 DNA Methylation-Driven genes (84 hypermethylation genes and 5 hypomethylation genes) were identified in HCC and 28 DNA Methylation-Driven genes (23 hypermethylation genes and 5 hypomethylation genes) in ICC (Figure 4A, 4C and Supplementary Tables 4, 5). The results showed that most of the DNA Methylation-Driven genes were a hypermethylated and down-regulated expression in tumor tissues. To explore the potential function of these genes, pathway enrichment analyses were achieved by MetaCore. In HCC, the enrichment pathways were mainly related to protein folding, oxidative stress, and glutathione metabolism (Figure 4B), which indicates that HCC is a metabolic disease. In ICC, these genes are highly enriched in immune response, embryonic hepatocyte maturation, and tissue factor signaling in cancer via PAR1 and PAR2 (Figure 4D), which suggested the tissue origin of ICC and its close relationship with the immune system.
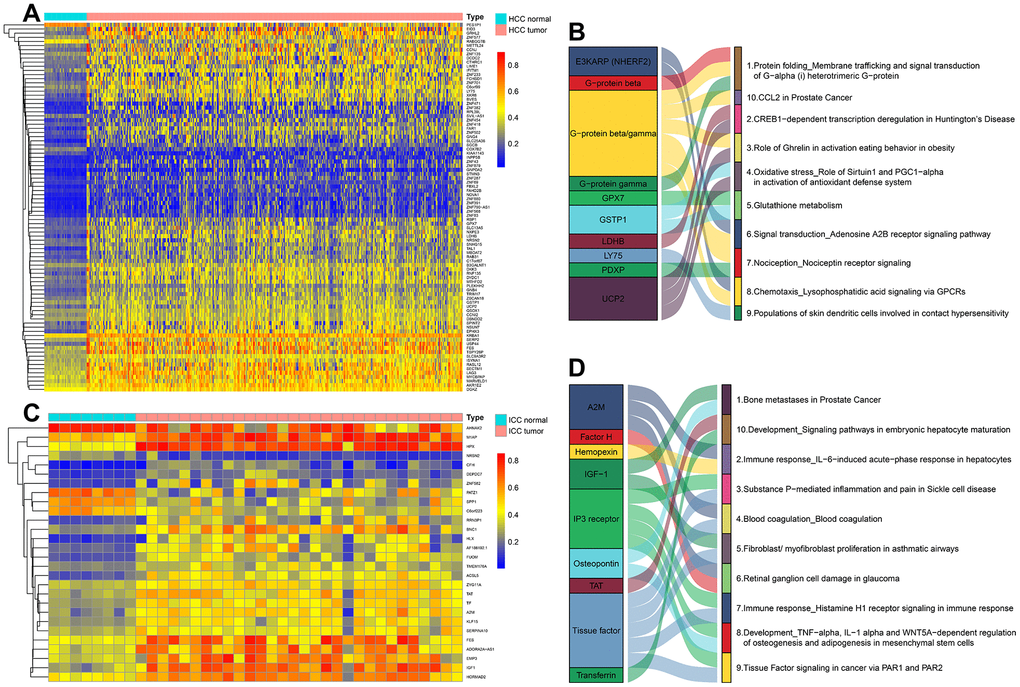
Figure 4. The methylation heatmaps and enrichment pathways of DNA methylation-driven genes. The methylation heatmap of DNA Methylation-Driven Genes in HCC (A) and ICC (C). The enrichment pathways of DNA Methylation-Driven Genes in HCC (B) and ICC (D).
Taken together, the above results indicate that integrative analysis of promoter DNA methylation and gene expression could facilitate the identification of epigenetic driving factors of cancer.
Methylator phenotype based on independent prognostic sites in HCC and ICC
Next, 31 independent prognosis associated sites in HCC and 204 independent prognosis associated sites in ICC were identified through univariate and multivariate analyses. Then we performed unsupervised consensus clustering based on these sites. In HCC and ICC, the areas under the CDF curve did not increase significantly after seven categories (Figure 5A, 5B, 5D, 5E). Therefore, HCC and ICC samples were classified into seven clusters. Besides, each cluster has relatively high consistency and low variation (Figure 5C, 5F).
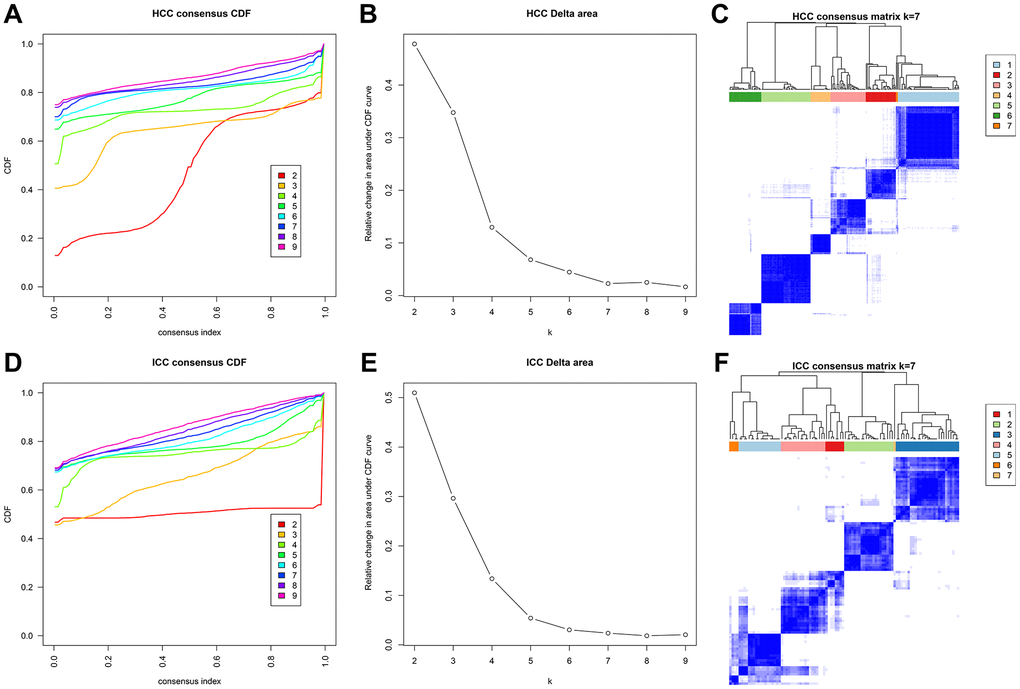
Figure 5. Methylation typing based on independent prognostic sites. Consensus cumulative distribution function (CDF) of HCC (A) and ICC (D). The X-axis represents the consensus index, and the Y-axis represents the CDF curve. The area under the CDF curve for each category in HCC (B) and ICC (E). The X-axis represents the category number k, and the Y-axis represents the CDF curve. Consensus matrix in HCC (C) and ICC (F). Different clusters are annotated with indicated numbers and colors. Color gradients in matrix represent consensus values, white corresponds to 0 and dark blue to 1.
The heatmaps annotated with clinical features and DNA methylation subgroups were shown in Figure 6A, 6C. The difference of methylation sites in cluster 5 and 6 was the largest compared with the rest of the samples in HCC. By comparing the clinical characteristics of different clusters, we found that patients in cluster 7 possessed the characteristics of early age (≤60 years), early-stage (stage I), small tumor size (T1), lymph node-negative (N0), no metastasis (M0), and well-differentiated (G3 and G4), which are indicators of better prognosis (Supplementary Table 6 and Figure 6B). Survival analysis also proves this point, cluster 7 has the best prognosis (Figure 6E). We can see that stage II and III accounted for the largest proportion in cluster 6 with the worst prognosis (Figure 6B, 6E). It suggested that patients in the later stage always have a shorter overall survival time.
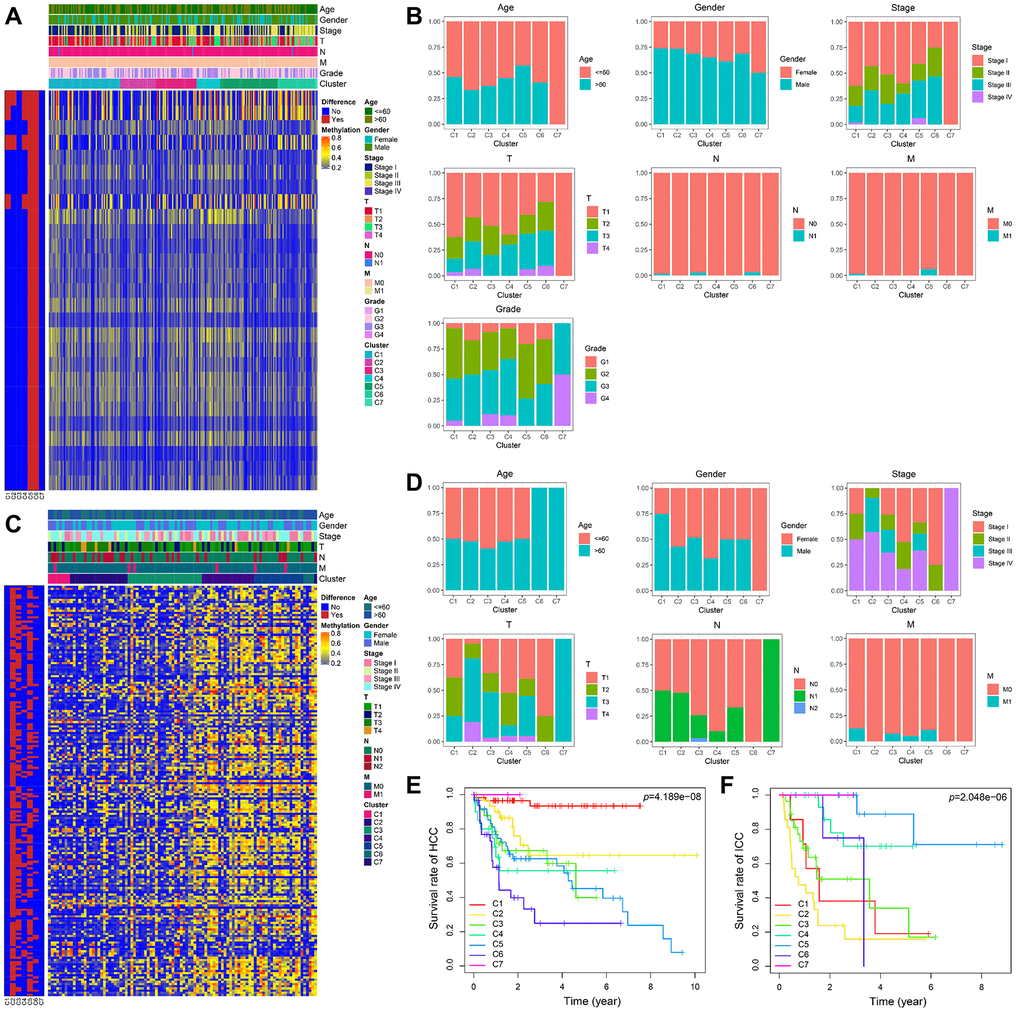
Figure 6. The methylator phenotype landscape of HCC and ICC. Heatmaps including DNA methylation classification and clinical factors indicated in HCC (A) and ICC (C). Comparison of clinical factors indicated among the DNA methylation clusters in HCC (B) and ICC (D). Kaplan-Meier survival curves of each cluster in HCC (E) and ICC (F).
In ICC, the methylation profiles of cluster 2 and cluster 5 have significant differences with other samples (Figure 6C). However, their prognosis was the opposite (Figure 6F). Compared with patients in cluster 5, more advanced stage and tumor invasive extent were observed in cluster 2 with the worst prognosis (Supplementary Table 7 and Figure 6D).
To sum up, the dysregulated methylation intensity can not only be used as prognostic biomarkers but also correlated well with clinical factors involved in tumor progression.
Discussion
The liver is the most common site of the tumor, and also the easily metastatic site of a malignant tumor from other organs [13]. HCC and ICC are important components of PLC. They have similar clinical symptoms and imaging findings, such as a round mass in the liver, abdominal pain, and abdominal distension, etc. [14, 15]. But in terms of etiology, pathogenesis, and treatment, ICC is different from HCC. Most patients with ICC are advanced at the time of diagnosis, it always hard to radical resect these no complete capsule tumors infiltrating the surrounding organs. Hence, the development of useful diagnostic biomarkers will contribute to timely and effective treatment, which may improve the prognosis of patients.
The CpG methylation site is one of the most powerful biomarkers in cancer. Accumulated studies have shown that the occurrence and development of HCC and ICC were associated with promoter hypermethylation [16]. Dysregulated DNA methylation occurs in the early stage of cancer, even though the tissue at this time was pathologically diagnosed as normal [17]. The major changes in tumors were composed of global changes and local changes at the site level (especially hypermethylation of CpG island and promoter) [18]. The whole-genome DNA hypomethylation (GDH) and the CpG island methylator phenotype (CIMP) were identified at about 90% tumor samples [11]. Therefore, epigenetic changes can be detected alone or combined with other biomarkers for accurate diagnosis of HCC and ICC.
Through differential methylation site analysis, we found that promoter regions were the most hypermethylated in tumors. The dysfunction of tumor suppressor genes is associated with aberrant methylation in the promoter region, which leads to tumorigenesis. It was reported that in tumor hypomethylation mainly occurs in the gene body region, while hypermethylation in the promoter region [19]. This is consistent with our findings. Besides, HCC and ICC have their specific methylation changes.
The existing research mainly focused on diagnostic biomarkers of HCC or ICC, and few studies have been conducted on biomarkers used to distinguish HCC from ICC. The key finding of this research is the identification of several specific methylated sites as potential diagnostic biomarkers for not only distinguishing PLC from normal but also HCC from ICC. Random forest is an ensemble learning method, which has extremely high accuracy, can effectively run-on large data sets. The contribution of sites can be reflected by Gini values. However, how many sites are included to ensure the accuracy and universality of the model has become a new challenge. Here we proposed an approach to prevent the overfitting of models. The AUCs of the models will expand with the increase of the included variables in the training sets of two diagnostic models. We also calculated the AUCs of different site combinations in the validation set. As expected, when the AUCs reach the peak, it will decrease with the increase of the included sites. To reduce the overfitting, we chose the least combination of sites that could reach the peak of AUC for its cost-effectiveness. We first build a PLC diagnostic model including cg24035245, cg21072795, and cg00261162 to distinguish PLC from normal. If it is PLC, we further differentiate between HCC and ICC through another three sites (cg17769836, cg17591574, and cg07823562). By detecting these six methylated sites, we can identify the pathological subtypes of PLC with high sensitivity and specificity.
Additionally, we identified some DNA Methylation-Driven Genes in HCC and ICC by integrated analyzing DNA methylation and gene expression data. Hypermethylation genes account for high proportions in both cancer types. In HCC, DNA Methylation-Driven Genes are mainly involved in metabolic-related signaling pathways. While in ICC, they mainly regulate the origin and immune microenvironment of cholangiocarcinoma.
Last, we used independent prognostic sites to classify HCC and ICC. After survival and clinical correlation analyses, we found later stages correlated well with methylation sites, which is a biomarker for bad prognosis in both tumor subtypes. Of note, ICC infiltration degree is a poor prognostic factor for ICC, which should be paid more attention to in clinical practice.
There are also some limitations in our study. Because biopsy is still traumatic, the diagnostic efficacy of these biomarkers should be further verified in peripheral blood. In the following study, we will develop a simple and sensitive technique to measure the methylation level of cell-free ctDNA by extracting peripheral blood. By detecting the methylation level of ctDNA, we can compare the uniformity of methylation level in tumor tissue and blood and validate the diagnosis efficiency.
Conclusions
Our study established a two-step diagnosis model based on differentially methylated sites. Firstly, cg24035245, cg21072795, and cg00261162 were used to diagnosis PLC. If the diagnosis of PLC was considered, cg17769836, cg17591574, and cg07823562 were used to further distinguish HCC from ICC. Additionally, we identified DNA Methylation-Driven Genes related pathways and performed methylator phenotype based on independent prognostic sites in HCC and ICC, respectively.
Materials and Methods
Identification of differentially methylated CpG sites
HCC and ICC related DNA methylation array data sets of Table 1 detected by Illumina Human Methylation450 BeadChip (GPL13534) were download from UCSC Cancer Browser (https://xenabrowser.net/datapages/) and the Gene Expression Omnibus (GEO) database (https://www.ncbi.nlm.nih.gov/geo/). Probe removal criteria were as follows: (1) The missing β value of methylation site >30%; (2) Methylation sites in the sex chromosome. Only shared methylation sites in training data sets were retained and performed Wilcoxon rank-sum tests in three groups (96 normal samples versus 402 HCC samples, 96 normal samples versus 108 ICC samples, and 108 ICC samples versus 402 HCC samples) after replenishing residual missing values with the Bioconductor package impute. Sites with an adjusted P-value < 0.05 and a |log2FoldChange| > 1 (log2FC) were considered DMC sites unless noted elsewhere.
Construction and optimization of diagnosis model
The diagnosis process is divided into two steps. The first step is the diagnosis of PLC. The second step is to further distinguish between HCC and ICC. Random forest method was utilized to select candidate sites with high Gini values from DMC sites (Normal versus PLC: common DMC sites of 96 normal samples versus 108 ICC samples and 96 normal samples versus 402 HCC samples; ICC versus HCC: 108 ICC samples versus 402 HCC samples) [31]. Then the combination of diagnostic sites with the minimum number and the highest AUC in both training and validation data sets (Table 1) were confirmed to avoid overfitting.
Pathway analysis of DNA methylation-driven genes
DNA methylation data and RNA-seq counts of TCGA-LIHC (41 normal and 364 HCC) and TCGA-CHOL (8 normal and 30 ICC) were acquired from The Cancer Genome Atlas (TCGA) portal (https://portal.gdc.cancer.gov/). The mean value of all methylation sites in promoter regions (from -1500 to +500 of the transcription start sites) was considered as the methylation value of the gene. The gene expression data were normalized via the edgeR method [32]. The DMC sites between normal and HCC or ICC were annotated as genes (If a site matched multiple genes, the first one was chosen as a reference). Then Bioconductor package MethylMix was used to screen DNA Methylation-Driven Genes (The correlation coefficient between selected gene methylation value and gene expression < -0.3 and an adjusted P-value < 0.05) [33]. Enrichment pathway maps were achieved from MetaCore (https://portal.genego.com/). The mean values of normal samples and tumor samples of gene expression normalized by edgeR were used as input files and the top 10 enrichment pathways were illustrated by the Sankey diagram.
Methylator phenotype of prognostic sites
Independent prognostic related HCC DMC sites were screened after univariate and multivariate analyses in TCGA LIHC (360 samples with survival time, 229 samples with complete clinical data). Similar in ICC, TCGA-CHOL (30 samples with survival time, 24 samples with complete clinical data) and GSE89803 (94 samples with survival time, 74 samples with complete clinical data) were combined for identifying prognostic sites. Based on their respective sites, the R package ConsensusClusterPlus was used to perform K-means-based consensus clustering [34]. The overall survival rates were estimated through the Kaplan-Meier approach.
Supplementary Materials
Author Contributions
YB collected and analyzed methylation data and screened candidate diagnostic markers. YB, WT, FCX, ZSL and FM helped in data analysis. YB and WT wrote the manuscript. LYZ, HW, RS, LJW, LY and QZ designed the study and revised the manuscript. YMZ supervised the study. All authors read and approved the final manuscript.
Acknowledgments
We are grateful to the TCGA and GEO working group.
Conflicts of Interest
The authors declare that they have no conflicts of interest.
Funding
This work was supported by the Tianjin Natural Science Foundation (20JCYBJC01310), Tianjin Science and Technology Project (19ZXDBSY00010), Tianjin Health Science and technology project (ZC20218), and Tianjin Health Science and Technology Project (ZC20064).
Editorial Note
This corresponding author has a verified history of publications using a personal email address for correspondence
References
- 1. Bray F, Ferlay J, Soerjomataram I, Siegel RL, Torre LA, Jemal A. Global cancer statistics 2018: GLOBOCAN estimates of incidence and mortality worldwide for 36 cancers in 185 countries. CA Cancer J Clin. 2018; 68:394–424. https://doi.org/10.3322/caac.21492 [PubMed]
- 2. Wang A, Wu L, Lin J, Han L, Bian J, Wu Y, Robson SC, Xue L, Ge Y, Sang X, Wang W, Zhao H. Whole-exome sequencing reveals the origin and evolution of hepato-cholangiocarcinoma. Nat Commun. 2018; 9:894. https://doi.org/10.1038/s41467-018-03276-y [PubMed]
- 3. Akinyemiju T, Abera S, Ahmed M, Alam N, Alemayohu MA, Allen C, Al-Raddadi R, Alvis-Guzman N, Amoako Y, Artaman A, Ayele TA, Barac A, Bensenor I, et al, and Global Burden of Disease Liver Cancer Collaboration. The Burden of Primary Liver Cancer and Underlying Etiologies From 1990 to 2015 at the Global, Regional, and National Level: Results From the Global Burden of Disease Study 2015. JAMA Oncol. 2017; 3:1683–91. https://doi.org/10.1001/jamaoncol.2017.3055 [PubMed]
- 4. Rizvi S, Khan SA, Hallemeier CL, Kelley RK, Gores GJ. Cholangiocarcinoma - evolving concepts and therapeutic strategies. Nat Rev Clin Oncol. 2018; 15:95–111. https://doi.org/10.1038/nrclinonc.2017.157 [PubMed]
- 5. Llovet JM, Montal R, Sia D, Finn RS. Molecular therapies and precision medicine for hepatocellular carcinoma. Nat Rev Clin Oncol. 2018; 15:599–616. https://doi.org/10.1038/s41571-018-0073-4 [PubMed]
- 6. Zhou J, Sun HC, Wang Z, Cong WM, Wang JH, Zeng MS, Yang JM, Bie P, Liu LX, Wen TF, Han GH, Wang MQ, Liu RB, et al. Guidelines for Diagnosis and Treatment of Primary Liver Cancer in China (2017 Edition). Liver Cancer. 2018; 7:235–60. https://doi.org/10.1159/000488035 [PubMed]
- 7. Marrero JA, Kulik LM, Sirlin CB, Zhu AX, Finn RS, Abecassis MM, Roberts LR, Heimbach JK. Diagnosis, Staging, and Management of Hepatocellular Carcinoma: 2018 Practice Guidance by the American Association for the Study of Liver Diseases. Hepatology. 2018; 68:723–50. https://doi.org/10.1002/hep.29913 [PubMed]
- 8. Koch A, Joosten SC, Feng Z, de Ruijter TC, Draht MX, Melotte V, Smits KM, Veeck J, Herman JG, Van Neste L, Van Criekinge W, De Meyer T, van Engeland M. Analysis of DNA methylation in cancer: location revisited. Nat Rev Clin Oncol. 2018; 15:459–66. https://doi.org/10.1038/s41571-018-0004-4 [PubMed]
- 9. Jones PA. Functions of DNA methylation: Islands, start sites, gene bodies and beyond. Nat Rev Genet. 2012; 13:484–92. https://doi.org/10.1038/nrg3230 [PubMed]
- 10. Xu RH, Wei W, Krawczyk M, Wang W, Luo H, Flagg K, Yi S, Shi W, Quan Q, Li K, Zheng L, Zhang H, Caughey BA, et al. Circulating tumour DNA methylation markers for diagnosis and prognosis of hepatocellular carcinoma. Nat Mater. 2017; 16:1155–61. https://doi.org/10.1038/nmat4997 [PubMed]
- 11. Zheng Y, Huang Q, Ding Z, Liu T, Xue C, Sang X, Gu J. Genome-wide DNA methylation analysis identifies candidate epigenetic markers and drivers of hepatocellular carcinoma. Brief Bioinform. 2018; 19:101–08. https://doi.org/10.1093/bib/bbw094 [PubMed]
- 12. Huang WY, Hsu SD, Huang HY, Sun YM, Chou CH, Weng SL, Huang HD. MethHC: a database of DNA methylation and gene expression in human cancer. Nucleic Acids Res. 2015; 43:D856–61. https://doi.org/10.1093/nar/gku1151 [PubMed]
- 13. Sia D, Villanueva A, Friedman SL, Llovet JM. Liver Cancer Cell of Origin, Molecular Class, and Effects on Patient Prognosis. Gastroenterology. 2017; 152:745–61. https://doi.org/10.1053/j.gastro.2016.11.048 [PubMed]
- 14. Bridgewater J, Galle PR, Khan SA, Llovet JM, Park JW, Patel T, Pawlik TM, Gores GJ. Guidelines for the diagnosis and management of intrahepatic cholangiocarcinoma. J Hepatol. 2014; 60:1268–89. https://doi.org/10.1016/j.jhep.2014.01.021 [PubMed]
- 15. Forner A, Reig M, Bruix J. Hepatocellular carcinoma. Lancet. 2018; 391:1301–14. https://doi.org/10.1016/S0140-6736(18)30010-2 [PubMed]
- 16. Zheng YF, Lu X, Zhang XY, Guan BG. The landscape of DNA methylation in hepatocellular carcinoma. J Cell Physiol. 2019; 234:2631–38. https://doi.org/10.1002/jcp.27077 [PubMed]
- 17. Villanueva A, Portela A, Sayols S, Battiston C, Hoshida Y, Méndez-González J, Imbeaud S, Letouzé E, Hernandez-Gea V, Cornella H, Pinyol R, Solé M, Fuster J, et al, and HEPTROMIC Consortium. DNA methylation-based prognosis and epidrivers in hepatocellular carcinoma. Hepatology. 2015; 61:1945–56. https://doi.org/10.1002/hep.27732 [PubMed]
- 18. Ehrlich M. DNA hypermethylation in disease: mechanisms and clinical relevance. Epigenetics. 2019; 14:1141–63. https://doi.org/10.1080/15592294.2019.1638701 [PubMed]
- 19. Cheng J, Wei D, Ji Y, Chen L, Yang L, Li G, Wu L, Hou T, Xie L, Ding G, Li H, Li Y. Integrative analysis of DNA methylation and gene expression reveals hepatocellular carcinoma-specific diagnostic biomarkers. Genome Med. 2018; 10:42. https://doi.org/10.1186/s13073-018-0548-z [PubMed]
- 20. Chan-On W, Nairismägi ML, Ong CK, Lim WK, Dima S, Pairojkul C, Lim KH, McPherson JR, Cutcutache I, Heng HL, Ooi L, Chung A, Chow P, et al. Exome sequencing identifies distinct mutational patterns in liver fluke-related and non-infection-related bile duct cancers. Nat Genet. 2013; 45:1474–78. https://doi.org/10.1038/ng.2806 [PubMed]
- 21. Hlady RA, Tiedemann RL, Puszyk W, Zendejas I, Roberts LR, Choi JH, Liu C, Robertson KD. Epigenetic signatures of alcohol abuse and hepatitis infection during human hepatocarcinogenesis. Oncotarget. 2014; 5:9425–43. https://doi.org/10.18632/oncotarget.2444 [PubMed]
- 22. Wang P, Dong Q, Zhang C, Kuan PF, Liu Y, Jeck WR, Andersen JB, Jiang W, Savich GL, Tan TX, Auman JT, Hoskins JM, Misher AD, et al. Mutations in isocitrate dehydrogenase 1 and 2 occur frequently in intrahepatic cholangiocarcinomas and share hypermethylation targets with glioblastomas. Oncogene. 2013; 32:3091–100. https://doi.org/10.1038/onc.2012.315 [PubMed]
- 23. Jusakul A, Cutcutache I, Yong CH, Lim JQ, Huang MN, Padmanabhan N, Nellore V, Kongpetch S, Ng AW, Ng LM, Choo SP, Myint SS, Thanan R, et al. Whole-Genome and Epigenomic Landscapes of Etiologically Distinct Subtypes of Cholangiocarcinoma. Cancer Discov. 2017; 7:1116–35. https://doi.org/10.1158/2159-8290.CD-17-0368 [PubMed]
- 24. Ahrens M, Ammerpohl O, von Schönfels W, Kolarova J, Bens S, Itzel T, Teufel A, Herrmann A, Brosch M, Hinrichsen H, Erhart W, Egberts J, Sipos B, et al. DNA methylation analysis in nonalcoholic fatty liver disease suggests distinct disease-specific and remodeling signatures after bariatric surgery. Cell Metab. 2013; 18:296–302. https://doi.org/10.1016/j.cmet.2013.07.004 [PubMed]
- 25. Shen J, Wang S, Zhang YJ, Wu HC, Kibriya MG, Jasmine F, Ahsan H, Wu DP, Siegel AB, Remotti H, Santella RM. Exploring genome-wide DNA methylation profiles altered in hepatocellular carcinoma using Infinium HumanMethylation 450 BeadChips. Epigenetics. 2013; 8:34–43. https://doi.org/10.4161/epi.23062 [PubMed]
- 26. Yang Y, Chen L, Gu J, Zhang H, Yuan J, Lian Q, Lv G, Wang S, Wu Y, Yang YT, Wang D, Liu Y, Tang J, et al. Recurrently deregulated lncRNAs in hepatocellular carcinoma. Nat Commun. 2017; 8:14421. https://doi.org/10.1038/ncomms14421 [PubMed]
- 27. Kuramoto J, Arai E, Tian Y, Funahashi N, Hiramoto M, Nammo T, Nozaki Y, Takahashi Y, Ito N, Shibuya A, Ojima H, Sukeda A, Seki Y, et al. Genome-wide DNA methylation analysis during non-alcoholic steatohepatitis-related multistage hepatocarcinogenesis: comparison with hepatitis virus-related carcinogenesis. Carcinogenesis. 2017; 38:261–70. https://doi.org/10.1093/carcin/bgx005 [PubMed]
- 28. Jee BA, Choi JH, Rhee H, Yoon S, Kwon SM, Nahm JH, Yoo JE, Jeon Y, Choi GH, Woo HG, Park YN. Dynamics of Genomic, Epigenomic, and Transcriptomic Aberrations during Stepwise Hepatocarcinogenesis. Cancer Res. 2019; 79:5500–12. https://doi.org/10.1158/0008-5472.CAN-19-0991 [PubMed]
- 29. Bacalini MG, Franceschi C, Gentilini D, Ravaioli F, Zhou X, Remondini D, Pirazzini C, Giuliani C, Marasco E, Gensous N, Di Blasio AM, Ellis E, Gramignoli R, et al. Molecular Aging of Human Liver: An Epigenetic/Transcriptomic Signature. J Gerontol A Biol Sci Med Sci. 2019; 74:1–8. https://doi.org/10.1093/gerona/gly048 [PubMed]
- 30. Shimada S, Mogushi K, Akiyama Y, Furuyama T, Watanabe S, Ogura T, Ogawa K, Ono H, Mitsunori Y, Ban D, Kudo A, Arii S, Tanabe M, et al. Comprehensive molecular and immunological characterization of hepatocellular carcinoma. EBioMedicine. 2019; 40:457–70. https://doi.org/10.1016/j.ebiom.2018.12.058 [PubMed]
- 31. Breiman L. Random Forests. Machine Learning. 2001; 45:5–32. https://doi.org/10.1023/A:1010933404324
- 32. Robinson MD, McCarthy DJ, Smyth GK. edgeR: a Bioconductor package for differential expression analysis of digital gene expression data. Bioinformatics. 2010; 26:139–40. https://doi.org/10.1093/bioinformatics/btp616 [PubMed]
- 33. Gevaert O. MethylMix: an R package for identifying DNA methylation-driven genes. Bioinformatics. 2015; 31:1839–41. https://doi.org/10.1093/bioinformatics/btv020 [PubMed]
- 34. Wilkerson MD, Hayes DN. ConsensusClusterPlus: a class discovery tool with confidence assessments and item tracking. Bioinformatics. 2010; 26:1572–73. https://doi.org/10.1093/bioinformatics/btq170 [PubMed]