


Introduction
Obesity is a complex chronic disease caused by multiple elements, and is characterized by excessive accumulation of lipids. Obesity is often accompanied by life-threatening diseases, such as atherosclerosis, hyperlipidemia, fatty liver, diabetes, cancer, etc [1, 2]. In our body, excessive ingested energy is stocked in adipose tissue in the form of fat, which is discomposed to fatty acid, released into the blood and used as an energy supply for other tissues in the absence of external energy supply [3]. Therefore, adipose tissues are regarded as important organs for energy storage and important regulators for maintaining the energy balance and glucose homeostasis [4]. However, obesity develops when adipose tissue accumulates excessively. The obesity phenotype is mainly induced by the transformation from pre-adipocytes to adipocytes due to the enlargement and proliferation of adipose tissues [5]. The conversion of preadipocytes to adipocytes is mediated by a series of key transcriptional factors, including peroxisome proliferator-activated receptor γ (PPARγ) and CCAAT enhancer-binding protein α (C/EBPα), which regulate the expressions of multiple lipid proteins [6, 7]. PPARγ is classified into three subtypes: PPARγ1, PPARγ2, and PPARγ3. PPARγ1 is lowly expressed in most tissues and PPARγ3 is mainly expressed in macrophages and large intestine cells [8]. PPARγ2 is mainly expressed in adipose tissues and is reported to be involved in the advanced stage of adipocyte differentiation [9]. The significance of PPARγ in adipocytes was verified in PPARγ knockdown mice, which were found dead several days after maturation [10]. When PPARγ is activated, a dimer is formed through the binding between PPARγ and its retinoic acid receptor, further regulating the transcription of its downstream target genes by interacting with the specific peroxisome proliferator responsive element (PPRE) of these target genes, including fatty acid-binding protein 4 (FABP4) and sterol regulatory element-binding protein 1c (SREBP1c) [11]. C/EBP is the first discovered transcriptional factor that plays an important role in the process of adipocytes differentiation, it is classified into 6 isomers. In the differentiation process of 3T3-L1 preadipocytes, C/EBPα, C/EBPβ, and C/EBPδ are the main functional isomers. In the early stage of adipocytes differentiation, C/EBPβ, and C/EBPδ are significantly upregulated by stimulation of hormones, further activating the expressions of PPARγ and C/EBPα to induce the differentiation of adipocytes [12]. Therefore, upregulation of PPARγ and C/EBPα is observed in the advanced stage of adipocyte differentiation and might be an effective target for the treatment of obesity.
Trichostatin A (TSA) is a novel histone deacetylase inhibitor (HDACI) that belongs to the isohydroxamic acid category. TSA suppresses the activity of histone deacetylase by binding to the zinc ionic bond at the bottom of the tubular structure of histone deacetylase with its isohydroxamic acid ligand [13]. TSA is reported to exert many pharmacological functions, such as anti-inflammation [14], anti-tumor property [15], and neuroprotective effects [16]. Recently, inactivation effects on PPARγ [17] and C/EBPα [18] have been reported. In the present study, the inhibitory effect of TSA on adipocyte differentiation, as well as the underlying mechanism, will be investigated to explore the potential therapeutic property of TSA on obesity.
Results
The effects of TSA on cell viability of 3T3-L1 cells
Cells were stimulated with 0.1, 0.25, 0.5, 1, 2.5, and 5 μM TSA for 4 days and 8 days, followed by evaluating the cell viability with an MTT assay. As shown in Figure 1, on both Day 4 and 8, no significant difference in the cell viability was observed as the concentration of TSA increased from 0.1 to 1 μM. However, the cell viability decreased significantly as the concentration of TSA increased to 2.5 and 5 μM. Therefore, 0.5 and 1 μM were utilized in the subsequent experiments.
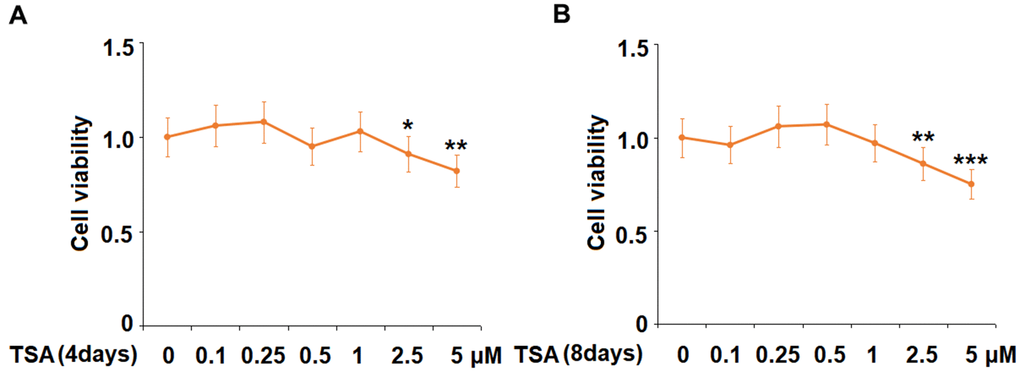
Figure 1. The effects of TSA on cell viability of 3T3-L1 cells. Cells were stimulated with 0.1, 0.25, 0.5, 1, 2.5, and 5 μM TSA for 4 days and 8 days. (A) Cell viability was determined using an MTT on day 4; (B) Cell viability was determined with MTT on day 8 (n= 5-6, *, **, ***, P<0.05, 0.01, 0.001 vs. vehicle group).
TSA inhibited adipogenesis of 3T3-L1 cells
To evaluate the impact of TSA on adipogenesis in 3T3-L1 cells, cells were incubated with a differentiation cocktail (DMI) medium with TSA (0.5 and 1 μM). As shown in Figure 2, the lipid accumulation was significantly elevated by stimulation with DMI, but was dramatically suppressed by the introduction of TSA in a dose-dependent manner.
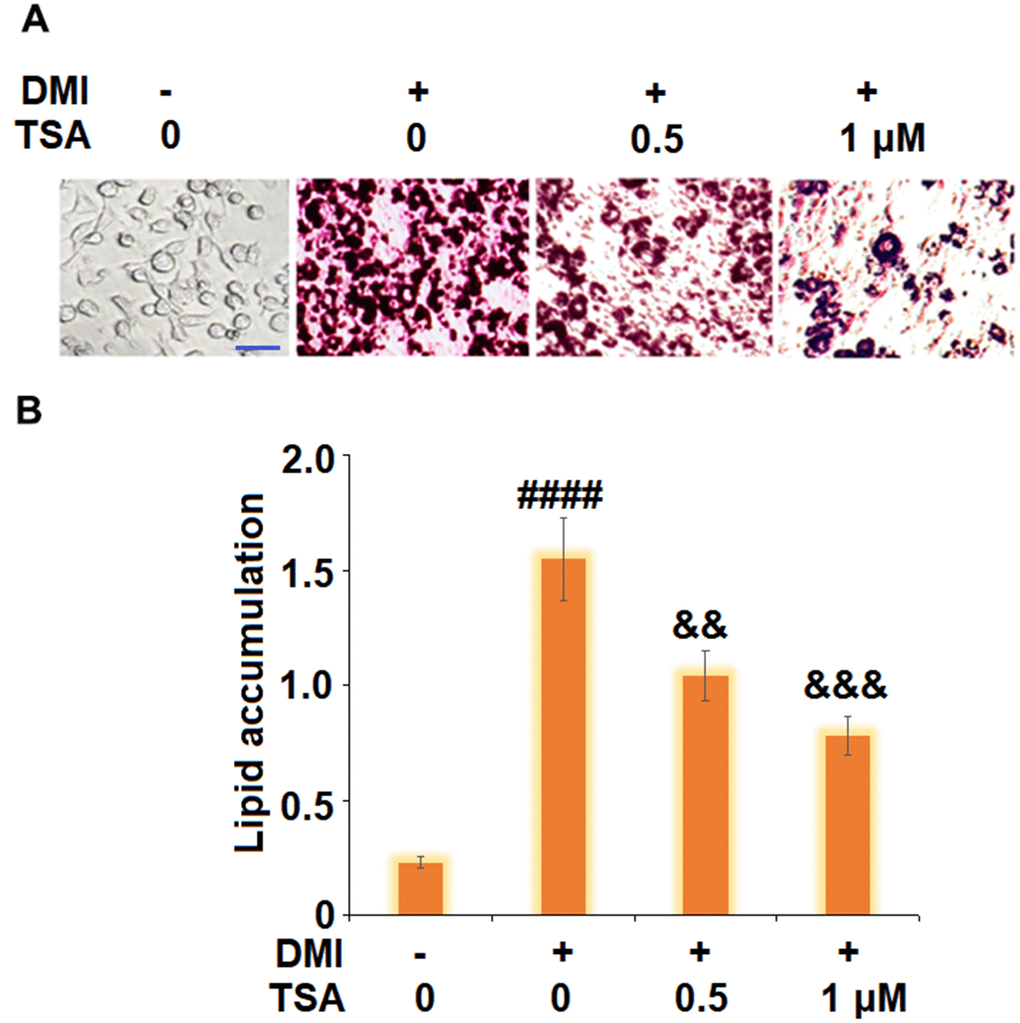
Figure 2. TSA inhibits adipogenesis of 3T3-L1 cells. Cells were incubated with a differentiation cocktail (DMI) medium with TSA (0.5 and 1 μM). (A) Cells were stained with Oil Red O on day 8; (B) Lipid accumulation was examined by measuring absorbance at 540 nm of Oil Red O staining. Scale bar, 100 μm (n=5-6, ####, P<0.0001 vs. vehicle group; &&, &&&, P<0.01, 0.001 vs. DMI treatment group).
TSA promoted lipolysis during 3T3-L1 adipogenesis
The levels of triglyceride and glycerol were detected to evaluate the lipolysis of 3T3-L1 cells. As shown in Figure 3A, compared to the control, the level of triglyceride was increased from 9.8 nmol/mg protein to 32.3 nmol/mg protein by stimulation with DMI but was inhibited to 22.9 and 15.3 nmol/mg protein by treatment with 0.5 and 1 μM TSA, respectively. In addition, the release of glycerol was elevated from 6.3 nmol/mg protein to 10.5 nmol/mg protein by the treatment with DMI but was decreased to 15.3 and 19.1 nmol/mg protein by the introduction of 0.5 and 1 μM TSA, respectively. These data indicate that the lipolysis during 3T3-L1 adipogenesis was promoted by TSA.
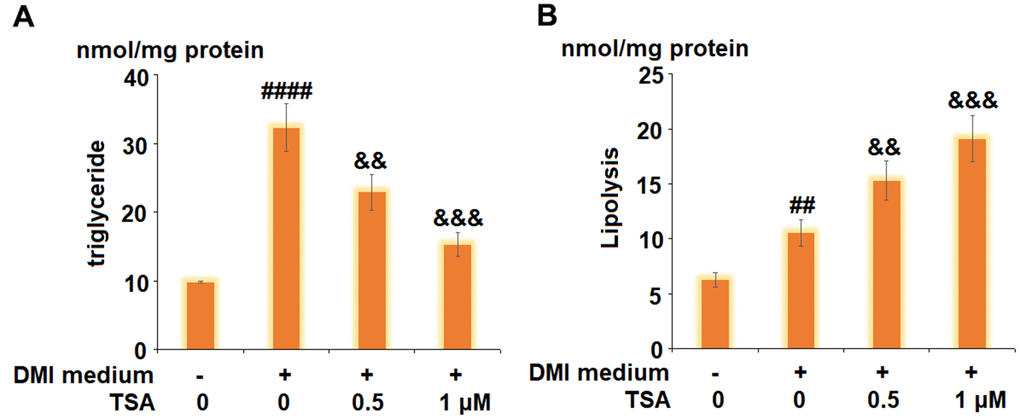
Figure 3. TSA promotes lipolysis during 3T3-L1 adipogenesis. Cells were incubated with differentiation cocktail (DMI) medium with TSA (0.5 and 1 μM). (A) Total level of triglyceride; (B) Lipolysis is shown as glycerol release (n=5-6, ##, ####, P<0.01, 0.0001, VS. vehicle group; &&, &&&, P<0.01, 0.001 vs. DMI treatment group).
TSA suppressed the expression of Leptin, FABP4, and SREBP1C during 3T3-L1 adipogenesis
We further measured the expression level of adipogenesis-related genes. As shown in Figure 4, the gene expression levels of Leptin, FABP4, and SREBP1C were significantly promoted by incubation with DMI and greatly suppressed by the introduction of TSA. These data indicate that the process of 3T3-L1 adipogenesis might be suppressed by TSA.
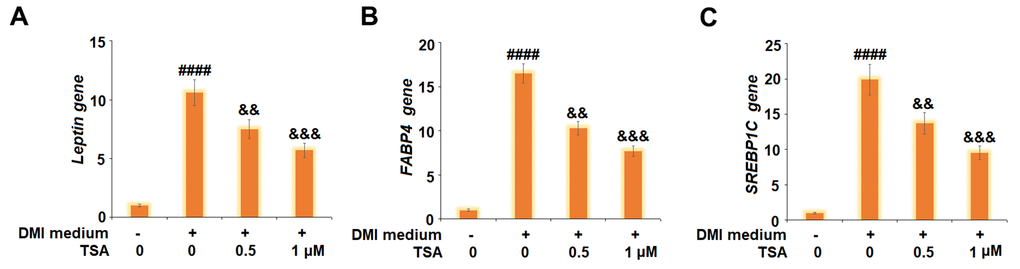
Figure 4. TSA suppresses the expression of Leptin, FABP4, and SREBP1C during 3T3-L1 adipogenesis. Cells were incubated with a differentiation cocktail (DMI) medium with TSA (0.5 and 1 μM). (A) mRNA of Leptin; (B) mRNA of FABP4; (C) mRNA of SREBP1C (n=5-6, ####, P<0.0001 vs. vehicle group; &&, &&&, P<0.01, 0.001 vs. DMI treatment group).
TSA suppressed the expression of adipogenic and lipogenic transcriptional factors in 3T3-L1 cells
The gene and protein expression levels of PPAR-γ and C/EBPα were subsequently evaluated. As shown in Figure 5, we found that PPAR-γ and C/EBPα were significantly upregulated by DMI incubation and later downregulated by treatment with TSA. These data indicate that the expressions of adipogenic and lipogenic transcriptional factors in 3T3-L1 cells induced by DMI were pronouncedly inhibited by TSA.
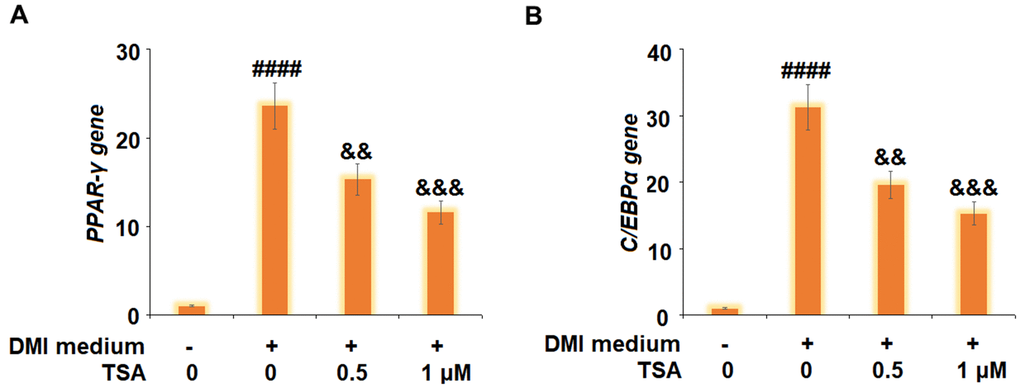
Figure 5. TSA suppresses the expression of adipogenic and lipogenic transcriptional factors in 3T3-L1 cells. Cells were incubated with a differentiation cocktail (DMI) medium with TSA (0.5 and 1 μM). (A) mRNA of PPAR-γ; (B) mRNA of C/EBPα (n=5-6, ####, P<0.0001 vs. vehicle group; &&, &&&, P<0.01, 0.001 vs. DMI treatment group).
TSA inhibited adipogenesis by activating the AMPK pathway
To explore the potential mechanism, cells were incubated with a differentiation cocktail (DMI) medium with TSA (1 μM). The expression of p-AMPKα was significantly suppressed by treatment with DMI but dramatically elevated by the introduction of TSA. Subsequently, 3T3-L1 cells were incubated with differentiation cocktail (DMI) medium with TSA (1 μM) or Compound C (10 μM), an inhibitor of the AMPK pathway, for 8 days. As shown in Figure 6B, the elevated expression level of PPAR-γ induced by DMI was significantly inhibited by treatment with TSA, and further promoted by the co-incubation with Compound C. In addition, the increased lipid accumulation (Figure 6C) in 3T3-L1 cells induced with DMI was greatly suppressed by treatment with TSA and further elevated by the co-incubation with Compound C. These data indicate that the bio function of TSA might be mediated by the activation of the AMPK pathway.
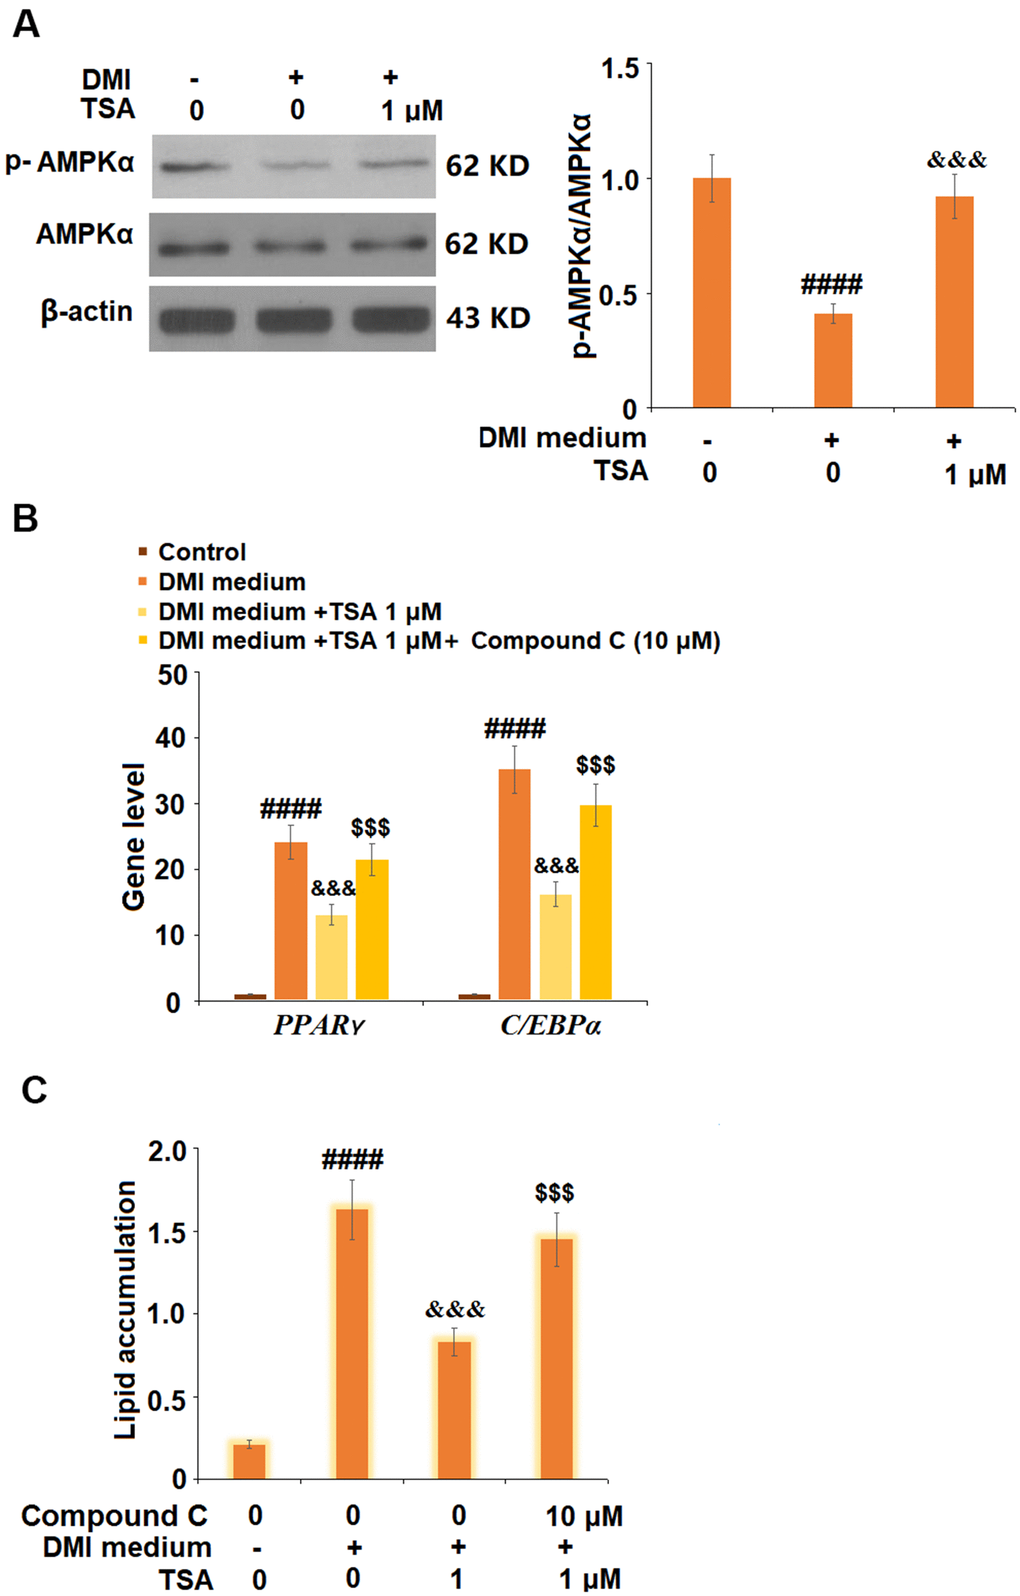
Figure 6. TSA activates the AMPK pathway. (A) Cells were incubated with a differentiation cocktail (DMI) medium with TSA (1 μM). Phosphorylated and total levels of AMPKα were measured; (B) Cells were incubated with differentiation cocktail (DMI) medium with TSA (1 μM) or Compound C (10 μM) for 8 days. mRNA of PPAR-γ and C/EBPα; (C) Lipid accumulation was examined by measuring absorbance at 540 nm of Oil Red O (n=5-6, ####, P<0.0001 vs. vehicle group; &&&, P< 0.001 vs. DMI treatment group; $$$, P<0.001 vs. DMI+TSA group).
TSA reduced the weight of visceral adipocyte tissue and the bodyweight of HFD-fed obese mice
To verify the inhibitory effect of TSA against obesity, the obese mice were established followed by consecutive treatment with TSA. As shown in Figure 7A, compared to the control, the body weight of mice in the HFD group was elevated from 28.1 g to 39.5 g and suppressed to 34.9 g and 33.1 g after the administration of 1 mg/kg and 2 mg/kg TSA, respectively. HE staining images (Figures 7B, 7C) indicated that compared to the control, an enlarged size of adipocytes was observed in the HFD group but significantly alleviated by treatment with 1 mg/kg and 2 mg/kg TSA. In addition, as shown in Figure 7D, significantly higher visceral adipose tissue weight was observed in the HFD group which was decreased in the 1 mg/kg and 2 mg/kg TSA groups. These data verified the inhibitory property of TSA against the HFD-induced obesity in mice.
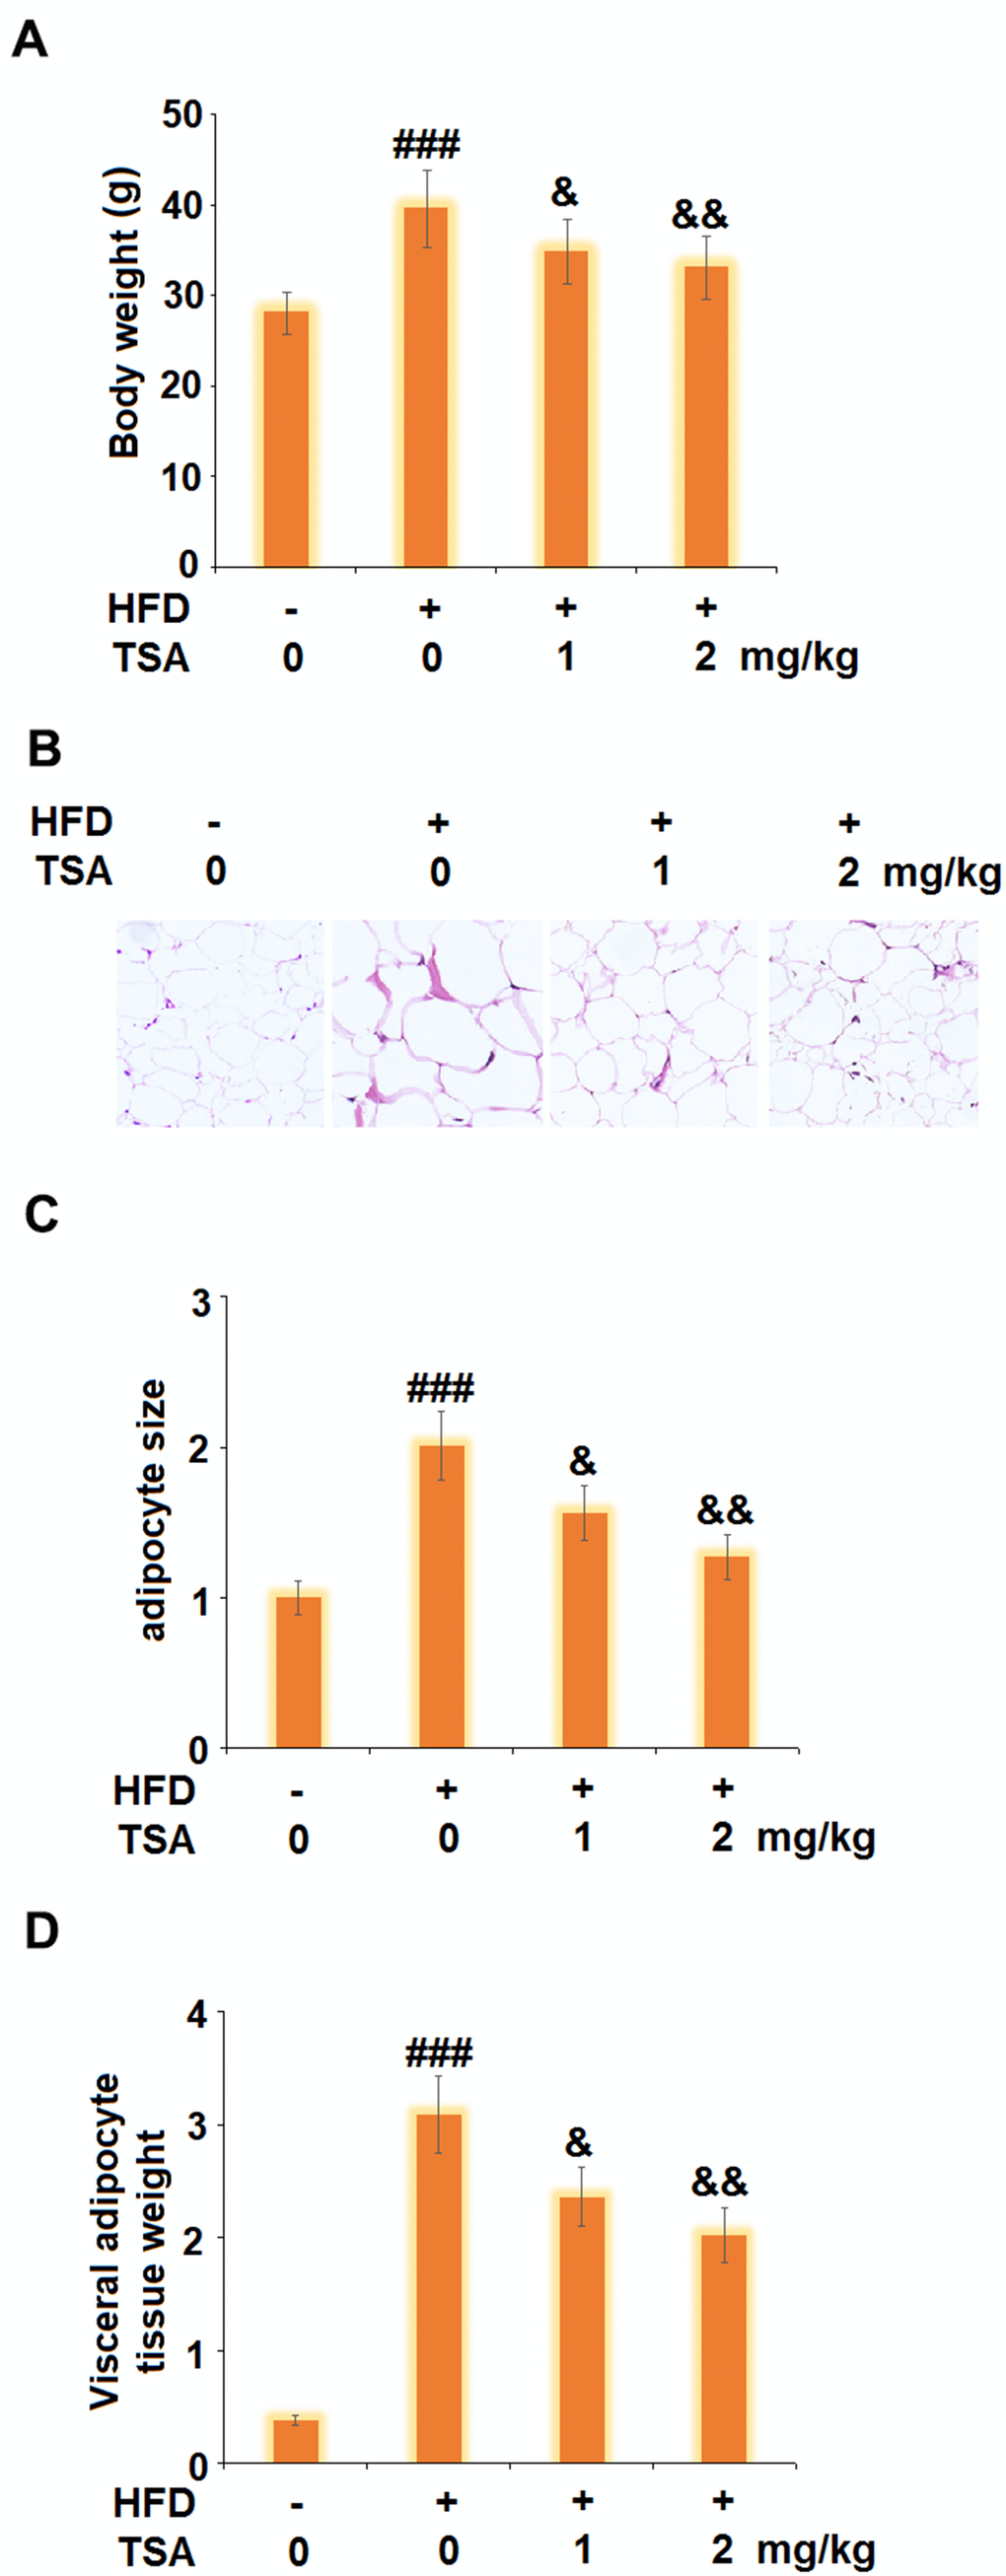
Figure 7. TSA reduces the weight of visceral adipocyte tissue and the bodyweight of HFD-induced obese mice (10 weeks, start with 6-8 weeks old B6 male mice). (A) Bodyweight; (B) Histological sections of visceral adipocyte tissue; (C) Quantification of adipocyte size; (D) Visceral adipocyte tissue weight (n=5-6, ###, P<0.001 vs. vehicle group; &, &&, P<0.05, 0.01 vs. HFD group).
Discussion
With the upturn in living standards, obesity has become a global health issue due to irregular lifestyles and eating habits. At the cellular level, obesity is mainly caused by the increase in size and number of adipocytes [19], originating from the transformation of preadipocytes. The transformation from preadipocytes to mature adipocytes is mediated by several stimulators, such as glucocorticoids, cAMP activator, and insulin. The murine preadipocyte cell line, 3T3-L1 cells, are widely used to obtain mature adipocytes in-vitro under the stimulation of adipogenesis factors [20]. Following the procedure of transformation initiates, a series of transcriptional factors, including PPAR-γ and C/EBPα, are activated, inducing the expressions of metabolic genes and adipocytokines, such as FABP4, glucose transporter 4 (GLUT4), and leptin [21]. It is reported that after 3T3-L1 cells are stimulated with adipogenesis factors, the epigenetic state of PPAR-γ is regulated by C/EBPα and glucocorticoid receptor [22]. The investigations on histone modification sites at the genomic level show that several functional enhancement sites are observed at approximately 122 kb from the originating site of transcription in PPAR [23]. Due to the dynamic changes of histone acetylation during adipogenesis, multiple proteins that regulate these enhancement sites have been proven to be involved in the differentiation process of adipocytes. For example, adipogenesis can be inhibited by suppressing the type II HDAC protein [24]. In the present study, the inhibitory effect of TSA, an inhibitor of HDAC, on adipogenesis and obesity was investigated. We established the adipogenesis in vitro model by incubating 3T3-L1 cells with DMI, which was verified by elevated lipid accumulation, increased release of triglyceride and glycerol, upregulated adipocytokines, and promoted expression level of adipocytic transcriptional factors. By the incubation with TSA, these adipogenesis symptoms were significantly reversed, indicating that TSA has a promising inhibitory effect on the transformation from preadipocytes to adipocytes. In addition, in HFD-fed mice, TSA treatment significantly ameliorated the pathological state, elevated body weight and adipose tissue weight, directly indicating the potential therapeutic properties for obesity. In our future work, the inhibitory effect of TSA on the adipocytic transcriptional factors will be verified by co-treatment with the activator of PPAR-γ and C/EBPα.
Adenosine activated protein kinase (AMPK) is an important enzyme involved in the regulation of cellular metabolism. The anabolic enzymes of lipid acids and cholesterol, such as acetyl-CoA carboxylase (ACC) and hydroxymethyl glutarate monoacyl coenzyme A reductase (HMGCR), can be activated by the phosphorylation of AMPK, further decreasing the level of lipid acids and cholesterol in the blood [25, 26]. It is reported that the expression of PPAR-γ and C/EBPα is regulated by the AMPK pathway [27], further contributing to the inhibition of the differentiation from preadipocytes to adipocytes [28]. In the present study, we found that the decreased expression level of p-AMPK induced by DMI treatment was significantly reversed by TSA, indicating an activation effect of TSA against the AMPK signaling pathway. In addition, the inhibitory effect of TSA against the expression of PPAR-γ and the adipogenesis of 3T3-L1 cells was significantly abolished by co-incubation with the inhibitor of AMPK, indicating that the activation of the AMPK pathway was involved in the therapeutic mechanism of TSA. In our future work, the involvement of the AMPK pathway will be further verified by co-administrating the obese mice with TSA and the inhibitor of the AMPK pathway to better understand the therapeutic property of TSA against obesity.
Taken together, our data indicate that TSA inhibited the adipogenesis in 3T3-L1 preadipocytes by activating the AMPK pathway.
Materials and Methods
Cells and treatments
Mouse embryo 3T3-L1 cells were purchased from ATCC (Maryland, USA) and were cultured in DMEM medium (Thermo Fisher Scientific, USA) containing 10% fetal bovine serum (FBS) (Gibco, USA) at 37° C and 5% CO2. For adipogenesis, 3T3-L1 cells were incubated with a differentiation cocktail (DMI) medium (Sigma-Aldrich, USA). Differentiation cocktail (DMI) medium contains 0.5 mM 3-isobutyl-1-methylxanthine (IBMX) (Sigma, USA), 1 μM dexamethasone (Sigma, USA) and 10μg/mL insulin (Sigma, USA).
Animals and treatments
All animal experiments were performed in accordance with the regulations of the Ethics Committee of Jinan University. The B6 male mice, aged 6-8 weeks were purchased from Beijing Vital River Laboratory Animal Technology Co., Ltd. (Beijing, China), and fed with a high-fat diet (HFD) for 10 weeks consecutively to establish an obesity animal model. The animals were divided into 4 groups: Control (Animals were fed with regular diet), HFD (Animals were fed with HFD and treated with normal saline), 1 mg/kg TSA (Animals were fed with HFD and treated with 1 mg/kg TSA), and 2 mg/kg TSA (Animals were fed with HFD and treated with 2 mg/kg TSA). After the treatments, animals were weighed and sacrificed with euthanasia and the adipose tissues were extracted for histological evaluation and weighing.
MTT assay
3T3-L1 cells were planted on a 96-well plate (Thermo, Massachusetts, USA) at a density of 5×10⁴/mL, followed by incubation for 4 hours and replacing the medium with a blank DMEM medium. Subsequently, 20 μL MTT (2 mg/mL) solution was added into each well for incubation for an additional 4 hours at 37° C. Formazan crystal pellets were then dissolved with DMSO (Sigma-Aldrich, Missouri, USA). Lastly, the absorbance at 570 nm was measured using a microplate reader (Bio-Rad, California, USA) to calculate the cell viability of each group.
Oil Red O staining
To visualize the lipid droplets in differentiated 3T3-L1 cells, the Oil-Red-O staining assay (Sigma-Aldrich, Missouri, USA) was performed. Briefly, the cells were fixed with 10% formalin at room temperature for 1 hour, followed by being washed and incubated with an Oil-Red-O working solution for another 1 hour. Subsequently, the cells were washed 3 times with deionized water and the stained lipid droplets were captured. Finally, the calculation of the droplet area was conducted with Gen 5 (Bio Tek, Vermont, USA).
Measurement of released glycerol
The amount of released glycerol was measured to evaluate lipolysis. In brief, the supernatant of the cells was centrifugated to remove the debris, followed by measuring the concentration of glycerol using a glycerol quantification kit (Biovision, USA) according to the instructions of the manufacturer. Finally, the absorbance at 550 nm was detected with an autoanalyzer (Roche, Basel, Switzerland) to determine the released glycerol.
The quantification of triglyceride
The cells were washed with PBS followed by centrifugation and resuspended and homogenized in 0.5 mL of 5% NP-40 solution. Subsequently, the samples were heated to 80-100° C for 10 minutes and then cooled down to room temperature. The cells were then centrifugated at a high speed in a microcentrifuge for 2 minutes to remove the insoluble materials. Lastly, the concentration of triglyceride in the samples was detected using a commercial kit (Abcam, Cambridge, UK) according to the instructions of the manufacturer. The microplate reader (Bio-Rad, California, USA) was used to detect the OD values at 570 nm and the concentration of triglyceride was calculated based on the standard curve.
RT-PCR assay
cDNA synthesis was conducted following isolating total RNAs from the treated cells using the GoScript Reverse Transcription System (Promega, Wisconsin, USA) according to the instruction of the manufacturer. The CFX96 Touch Deep Well Real-Time PCR Detection System (BIO-RAD, California, USA) was used to quantify the relative expression level of the target genes with GAPDH as an endogenous control using the 2-ΔΔCt method. The following primers were used: 5′-tgggaacctggaagcttgtctc-3′ and 5′-gaattccacgcccagtttga-3′ for FABP4; 5′-agaccactcgcattcccttt--3′ and 5′-ccacagactcggcactcaat-3′ for PPARγ; 5′-agcaacgagtaccgggtacg-3′ and 5′-tgtttggctttatctcggctc-3′ for C/EBPα; 5′-ccgagatgtgcgaactgga-3′ and 5′-gaagtcactgtc ttggttgttgatg-3′ for SREBP1C; 5′-agggaggaaaatgtgctgga-3′ and 5′-ggtgaagcccaggaatgaag-3′ for Leptin; 5’-ggagtccactggcgtctt-3’ and 5’-aggctgttgtcatacttctcat-3’ for GAPDH.
Western blot assay
Cell lysis was extracted from the treated cells utilizing the lysis buffer (Thermo Fisher Scientific, Massachusetts, USA), followed by isolating the total proteins. The proteins were then quantified with the BCA commercial kit (Beyotime Biotechnology, Shanghai, China) and separated using the SDS-PAGE after being loaded. Subsequently, the proteins were transferred to the PVDF membrane, followed by being incubated with primary antibodies against AMPKα (1:2000, Cat#5832, CST, USA), p-AMPKα (1:2000, Cat#5759, CST, USA), and β-actin (1:5000, Cat#sc-47778, SCBT, USA), at 4° C overnight. Lastly, the membrane was incubated with a secondary antibody at room temperature for 1.5 hours and exposed to ECL solution (Beyotime Biotechnology, Shanghai, China). Image J was used to semi-quantify the relative expression level of target proteins.
Hematoxylin-eosin (HE) staining
The pathological state of adipose tissues was evaluated with HE staining. The adipose tissues were fixed in 4% paraformaldehyde and embedded in paraffin, followed by being cut into 5 μm sections. Subsequently, the sections were dewaxed in xylene and washed with a 100% to 50% ethanol gradient, followed by being stained with hematoxylin (MXB Biotechnologies, Shanghai, China) for 1 minute. Following being differentiated in hydrochloric acid-ethanol for several seconds, the adipose tissues were stained with eosin (MXB Biotechnologies, Shanghai, China) for 5 minutes. Finally, the sections were observed using a biological inverted microscope (Olympus, Tokyo, Japan).
Statistical analyses
All experiments were repeated at least 3 times. The data are presented as mean ± Standard Deviation (SD), and these data are statistically analyzed by Analysis of Variance (ANOVA) using GraphPad Prism 5.0 software. Statistically significant differences were accepted at P<0.05.
Author Contributions
Xin Lv, Jun Qiu, Haiping Jiang, and Yang Tan made contributions to the conceptions of the study; Xin Lv, Jun Qiu, Tao Hao, and Haoran Zhang performed experiments and collected data; Haiping Jiang and Yang Tan analyzed the data and drafted the manuscript.
Conflicts of Interest
The authors declare that they have no conflicts of interest.
Funding
This work was supported by a Project funded by the China Postdoctoral Science Foundation (Grant number 2020M673083) and the Opening Research Fund of Guangzhou Key Laboratory of Molecular and Functional Imaging for Clinical Translation (Grant number 201905010003).
References
- 1. Steinberger J, Daniels SR, and American Heart Association Atherosclerosis, Hypertension, and Obesity in the Young Committee (Council on Cardiovascular Disease in the Young), and American Heart Association Diabetes Committee (Council on Nutrition, Physical Activity, and Metabolism). Obesity, insulin resistance, diabetes, and cardiovascular risk in children: an American Heart Association scientific statement from the Atherosclerosis, Hypertension, and Obesity in the Young Committee (Council on Cardiovascular Disease in the Young) and the Diabetes Committee (Council on Nutrition, Physical Activity, and Metabolism). Circulation. 2003; 107:1448–53. https://doi.org/10.1161/01.cir.0000060923.07573.f2 [PubMed]
- 2. Wing RR, Jeffery RW. Effect of modest weight loss on changes in cardiovascular risk factors: are there differences between men and women or between weight loss and maintenance? Int J Obes Relat Metab Disord. 1995; 19:67–73. [PubMed]
- 3. Siersbaek R, Nielsen R, Mandrup S. PPARgamma in adipocyte differentiation and metabolism--novel insights from genome-wide studies. FEBS Lett. 2010; 584:3242–49. https://doi.org/10.1016/j.febslet.2010.06.010 [PubMed]
- 4. Rosen ED, Spiegelman BM. Adipocytes as regulators of energy balance and glucose homeostasis. Nature. 2006; 444:847–53. https://doi.org/10.1038/nature05483 [PubMed]
- 5. Caro JF, Dohm LG, Pories WJ, Sinha MK. Cellular alterations in liver, skeletal muscle, and adipose tissue responsible for insulin resistance in obesity and type II diabetes. Diabetes Metab Rev. 1989; 5:665–89. https://doi.org/10.1002/dmr.5610050804 [PubMed]
- 6. Huang B, Yuan HD, Kim DY, Quan HY, Chung SH. Cinnamaldehyde prevents adipocyte differentiation and adipogenesis via regulation of peroxisome proliferator-activated receptor-γ (PPARγ) and AMP-activated protein kinase (AMPK) pathways. J Agric Food Chem. 2011; 59:3666–73. https://doi.org/10.1021/jf104814t [PubMed]
- 7. Zuo Y, Qiang L, Farmer SR. Activation of CCAAT/enhancer-binding protein (C/EBP) alpha expression by C/EBP beta during adipogenesis requires a peroxisome proliferator-activated receptor-gamma-associated repression of HDAC1 at the C/ebp alpha gene promoter. J Biol Chem. 2006; 281:7960–67. https://doi.org/10.1074/jbc.M510682200 [PubMed]
- 8. Tang FY, Shih CJ, Cheng LH, Ho HJ, Chen HJ. Lycopene inhibits growth of human colon cancer cells via suppression of the Akt signaling pathway. Mol Nutr Food Res. 2008; 52:646–54. https://doi.org/10.1002/mnfr.200700272 [PubMed]
- 9. Rosen ED, MacDougald OA. Adipocyte differentiation from the inside out. Nat Rev Mol Cell Biol. 2006; 7:885–96. https://doi.org/10.1038/nrm2066 [PubMed]
- 10. Imai T, Takakuwa R, Marchand S, Dentz E, Bornert JM, Messaddeq N, Wendling O, Mark M, Desvergne B, Wahli W, Chambon P, Metzger D. Peroxisome proliferator-activated receptor gamma is required in mature white and brown adipocytes for their survival in the mouse. Proc Natl Acad Sci USA. 2004; 101:4543–47. https://doi.org/10.1073/pnas.0400356101 [PubMed]
- 11. Nakamura MT, Yudell BE, Loor JJ. Regulation of energy metabolism by long-chain fatty acids. Prog Lipid Res. 2014; 53:124–44. https://doi.org/10.1016/j.plipres.2013.12.001 [PubMed]
- 12. Tanaka T, Yoshida N, Kishimoto T, Akira S. Defective adipocyte differentiation in mice lacking the C/EBPbeta and/or C/EBPdelta gene. EMBO J. 1997; 16:7432–43. https://doi.org/10.1093/emboj/16.24.7432 [PubMed]
- 13. Hsu FS, Wu JT, Lin JY, Yang SP, Kuo KL, Lin WC, Shi CS, Chow PM, Liao SM, Pan CI, Hong JY, Chang HC, Huang KH. Histone Deacetylase Inhibitor, Trichostatin A, Synergistically Enhances Paclitaxel-Induced Cytotoxicity in Urothelial Carcinoma Cells by Suppressing the ERK Pathway. Int J Mol Sci. 2019; 20:1162. https://doi.org/10.3390/ijms20051162 [PubMed]
- 14. Cui SN, Chen ZY, Yang XB, Chen L, Yang YY, Pan SW, Wang YX, Xu JQ, Zhou T, Xiao HR, Qin L, Yuan SY, Shang Y. Trichostatin A modulates the macrophage phenotype by enhancing autophagy to reduce inflammation during polymicrobial sepsis. Int Immunopharmacol. 2019; 77:105973. https://doi.org/10.1016/j.intimp.2019.105973 [PubMed]
- 15. Vigushin DM, Ali S, Pace PE, Mirsaidi N, Ito K, Adcock I, Coombes RC. Trichostatin A is a histone deacetylase inhibitor with potent antitumor activity against breast cancer in vivo. Clin Cancer Res. 2001; 7:971–76. [PubMed]
- 16. Agudelo M, Gandhi N, Saiyed Z, Pichili V, Thangavel S, Khatavkar P, Yndart-Arias A, Nair M. Effects of alcohol on histone deacetylase 2 (HDAC2) and the neuroprotective role of trichostatin A (TSA). Alcohol Clin Exp Res. 2011; 35:1550–56. https://doi.org/10.1111/j.1530-0277.2011.01492.x [PubMed]
- 17. Wu Y, Guo SW. Peroxisome proliferator-activated receptor-gamma and retinoid X receptor agonists synergistically suppress proliferation of immortalized endometrial stromal cells. Fertil Steril. 2009; 91:2142–47. https://doi.org/10.1016/j.fertnstert.2008.04.012 [PubMed]
- 18. Ding D, Chen LL, Zhai YZ, Hou CJ, Tao LL, Lu SH, Wu J, Liu XP. Trichostatin A inhibits the activation of Hepatic stellate cells by Increasing C/EBP-α Acetylation in vivo and in vitro. Sci Rep. 2018; 8:4395. https://doi.org/10.1038/s41598-018-22662-6 [PubMed]
- 19. Ginsberg-Fellner F, Knittle JL. Weight reduction in young obese children. I. Effects on adipose tissue cellularity and metabolism. Pediatr Res. 1981; 15:1381–89. https://doi.org/10.1203/00006450-198110000-00016 [PubMed]
- 20. Zebisch K, Voigt V, Wabitsch M, Brandsch M. Protocol for effective differentiation of 3T3-L1 cells to adipocytes. Anal Biochem. 2012; 425:88–90. https://doi.org/10.1016/j.ab.2012.03.005 [PubMed]
- 21. Lefterova MI, Lazar MA. New developments in adipogenesis. Trends Endocrinol Metab. 2009; 20:107–14. https://doi.org/10.1016/j.tem.2008.11.005 [PubMed]
- 22. Siersbæk R, Nielsen R, John S, Sung MH, Baek S, Loft A, Hager GL, Mandrup S. Extensive chromatin remodelling and establishment of transcription factor ‘hotspots’ during early adipogenesis. EMBO J. 2011; 30:1459–72. https://doi.org/10.1038/emboj.2011.65 [PubMed]
- 23. Mikkelsen TS, Xu Z, Zhang X, Wang L, Gimble JM, Lander ES, Rosen ED. Comparative epigenomic analysis of murine and human adipogenesis. Cell. 2010; 143:156–69. https://doi.org/10.1016/j.cell.2010.09.006 [PubMed]
- 24. Chatterjee TK, Idelman G, Blanco V, Blomkalns AL, Piegore MG
Jr , Weintraub DS, Kumar S, Rajsheker S, Manka D, Rudich SM, Tang Y, Hui DY, Bassel-Duby R, et al. Histone deacetylase 9 is a negative regulator of adipogenic differentiation. J Biol Chem. 2011; 286:27836–47. https://doi.org/10.1074/jbc.M111.262964 [PubMed] - 25. Chiu CY, Chan IL, Yang TH, Liu SH, Chiang MT. Supplementation of chitosan alleviates high-fat diet-enhanced lipogenesis in rats via adenosine monophosphate (AMP)-activated protein kinase activation and inhibition of lipogenesis-associated genes. J Agric Food Chem. 2015; 63:2979–88. https://doi.org/10.1021/acs.jafc.5b00198 [PubMed]
- 26. Hardie DG. Regulation of fatty acid and cholesterol metabolism by the AMP-activated protein kinase. Biochim Biophys Acta. 1992; 1123:231–38. https://doi.org/10.1016/0005-2760(92)90001-c [PubMed]
- 27. Rosen ED, Spiegelman BM. PPARgamma : a nuclear regulator of metabolism, differentiation, and cell growth. J Biol Chem. 2001; 276:37731–34. https://doi.org/10.1074/jbc.R100034200 [PubMed]
- 28. Chen S, Li Z, Li W, Shan Z, Zhu W. Resveratrol inhibits cell differentiation in 3T3-L1 adipocytes via activation of AMPK. Can J Physiol Pharmacol. 2011; 89:793–99. https://doi.org/10.1139/y11-077 [PubMed]