


Introduction
Breast cancer, which originates in the epithelial tissue of the breast [1], is one of the most common malignant tumors in women, accounting for 30% of the cancers diagnosed in women. Continuous improvements in radical mastectomy and the application of various targeted drugs have markedly improved the survival rate and quality of life of patients with breast cancer, but tumor recurrence and metastasis are still the main prognostic factors [2]. Bone metastasis is the most common site of distant metastasis. Bone metastasis occurs in 65 to 75% of patients with metastatic and recurrent advanced breast cancer, and it is found in 27 to 50% of patients at initial diagnosis [3]. Bone metastasis often occurs in the thoracolumbar vertebrae, sacrum, and ribs [4]. Breast cancer patients with bone metastasis often experience bone-related events, such as pain in bones, pathological fractures, vertebral compression or deformation, spinal cord compression, and hypercalcemia, which seriously affect their quality of life [5].
Metastasis is the main cause of death in approximately 30% of patients with breast cancer, with a higher incidence of bone metastasis. Although breast cancer is peculiarly prone to bone metastasis, our understanding of the molecular mechanism of bone metastasis in breast cancer is still limited. Induced tumor-suppressing mesenchymal stem cells protect bones from metastasis in breast tumors [6] and the bone microenvironment and soluble factors participate in breast cancer bone metastasis. In this complex signaling network, interleukin is a key regulator, affecting the differentiation and function of osteocytes, as both cancer cells and osteocytes secrete interleukin and express the corresponding receptors [7]. MicroRNAs and long non-coding RNAs (lncRNAs), as non-coding RNAs that regulate the expression of target genes, also participate in bone metastasis [8]. It has been reported that miR-214 promotes osteolytic bone metastasis of breast cancer by targeting TRAF3. By detecting the expression profile of miRNAs produced by osteoclasts in human bone specimens, it was discovered that miR-214-3p is significantly upregulated in breast cancer patients with osteolytic bone metastasis. Moreover, miR-214-3p directly targets Traf3 mRNA to promote osteoclast activity and bone resorption activity [9]. In addition, the ROR1-HER3-lncRNA axis regulates the Hippo-YAP pathway to promote bone metastasis in breast cancer. NRG1 triggers HER3 phosphorylation, and then recruits the lncRNA MAYA and methylates MST1, activating YAP and its target genes, which eventually leads to the induction of osteoclast differentiation and bone resorption by cancer cells [10]. The lncRNA transcription factor homeobox B13 (HOXB13) has been identified as an upstream regulator of bone metastasis-related signals in prostate cancer. HOXB13 promotes the bone metastasis of metastatic prostate cancer by regulating the production of CCL2/CCR2 cytokines and integrin signals in an autocrine and paracrine manner [11].
This study aimed to identify genes and lncRNAs that are related to bone metastasis in breast cancer to determine the molecular mechanism underlying bone metastases in breast cancer. The key genes and lncRNAs identified herein provide a theoretical foundation for the intrinsic molecular mechanism of breast cancer bone metastasis.
Results
Screening of differentially expressed genes
The differentially expressed genes and lncRNAs in 12 breast cancer bone metastasis samples and 12 normal samples were identified using the R limma package for differential expression. We used the breast cancer bone metastasis expression profile in the GSE66206 dataset. A total of 133 differentially expressed genes and 23 differentially expressed lncRNAs (fold change >1.2 or fold change <-6/5) were identified. Among them, 27 genes and 3 lncRNAs were significantly differentially expressed (p < 0.05) (Table 1).
Table 1. The Gene ontology annotation of the differentially expressed genes between the breast cancer bone metastasis samples and normal samples (GSE66206 from GEO).
| Gene symbol | Gene ID | Biological Process (GO) |
| CSPP1 | 79848 | GO:0051781 positive regulation of cell division |
| COQ10B | 80219 | GO:0006743 ubiquinone metabolic process |
| FLVCR1 | 28982 | GO:0043249 erythrocyte maturation |
| IDI1 | 3422 | GO:0050993 dimethylallyl diphosphate metabolic process |
| PTP4A1 | 7803 | GO:0030335 positive regulation of cell migration |
| ODC1 | 4953 | GO:0009445 putrescine metabolic process |
| JMJD1C | 221037 | GO:0033169 histone H3-K9 demethylation |
| BZW1 | 9689 | GO:0045296 cadherin binding |
| IRF1 | 3659 | GO:0034124 regulation of MyD88-dependent toll-like receptor signaling pathway |
| KDM6B | 23135 | GO:0071557 histone H3-K27 demethylation |
| IFRD1 | 3475 | GO:0048671 negative regulation of collateral sprouting |
| RBM25 | 58517 | GO:0000381 regulation of alternative mRNA splicing, via spliceosome |
| NCOA4 | 8031 | GO:0006879 cellular iron ion homeostasis |
| SERPINA1 | 5265 | GO:0048199 vesicle targeting, to, from or within Golgi |
| HSPB1 | 3315 | GO:0038033 positive regulation of endothelial cell chemotaxis by VEGF-activated vascular endothelial growth factor receptor signaling pathway |
| BNIP3 | 664 | GO:1902109 negative regulation of mitochondrial membrane permeability involved in apoptotic process |
| LARP4 | 113251 | GO:0034250 positive regulation of cellular amide metabolic process |
| UXT | 8409 | GO:0047497 mitochondrion transport along microtubule |
| ZBTB10 | 65986 | GO:0046872 metal ion binding |
| LAMTOR1 | 55004 | GO:0060620 regulation of cholesterol import |
| MRPL51 | 51258 | GO:0070126 mitochondrial translational termination |
| ELF2 | 1998 | GO:0050855 regulation of B cell receptor signaling pathway |
| TPD52 | 7163 | GO:0030183 B cell differentiation |
| PAQR5 | 54852 | GO:0048477 oogenesis |
| CYB5D1 | 124637 | GO:0046872 metal ion binding |
| GABRB2 | 2561 | GO:0004890 GABA-A receptor activity |
| ABHD2 | 11057 | GO:0042562 hormone binding |
Constructing an interaction network related to bone metastasis in breast cancer
We calculated Spearman correlation coefficients for the co-expression of PCGs and lncRNAs, which we corrected using the rank-sum test. We identified 747,870 PCG-lncRNA, PCG-PCG, and lncRNA-lncRNA interactions, 7,451 of which were differentially expressed PCG-lncRNA interactions (| r | ≥ 0.3, p < 0.05). We then visualized the network (Figure 1A) and analyzed the node degrees. Cytoscape analysis revealed that the degree of the network nodes ranged from 1 to 905. To identify the hub nodes in the network, we set the threshold to 20 and extracted all possible core driver genes. A total of 30 different core driver genes were identified (Figure 1B). We also identified regulatory interactions between 27 differentially expressed genes and 3 lncRNAs (RP11-317J19.1, CTD-2410N18.4, IDI2-AS1) (Figure 1C). We consulted the Human Protein Atlas Interactive Analysis to validate the expression of the core driver genes, including IDI1, BNIP3, IFRD1, COQ10B, and ZBTB10 (Figure 2), at the protein and RNA levels in breast cancer. Immunohistochemistry and RNA expression analysis indicated that IDI1, BNIP3, IFRD1, and ZBTB10 were significantly differentially expressed in cancer and healthy tissues.
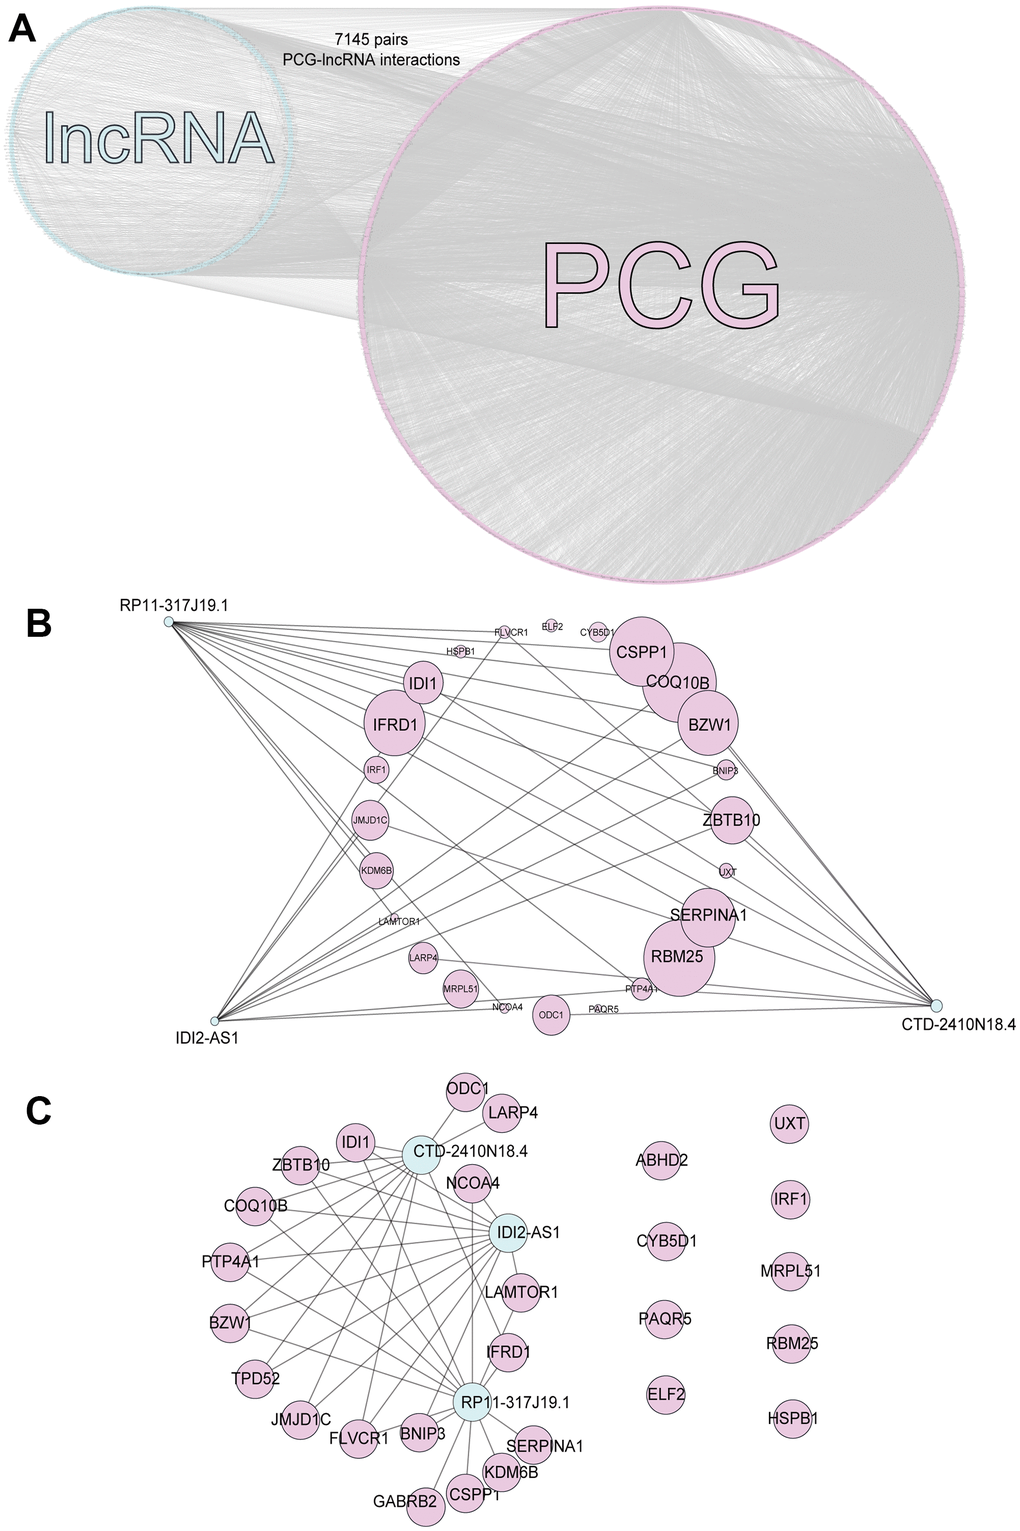
Figure 1. PCG-lncRNA interactions. (A) Network of differentially expressed PCG-lncRNA interactions. (B) Core driver gene network. (C) Interactions between differentially expressed genes and lncRNAs.
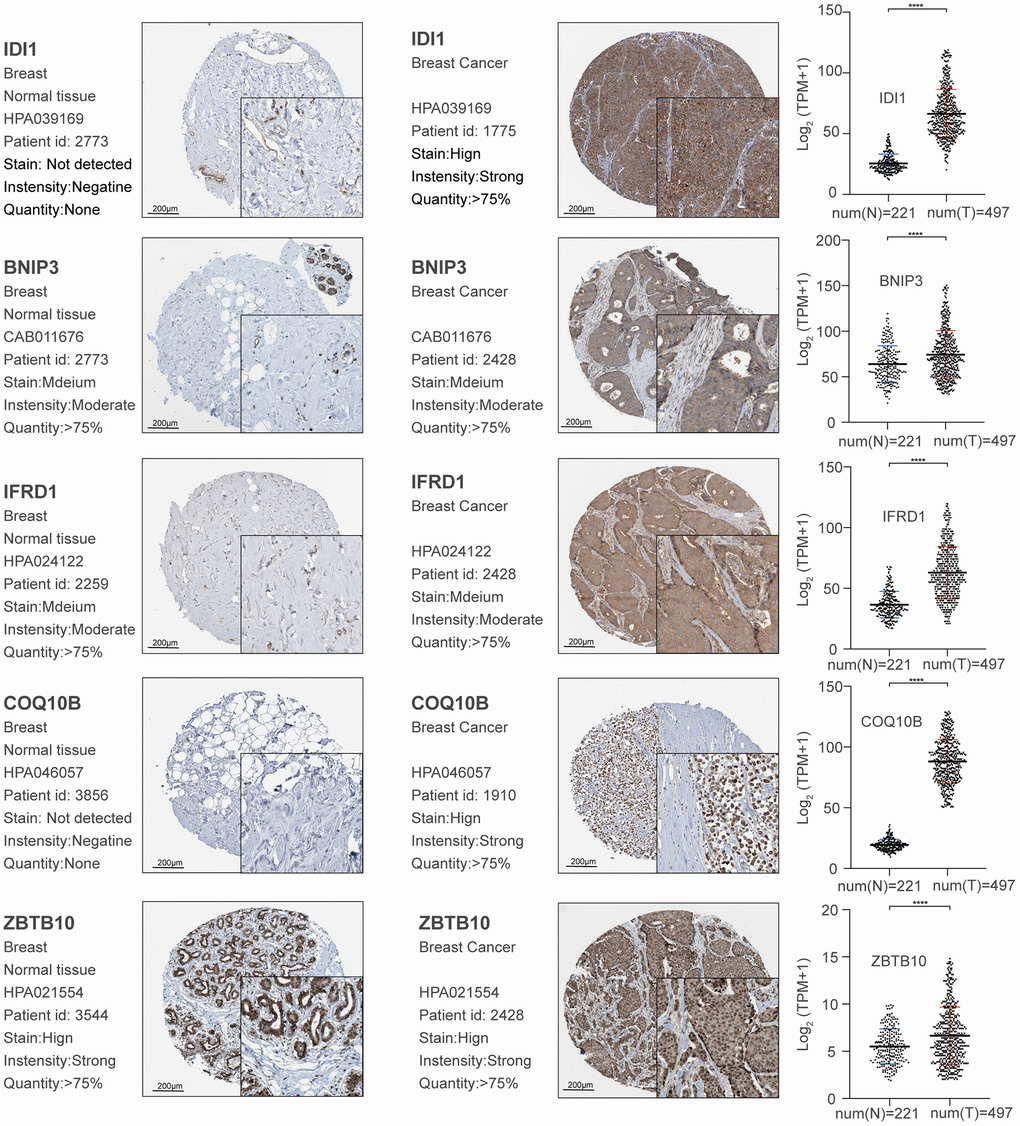
Figure 2. Validation of significant core genes in breast cancer bone metastasis via immunohistochemistry and RNA expression analysis.
WGCNA of co-expressed genes
Gene expression profiles for 1,533 PCG and lncRNAs related to breast cancer bone metastasis were constructed using the WGCNA R package to build a co-expression network (merge cut height = 0.25, verbose = 3). The optimal threshold for the WGCNA was 12 (Figure 3A). The sample clustering chart is shown in Figure 3B. We excavated five modules from the breast cancer bone metastasis gene expression profile, including blue (112 genes), turquoise (1,274 genes), brown (37 genes), yellow (20 genes), and gray (90 genes) modules (Figure 3C). The results of the co-expression analysis are shown in Figure 3D. Relationships between the various modules and traits related to bone metastasis in breast cancer are shown in Figure 3E. The genes in the yellow module are related to the disease characteristics of breast cancer bone metastases and breast cancer. In addition, the occurrence of bone metastases positively correlated with the expression of the genes in the yellow module.
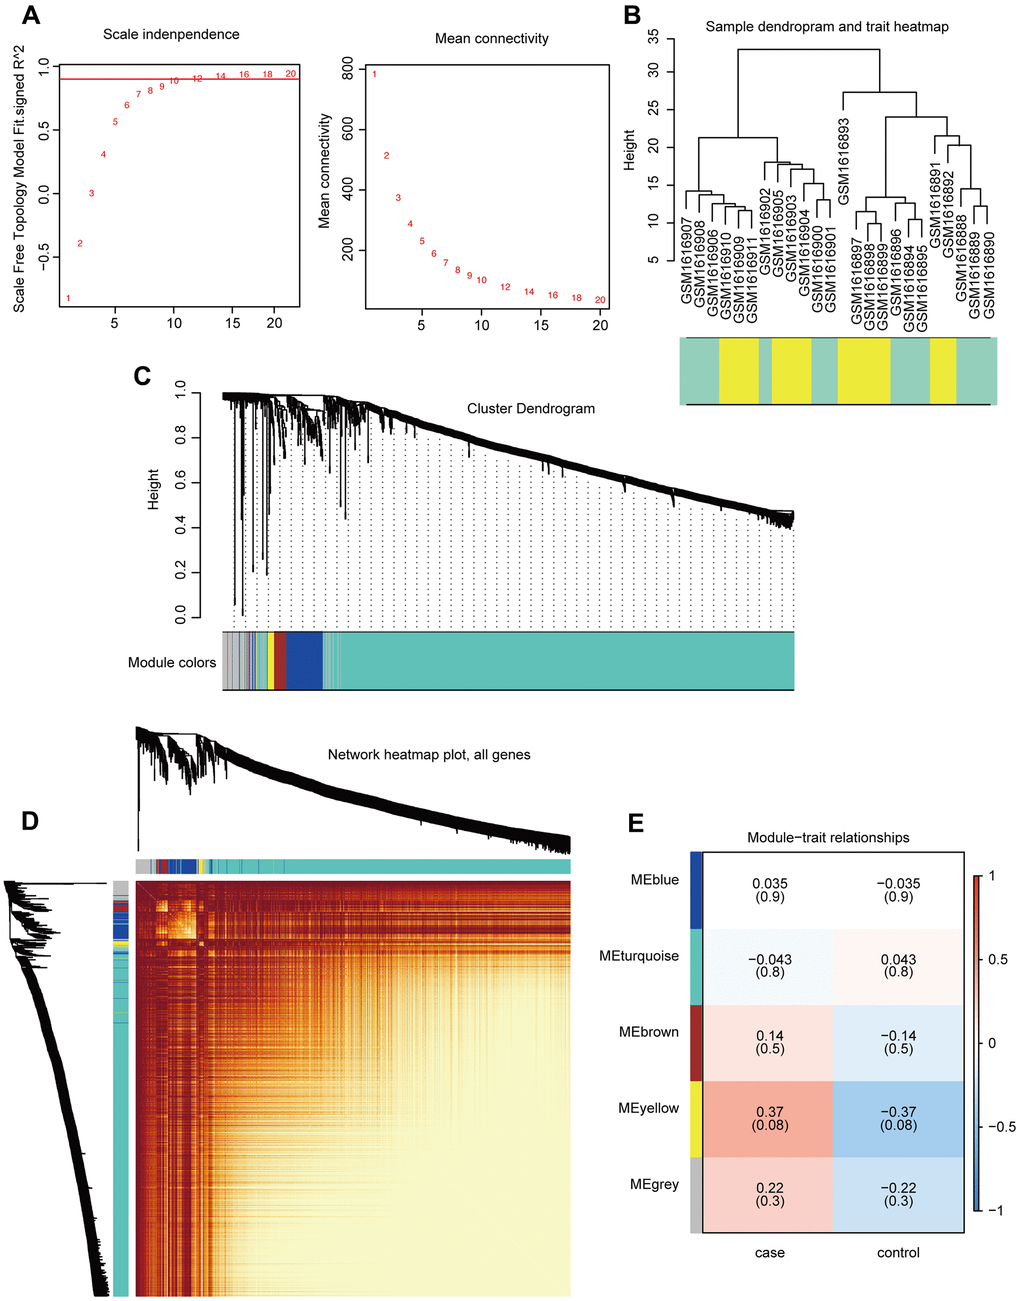
Figure 3. Construction and analysis of co-expression modules. (A) Optimal threshold selection map for breast cancer bone metastasis co-expression. (B) Clustering of breast cancer bone metastasis samples. (C) Phylogenetic tree of module clustering. (D) Co-expression analysis heat map. (E) Breast cancer bone metastasis modules and traits.
Functional enrichment analysis and verification
The yellow module comprised 14 genes (Table 2). We used KOBAS to perform functional enrichment analysis using GO and KEGG for the genes in the yellow module [12]. With a significance threshold of p < 0.05, we identified seven significant KEGG functional pathways, which revealed that the core genes in the yellow module were enriched in the prolactin signaling pathway [13] (Figure 4A). GO enrichment analysis revealed 300 related GO functions (p < 0.05) involving a large number of pathways that might be related to cancer development, including the regulation of signal transduction (GO: 0009966, p = 0.00017), cellular processes (GO: 0009987, p = 0.00024), cellular communication regulation (GO: 0010646, p = 0.00030), and positive regulation of biological processes (GO: 0048518, p = 0.000826) (Figure 4B).
Table 2. The GO annotations of the genes in the yellow module.
| Gene symbol | Gene ID | Biological process (GO) |
| IDI1 | 3422 | GO:0050993 dimethylallyl diphosphate metabolic process |
| PTP4A1 | 7803 | GO:0030335 positive regulation of cell migration |
| BNIP3 | 664 | GO:1902109 negative regulation of mitochondrial membrane permeability involved in apoptotic process |
| NCKAP5 | 344148 | GO:0007019 microtubule depolymerization |
| SOCS2 | 8835 | GO:0060396 growth hormone receptor signaling pathway |
| ADAMTS3 | 9508 | GO:1900748 positive regulation of vascular endothelial growth factor signaling pathway |
| ANXA11 | 311 | GO:0032506 cytokinetic process |
| DYRK1A | 1859 | GO:0043518 negative regulation of DNA damage response, signal transduction by p53 class mediator |
| EPS8L2 | 64787 | GO:1900029 positive regulation of ruffle assembly |
| DISP1 | 84976 | GO:0007225 patched ligand maturation |
| WDFY3 | 23001 | GO:0035973 aggrephagy |
| SLC38A5 | 92745 | GO:1904557 L-alanine transmembrane transport |
| NOVA1 | 4857 | GO:0120163 negative regulation of cold-induced thermogenesis |
| SLC38A3 | 10991 | GO:2000487 positive regulation of glutamine transport |
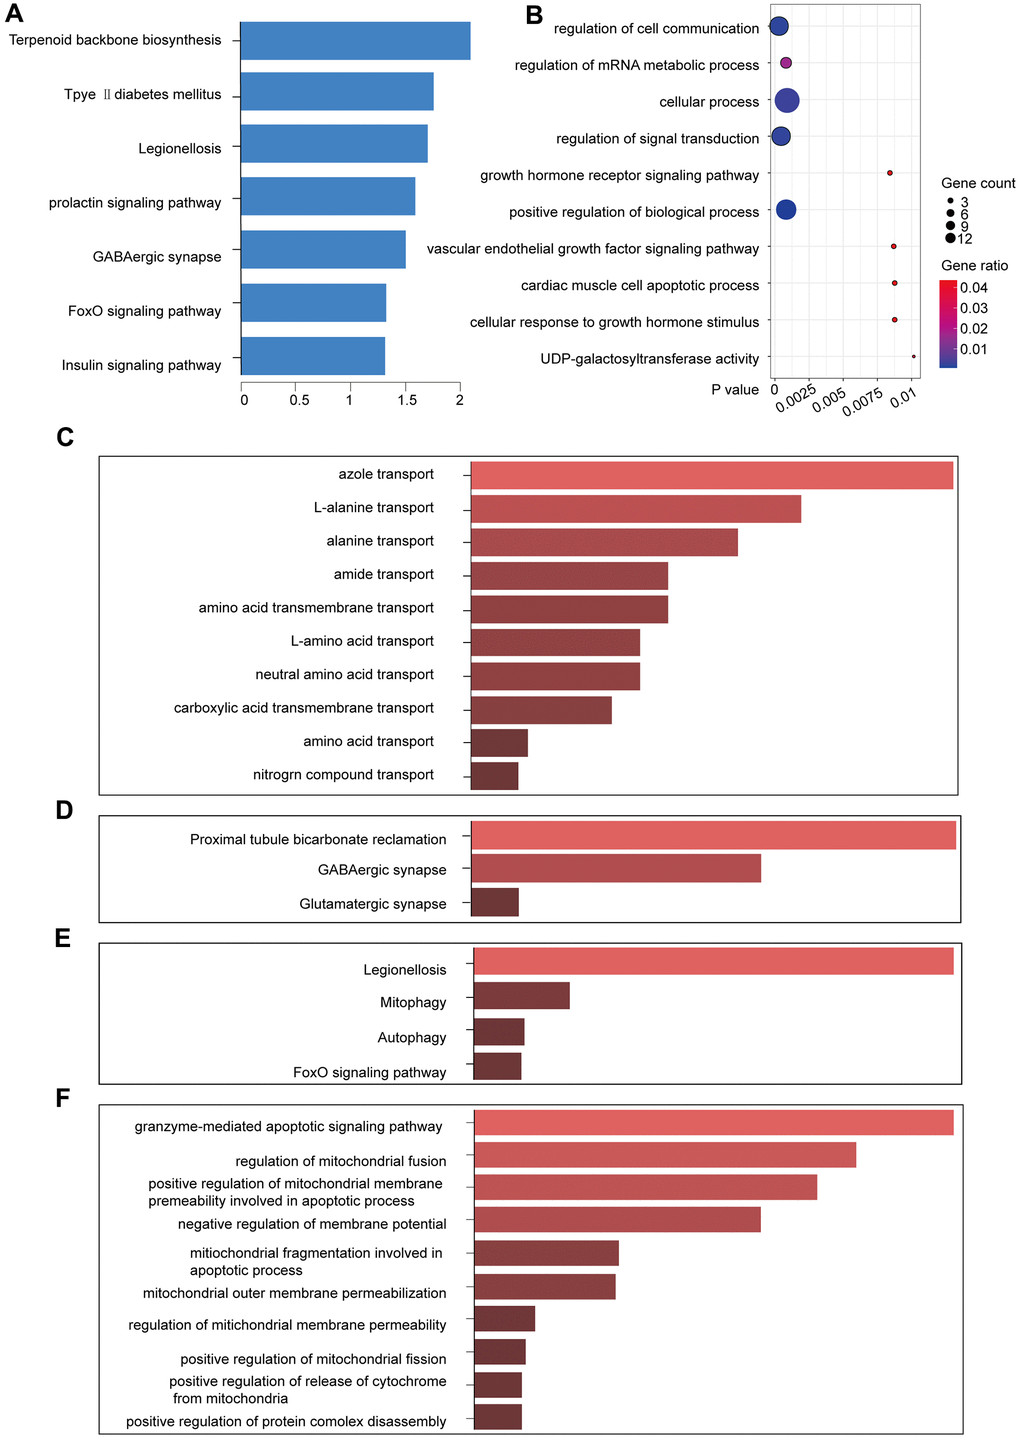
Figure 4. KEGG and GO function enrichment analyses. (A) KEGG pathway enrichment in the yellow module. (B) GO pathway enrichment in the yellow module. (C) GO enrichment of lncRNAs in the yellow module. (D) KEGG enrichment of the functions of the lncRNAs in the yellow module. (E) KEGG pathway enrichment for the interactions of the differentially expressed genes in the yellow module. (F) GO pathway enrichment for the interactions of the differentially expressed genes in the yellow module.
Enrichr was used to enrich the KEGG and GO functions of the five lncRNAs in the yellow module (p < 0.05). Some pathways that were enriched for the lncRNAs were related to amino acid transport (Figure 4C, 4D), including alanine transport (GO: 0015808, p = 0.00249) and amino acid transmembrane transport (GO: 0003333, p = 0.00747). We identified the GABAergic synapse (p = 0.02205) in the lncRNA-enriched KEGG pathway, which is closely related to breast cancer metastasis [14, 15]. Therefore, the yellow module was likely to be a pathogenic module.
We identified that the lncRNA RP11-317-J19.1 and PTP4A1 acted on BNIP3, which plays a key role in cell apoptosis and autophagy (Figure 4E, 4F) [16–19]. The gene-lncRNA interaction diagram revealed a subtle interaction between the five differentially expressed genes and differentially expressed lncRNAs in the yellow module (Figure 5A, 5B). To validate the gene-lncRNA interactions in the yellow module, we created gene correlation scatter plots for IDI2-AS1 and IDI1, IDI2-AS1 and PTP4A, IDI2-AS1 and BNIP3, PTP4A and IDI1, BNIP3 and IDI1, as well as PTP4A and BNIP3 (Figure 5C). The results revealed that the expression levels of BNIP3 and PTP4A were significantly positively correlated with that of IDI1 (p < 0.05), whereas those of BNIP3 and PTP4A were significantly negatively correlated with those of IDI2-AS1 (p < 0.05). Moreover, the Kaplan-–Meier plots showed that seven genes and two lncRNAs in the core driver gene network and co-expression yellow module were correlated with overall survival, including IDI1, PTP4A1, BNIP3, IFRD1, ZBTB10, DISP1, COQ10B, IDI2-AS1, and SLC38A3 (Figure 6A–6I).
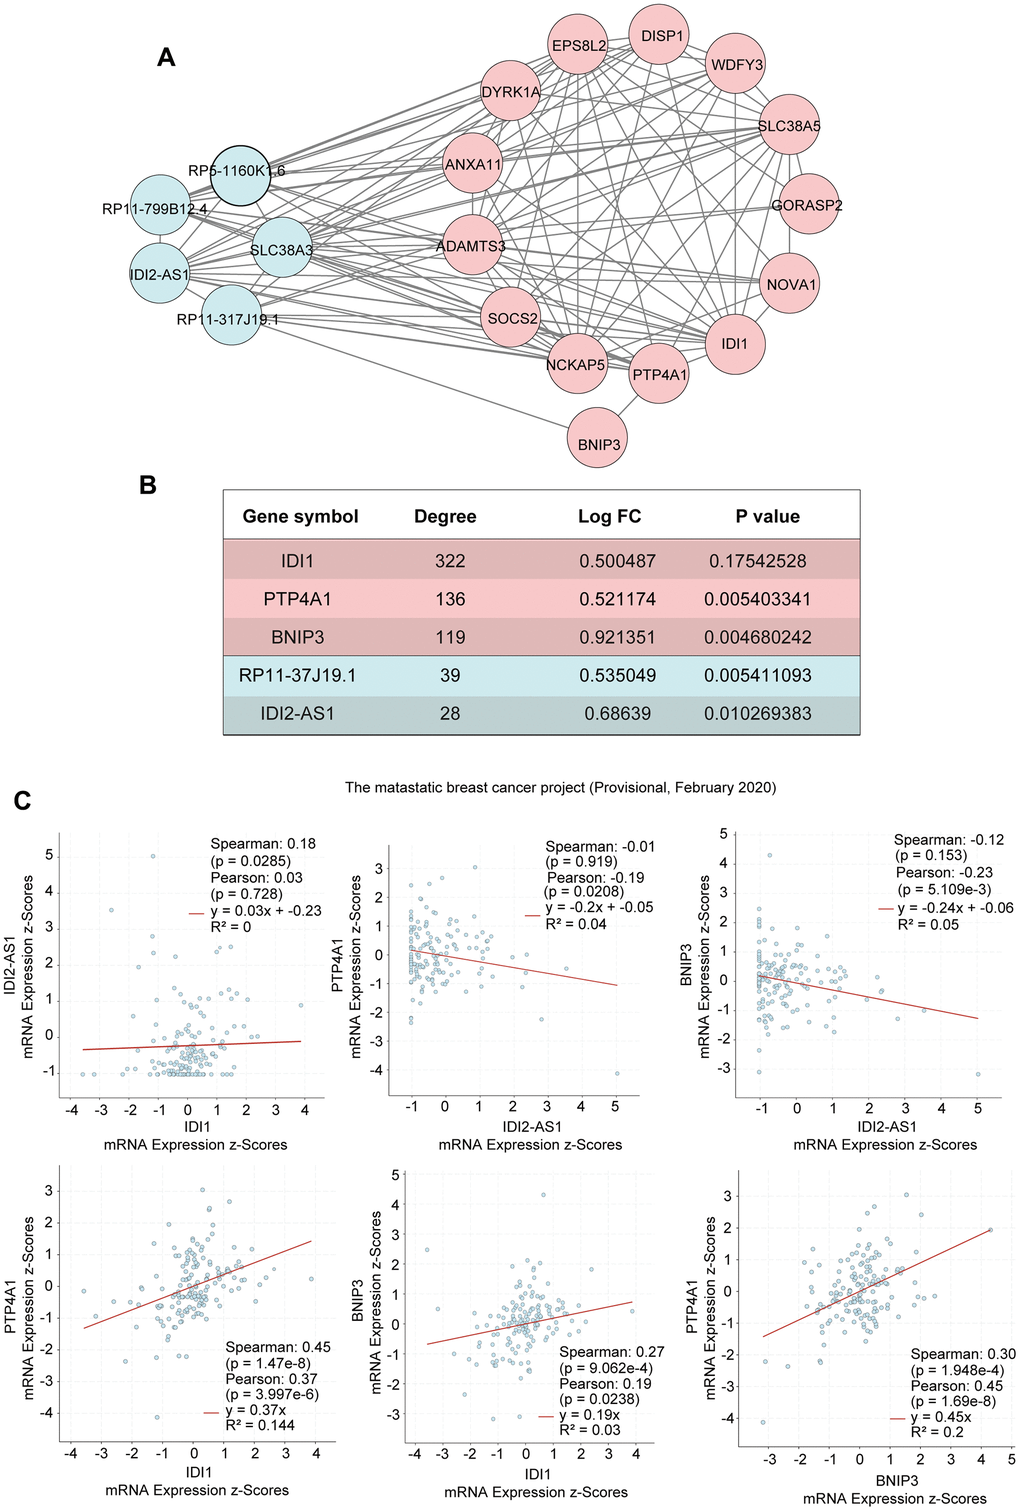
Figure 5. Interactions of the genes in the yellow module. (A) The interactions between five differentially expressed genes and differentially expressed lncRNAs in the yellow module. (B) The five differentially expressed genes in the yellow module. (C) Gene correlation scatter plots of the yellow module. The Pearson correlation coefficients of IDI2-AS1 and IDI1, IDI2-AS1 and PTP4A, IDI2-AS1 and BNIP3, PTP4A and IDI1, BNIP3 and IDI1, and PTP4A and BNIP3.
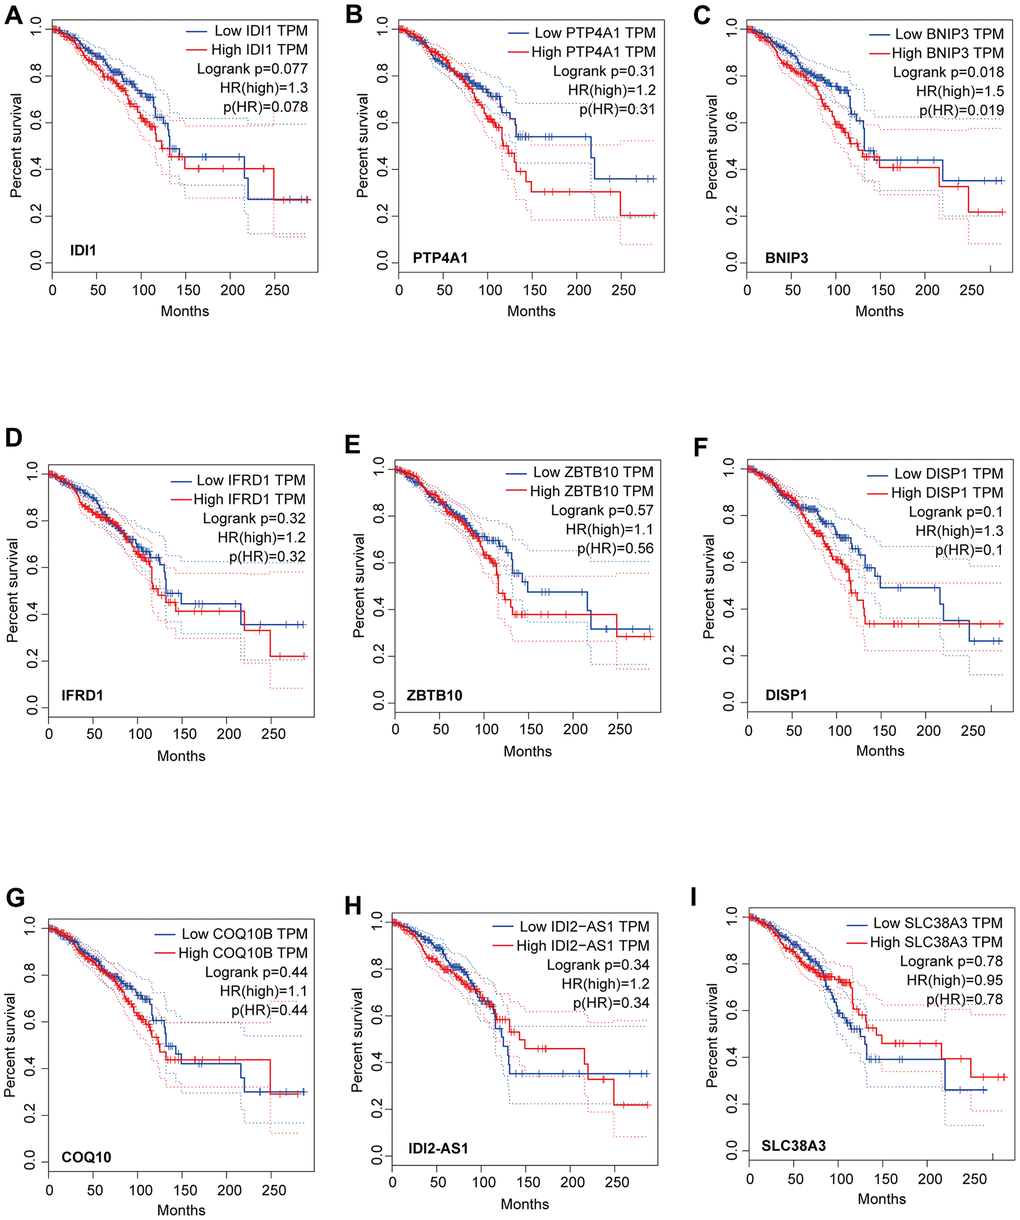
Figure 6. Analysis of overall survival based on the expression of the seven genes and two lncRNAs in the core driver gene network. Survival was measured using Kaplan-Meier analysis based on the expression of IDI1 (A), PTP4A1 (B), BNIP3 (C), IFRD1 (D), ZBTB10 (E), DISP1 (F), COQ10B (G), IDI2-AS1 (H), and SLC38A3 (I). The X-axis displays the survival time (Months), and the y-axis displays the percentage survival.
Discussion
Herein, we identified the genes and lncRNAs that are related to bone metastasis in breast cancer. By comparing the differentially expressed genes identified in our screening with regard to the genes related to breast cancer bone metastasis in the NCBI database, we identified genes with verified links to breast cancer bone metastasis, such as HSPB1 and PRL, in our dataset, thereby validating our approach. HSPB1 expression is associated with a variety of human cancers with poor clinical prognosis. Furthermore, the HSPB1-encoded protein promotes cancer cell proliferation and metastasis, while protecting cancer cells from apoptosis. In addition, prolactin promotes breast cancer bone metastasis [20–22]. The expression of the prolactin receptor modulates the microenvironment to induce osteoclast formation.
Through functional analysis of the lncRNA RP11-317-J19.1, PTP4A1, and BNIP3, we found that the interaction pairs formed by these genes participate in programmed cell death via apoptosis and autophagy [16–19]. The protein encoded by PTP4A1 is a cell-signaling molecule with a regulatory role in various processes, such as cell proliferation and migration; therefore, the dysregulation of this protein may also be involved in metastasis [23–27]. BNIP3 encodes a mitochondrial protein that contains a BH3 domain and functions as a pro-apoptotic factor. BNIP3 silencing may be mediated by the lncRNA RP11-317-J19.1, allowing the protein encoded by PTP4A1 to function normally, which may induce the uncontrolled proliferation and migration of breast cancer cells. PTP4A1 is highly expressed in several cancer types, and the overexpression of PTP4A1, which is associated with aggressive tumor characteristics, may be regulated by the PI3K/AKT pathway [28]. PTP4A1 expression is regulated by microRNAs that control cellular processes in breast cancer, whereas miR-601 targets PTP4A1 to inhibit breast cancer growth and invasion [24]. The function of BNIP3 is similar to that of PTP4A1, which includes the inhibition of cancer aggression. PTP4A1 can be modulated by the lncRNAs HULC and RP4 in response to cellular injury [29, 30]. These findings suggest that RP11-317-J19.1, PTP4A1, and BNIP3 may play crucial roles in restraining cancer aggressiveness; thus, they serve as strong predictors of breast cancer bone metastasis.
In conclusion, we constructed a differentially expressed lncRNA-mRNA network related to bone metastases in breast cancer and identified core driver genes. We found that expression modules related to alanine transport and amino acid transmembrane transport were differentially regulated in the bone metastasis and normal samples. Our results reveal key genes and lncRNAs, including BNIP3 and RP11-317-J19.1, that are related to breast cancer bone metastasis. Our findings lay the foundation for understanding the molecular basis of breast cancer bone metastasis and will be useful for future therapeutic studies.
Materials and Methods
Gene expression data
We downloaded the gene chip expression data from the GSE66206 dataset and probe annotation files from mouse breast cancer bone metastasis data from the Gene Expression Omnibus (GEO) database (n = 12 normal samples and n = 12 breast cancer bone metastasis samples). The probe annotation files include all probe ID files and probe sequence files for the platform.
Preparation of the data for probe re-annotation
We downloaded the V19 version of the human protein-coding gene reference transcript sequence and lncRNA reference genomic sequence data from the GENCODE database. The probe sequences of the Affymetrix chip GPL6246 platform used for analyzing the GSE66206 dataset were downloaded from GEO.
Chip probe re-annotation
First, we used a library comprising the human protein-coding gene (PCG) reference transcript sequence data and lncRNA reference genome sequence data in fasta format from GENCODE to build our database. Then, based on the constructed transcription and lncRNA libraries, we re-annotated the probe sequences of GSE66206 via the blast algorithm in preparation for the construction of mRNA and lncRNA expression profiles. During re-annotation, we ensured that all the remaining probes met the following conditions: 1) The probe sequence fell entirely within the transcript sequence of the PCG or lncRNA and matched exactly; 2) if a probe sequence aligned with the transcripts of multiple PCGs or lncRNAs, it was filtered out; 3) each PCG or lncRNA was supported by at least two probe sequences.
Differential expression analysis
First, we assigned the appropriate gene symbol to each probe based on the re-annotation and calculated the mean expression for all probes corresponding to the same symbol to determine the expression of the genes in breast cancer bone metastasis and normal samples. The gene expression profiles and lncRNA expression profiles were determined using the R package limma to analyze the differentially expressed genes and differentially expressed lncRNAs between the breast cancer bone metastasis and normal samples. The threshold for differential expression was fold change > 1.2 or fold change < 5/6, where p < 0.05. We compared the screened differentially expressed genes with the related genes on the National Center for Biotechnology Information (NCBI) database to obtain verified or potential genes.
Weighted correlation network analysis of co-expressed genes
Co-expression analysis of all genes and lncRNAs associated with breast cancer bone metastasis was performed using the weighted correlation network analysis (WGCNA) R package. We used the WGCNA algorithm to mine the co-expressed gene modules, and then analyzed the associations between these modules and the sample phenotype. The identified breast cancer metastasis-related modules were displayed in the network using Cytoscape.
Author Contributions
All authors contributed to the work presented in this paper. XT and DWF designed the research and supervised the project. HW, TSY, HFY and PW performed statistical analysis of data. WSL and ZQC provided support e visualization and analysis support. XT wrote the manuscript. All authors read and approved the final manuscript.
Conflicts of Interest
The authors declare that they have no conflicts of interest.
Funding
National Natural Science Foundation of China (41931291, 30801156); National Key Research and Development Program of China (2017YFC0113001); Fostering Young Scholars of Peking University Health Science Center (BMU2017PY015); National Natural Science Foundation of China (81902960, 81672726); the Natural Science Foundation of Beijing (7204241).
References
- 1. Kapoor PM, Mavaddat N, Choudhury PP, Wilcox AN, Lindström S, Behrens S, Michailidou K, Dennis J, Bolla MK, Wang Q, Jung A, Abu-Ful Z, Ahearn T, et al. Combined Associations of a Polygenic Risk Score and Classical Risk Factors With Breast Cancer Risk. J Natl Cancer Inst. 2021; 113:329–37. https://doi.org/10.1093/jnci/djaa056 [PubMed]
- 2. Haider MT, Smit DJ, Taipaleenmäki H. The Endosteal Niche in Breast Cancer Bone Metastasis. Front Oncol. 2020; 10:335. https://doi.org/10.3389/fonc.2020.00335 [PubMed]
- 3. Pediconi F, Galati F. Breast cancer screening programs: does one risk fit all? Quant Imaging Med Surg. 2020; 10:886–90. https://doi.org/10.21037/qims.2020.03.14 [PubMed]
- 4. Scimeca M, Trivigno D, Bonfiglio R, Ciuffa S, Urbano N, Schillaci O, Bonanno E. Breast cancer metastasis to bone: From epithelial to mesenchymal transition to breast osteoblast-like cells. Semin Cancer Biol. 2021; 72:155–64. https://doi.org/10.1016/j.semcancer.2020.01.004 [PubMed]
- 5. Wang Z, Cheng Y, Chen S, Shao H, Chen X, Wang Z, Wang Y, Zhou H, Chen T, Lin N, Ye Z. Novel prognostic nomograms for female patients with breast cancer and bone metastasis at presentation. Ann Transl Med. 2020; 8:197. https://doi.org/10.21037/atm.2020.01.37 [PubMed]
- 6. Sun X, Li K, Zha R, Liu S, Fan Y, Wu D, Hase M, Aryal UK, Lin CC, Li BY, Yokota H. Preventing tumor progression to the bone by induced tumor-suppressing MSCs. Theranostics. 2021; 11:5143–59. https://doi.org/10.7150/thno.58779 [PubMed]
- 7. Haider MT, Ridlmaier N, Smit DJ, Taipaleenmäki H. Interleukins as Mediators of the Tumor Cell-Bone Cell Crosstalk during the Initiation of Breast Cancer Bone Metastasis. Int J Mol Sci. 2021; 22:2898. https://doi.org/10.3390/ijms22062898 [PubMed]
- 8. Puppo M, Valluru MK, Clézardin P. MicroRNAs and Their Roles in Breast Cancer Bone Metastasis. Curr Osteoporos Rep. 2021. [Epub ahead of print]. https://doi.org/10.1007/s11914-021-00677-9 [PubMed]
- 9. Liu J, Li D, Dang L, Liang C, Guo B, Lu C, He X, Cheung HY, He B, Liu B, Li F, Lu J, Wang L, et al. Osteoclastic miR-214 targets TRAF3 to contribute to osteolytic bone metastasis of breast cancer. Sci Rep. 2017; 7:40487. https://doi.org/10.1038/srep40487 [PubMed]
- 10. Li C, Wang S, Xing Z, Lin A, Liang K, Song J, Hu Q, Yao J, Chen Z, Park PK, Hawke DH, Zhou J, Zhou Y, et al. A ROR1-HER3-lncRNA signalling axis modulates the Hippo-YAP pathway to regulate bone metastasis. Nat Cell Biol. 2017; 19:106–19. https://doi.org/10.1038/ncb3464 [PubMed]
- 11. Misawa A, Kondo Y, Takei H, Takizawa T. Long Noncoding RNA HOXA11-AS and Transcription Factor HOXB13 Modulate the Expression of Bone Metastasis-Related Genes in Prostate Cancer. Genes (Basel). 2021; 12:182. https://doi.org/10.3390/genes12020182 [PubMed]
- 12. Chen J, Liu C, Cen J, Liang T, Xue J, Zeng H, Zhang Z, Xu G, Yu C, Lu Z, Wang Z, Jiang J, Zhan X, Zeng J. KEGG-expressed genes and pathways in triple negative breast cancer: Protocol for a systematic review and data mining. Medicine (Baltimore). 2020; 99:e19986. https://doi.org/10.1097/MD.0000000000019986 [PubMed]
- 13. Motamedi B, Rafiee-Pour HA, Khosravi MR, Kefayat A, Baradaran A, Amjadi E, Goli P. Prolactin receptor expression as a novel prognostic biomarker for triple negative breast cancer patients. Ann Diagn Pathol. 2020; 46:151507. https://doi.org/10.1016/j.anndiagpath.2020.151507 [PubMed]
- 14. Chen X, Pei Z, Peng H, Zheng Z. Exploring the molecular mechanism associated with breast cancer bone metastasis using bioinformatic analysis and microarray genetic interaction network. Medicine (Baltimore). 2018; 97:e12032. https://doi.org/10.1097/MD.0000000000012032 [PubMed]
- 15. Zhang Y, Wang D, Shen D, Luo Y, Che YQ. Identification of exosomal miRNAs associated with the anthracycline-induced liver injury in postoperative breast cancer patients by small RNA sequencing. PeerJ. 2020; 8:e9021. https://doi.org/10.7717/peerj.9021 [PubMed]
- 16. Tachtsidis A, Le AV, Blick T, Gunasinghe D, De Sousa E, Waltham M, Dobrovic A, Thompson EW. Human-specific RNA analysis shows uncoupled epithelial-mesenchymal plasticity in circulating and disseminated tumour cells from human breast cancer xenografts. Clin Exp Metastasis. 2019; 36:393–409. https://doi.org/10.1007/s10585-019-09977-y [PubMed]
- 17. Messeha SS, Zarmouh NO, Mendonca P, Alwagdani H, Cotton C, Soliman KF. Effects of gossypol on apoptosis-related gene expression in racially distinct triple-negative breast cancer cells. Oncol Rep. 2019; 42:467–78. https://doi.org/10.3892/or.2019.7179 [PubMed]
- 18. Lee S, Hallis SP, Jung KA, Ryu D, Kwak MK. Impairment of HIF-1α-mediated metabolic adaption by NRF2-silencing in breast cancer cells. Redox Biol. 2019; 24:101210. https://doi.org/10.1016/j.redox.2019.101210 [PubMed]
- 19. Campbell EJ, Dachs GU, Morrin HR, Davey VC, Robinson BA, Vissers MC. Activation of the hypoxia pathway in breast cancer tissue and patient survival are inversely associated with tumor ascorbate levels. BMC Cancer. 2019; 19:307. https://doi.org/10.1186/s12885-019-5503-x [PubMed]
- 20. Hachim IY, López-Ozuna VM, Hachim MY, Lebrun JJ, Ali S. Prolactin hormone exerts anti-tumorigenic effects in HER-2 overexpressing breast cancer cells through regulation of stemness. Stem Cell Res. 2019; 40:101538. https://doi.org/10.1016/j.scr.2019.101538 [PubMed]
- 21. Hachim IY, López-Ozuna VM, Hachim MY, Lebrun JJ, Ali S. Concomitant Expression of Prolactin Receptor and TGFβ Receptors in Breast Cancer: Association with Less Aggressive Phenotype and Favorable Patient Outcome. Int J Mol Sci. 2019; 20:1640. https://doi.org/10.3390/ijms20071640 [PubMed]
- 22. MacDonald TM, Thomas LN, Daze E, Marignani P, Barnes PJ, Too CK. Prolactin-inducible EDD E3 ubiquitin ligase promotes TORC1 signalling, anti-apoptotic protein expression, and drug resistance in breast cancer cells. Am J Cancer Res. 2019; 9:1484–503. [PubMed]
- 23. Głodzik D, Purdie C, Rye IH, Simpson PT, Staaf J, Span PN, Russnes HG, Nik-Zainal S. Mutational mechanisms of amplifications revealed by analysis of clustered rearrangements in breast cancers. Ann Oncol. 2018; 29:2223–31. https://doi.org/10.1093/annonc/mdy404 [PubMed]
- 24. Hu JY, Yi W, Wei X, Zhang MY, Xu R, Zeng LS, Huang ZJ, Chen JS. miR-601 is a prognostic marker and suppresses cell growth and invasion by targeting PTP4A1 in breast cancer. Biomed Pharmacother. 2016; 79:247–53. https://doi.org/10.1016/j.biopha.2016.02.014 [PubMed]
- 25. Flores-Pérez A, Marchat LA, Rodríguez-Cuevas S, Bautista VP, Fuentes-Mera L, Romero-Zamora D, Maciel-Dominguez A, de la Cruz OH, Fonseca-Sánchez M, Ruíz-García E, la Vega HA, López-Camarillo C. Suppression of cell migration is promoted by miR-944 through targeting of SIAH1 and PTP4A1 in breast cancer cells. BMC Cancer. 2016; 16:379. https://doi.org/10.1186/s12885-016-2470-3 [PubMed]
- 26. Lucci MA, Orlandi R, Triulzi T, Tagliabue E, Balsari A, Villa-Moruzzi E. Expression profile of tyrosine phosphatases in HER2 breast cancer cells and tumors. Cell Oncol. 2010; 32:361–72. https://doi.org/10.3233/CLO-2010-0520 [PubMed]
- 27. Kothari S, Cizeau J, McMillan-Ward E, Israels SJ, Bailes M, Ens K, Kirshenbaum LA, Gibson SB. BNIP3 plays a role in hypoxic cell death in human epithelial cells that is inhibited by growth factors EGF and IGF. Oncogene. 2003; 22:4734–44. https://doi.org/10.1038/sj.onc.1206666 [PubMed]
- 28. Liu LZ, He YZ, Dong PP, Ma LJ, Wang ZC, Liu XY, Duan M, Yang LX, Shi JY, Zhou J, Fan J, Gao Q, Wang XY. Protein tyrosine phosphatase PTP4A1 promotes proliferation and epithelial-mesenchymal transition in intrahepatic cholangiocarcinoma via the PI3K/AKT pathway. Oncotarget. 2016; 7:75210–20. https://doi.org/10.18632/oncotarget.12116 [PubMed]
- 29. Zhao L, Man Y, Liu S. Long non-coding RNA HULC promotes UVB-induced injury by up-regulation of BNIP3 in keratinocytes. Biomed Pharmacother. 2018; 104:672–78. https://doi.org/10.1016/j.biopha.2018.05.100 [PubMed]
- 30. Rong J, Xu J, Liu Q, Wu Y, Guo H, Mu T, Zhou H, Chi H. Upregulation of long noncoding RNA RP4 exacerbates hypoxia injury in cardiomyocytes through regulating miR-939/Bnip3/Wnt/β-catenin pathway. Artif Cells Nanomed Biotechnol. 2019; 47:3013–20. https://doi.org/10.1080/21691401.2019.1640232 [PubMed]