


Introduction
Growth hormone (GH) and its receptor (GHR) are not only important for regulating growth, they have many other important biological functions including response to nutrients, regulation of metabolism and controlling physiological processes related to the hepatobiliary, cardiovascular, renal, gastrointestinal, and reproductive systems [1, 2]. Growth hormone signaling is an important regulator of aging. GH deficiency leads to slower growth, delayed maturation, reduced body size, and can result in attenuation of the rate of aging, increased health-span, and increased longevity [2]. Key to this are evolutionarily conserved pathways of insulin/insulin-like growth factors and mechanistic target of rapamycin, where there are trade-offs between anabolic processes/growth and lifespan. Accordingly, the GH deficient Ames dwarf mouse is long lived [3], whereas GH transgenic mice have shortened lifespans [2]. Disruption of the GHR in Ghr−/− mice leads to 55% and 38% longer lifespan in males and females, respectively [4]. Lifespan extension accompanying targeted deletion of both the GH releasing hormone gene and Ghr reduces lean body mass, bone mineral density, and increases adiposity [5]. GH signaling also increases the risk of cancer [2].
We have reported a significant negative association between height and longevity in our large cohort of American men of Japanese ancestry [6]. More recently, in a case-control study of 13 single nucleotide polymorphisms (SNPs) of GHR in this cohort (Supplementary Methods, Supplementary Study cohort, and Supplementary Table 1), SNP rs4130113 was associated with greater lifespan of nonagenarian men aged ≥ 95 years [7] (Supplementary Table 2). Bonferroni corrected p value was 0.015 for rs4130113 in a major allele (A) vs minor allele (G) carrier recessive model. Besides the longevity findings in Ghr null mice, we studied GHR because in mouse liver GHR was differentially expressed (downregulated 2.1-fold), in response to the well-established longevity effector, caloric restriction [8].
In the present longitudinal study, we tested the hypothesis that genetic variation in GHR affects lifespan at least in part by protection against the detrimental effects of one or more aging-related diseases, namely diabetes, hypertension, coronary heart disease, and/or cancer. We identify putative functional differences attributable to our longevity variant and describe how these changes may influence the phenotype of disease resilience.
Results
Characteristics of subjects
Shown in Table 1 are baseline (1991–1993) characteristics of men in the study, adjusting for age, according to each genotype of GHR SNP rs4130113, and prevalence of medical conditions. Analyses found no evidence of population stratification in the dataset (data not shown). By December 31, 2019, 3521 out of 3557 (99.0%) subjects had died during the overall 29 years of follow-up (mean 10.8 ± 6.5 SD years – range 0.01–28.8 years). At baseline, among the 3557 participants, 28.5% had been diagnosed with diabetes, 53.4% with hypertension, 20.5% with CHD, and 13.6% with cancer. Mean age at death was 88.6 ± 6.1 years for men with at least one disease, and 89.5 ± 6.0 years for those with none (p < 0.0001). In hypertensive subjects, prevalence of diabetes, hypertension, CHD and cancer did not differ significantly between each genotype.
Table 1. Characteristics of all subjects at baseline by GHR rs4130113 genotype.
| Characteristics | AA | AG | GG | p | |||||||||||||||||||||||||||||||||||||||||||||||||||||||||||||||||||||||||||||||||||||||||||||||
| n | 1256 | 1692 | 609 | ||||||||||||||||||||||||||||||||||||||||||||||||||||||||||||||||||||||||||||||||||||||||||||||||
| Age at examination, y | 77.9 ± 4.6 | 77.6 ± 4.6 | 77.6 ± 4.7 | 0.14 | |||||||||||||||||||||||||||||||||||||||||||||||||||||||||||||||||||||||||||||||||||||||||||||||
| Birth year | 1913.5 ± 4.6 | 1913.9 ± 4.6 | 1913.8 ± 4.7 | 0.10 | |||||||||||||||||||||||||||||||||||||||||||||||||||||||||||||||||||||||||||||||||||||||||||||||
| Anthropometric and physiological | |||||||||||||||||||||||||||||||||||||||||||||||||||||||||||||||||||||||||||||||||||||||||||||||||||
| Height, cm | 161.6 ± 5.8 | 161.7 ± 5.6 | 162.1 ± 5.7 | 0.15 | |||||||||||||||||||||||||||||||||||||||||||||||||||||||||||||||||||||||||||||||||||||||||||||||
| Weight, kg | 61.7 ± 9.2 | 61 ± 9 | 61.9 ± 8.8 | 0.049 | |||||||||||||||||||||||||||||||||||||||||||||||||||||||||||||||||||||||||||||||||||||||||||||||
| Waist to hip ratio | 0.9 ± 0.1 | 0.9 ± 0.1 | 0.9 ± 0.1 | 0.44 | |||||||||||||||||||||||||||||||||||||||||||||||||||||||||||||||||||||||||||||||||||||||||||||||
| BMI, kg/m2 | 23.6 ± 3.2 | 23.3 ± 3.1 | 23.5 ± 2.9 | 0.078 | |||||||||||||||||||||||||||||||||||||||||||||||||||||||||||||||||||||||||||||||||||||||||||||||
| Triceps skinfold thickness, mm | 10.4 ± 4.1 | 9.9 ± 4.0 | 10.1 ± 3.8 | 0.013 | |||||||||||||||||||||||||||||||||||||||||||||||||||||||||||||||||||||||||||||||||||||||||||||||
| Subscapular skinfold thickness, mm | 16.6 ± 6.2 | 16.0 ± 6.0 | 15.8 ± 6 | 0.0053 | |||||||||||||||||||||||||||||||||||||||||||||||||||||||||||||||||||||||||||||||||||||||||||||||
| Best forced expiratory volume, L | 2.0 ± 0.5 | 2.1 ± 0.4 | 2.1 ± 0.5 | 0.11 | |||||||||||||||||||||||||||||||||||||||||||||||||||||||||||||||||||||||||||||||||||||||||||||||
| Grip strength, kg | 30.3 ± 5.9 | 30.2 ± 6.1 | 30.1 ± 6.5 | 0.90 | |||||||||||||||||||||||||||||||||||||||||||||||||||||||||||||||||||||||||||||||||||||||||||||||
| Blood pressure, systolic, mmHg | 149.9 ± 23.2 | 149.2 ± 23.6 | 148.7 ± 23.5 | 0.57 | |||||||||||||||||||||||||||||||||||||||||||||||||||||||||||||||||||||||||||||||||||||||||||||||
| Blood pressure, diastolic, mmHg | 80.1 ± 11.2 | 80 ± 11.5 | 79.5 ± 10.9 | 0.55 | |||||||||||||||||||||||||||||||||||||||||||||||||||||||||||||||||||||||||||||||||||||||||||||||
| Cognitive (CASI) score | 82.6 ± 14.5 | 82.6 ± 14.5 | 83.1 ± 14.8 | 0.76 | |||||||||||||||||||||||||||||||||||||||||||||||||||||||||||||||||||||||||||||||||||||||||||||||
| Hematological and biochemical | |||||||||||||||||||||||||||||||||||||||||||||||||||||||||||||||||||||||||||||||||||||||||||||||||||
| Total cholesterol, mg/dL | 190.8 ± 33.1 | 189.1 ± 33.2 | 189.6 ± 31.2 | 0.37 | |||||||||||||||||||||||||||||||||||||||||||||||||||||||||||||||||||||||||||||||||||||||||||||||
| HDL cholesterol, mg/dL | 51.2 ± 13.6 | 51.1 ± 13.3 | 49.9 ± 12.8 | 0.10 | |||||||||||||||||||||||||||||||||||||||||||||||||||||||||||||||||||||||||||||||||||||||||||||||
| Triglycerides, mg/dL | 150.8 ± 95.4 | 147.3 ± 94.4 | 150.9 ± 89.1 | 0.53 | |||||||||||||||||||||||||||||||||||||||||||||||||||||||||||||||||||||||||||||||||||||||||||||||
| Fasting plasma glucose, mg/dL | 112.4 ± 26.6 | 113.3 ± 30.3 | 113.5 ± 32.5 | 0.67 | |||||||||||||||||||||||||||||||||||||||||||||||||||||||||||||||||||||||||||||||||||||||||||||||
| Fasting plasma insulin, mIU/dL | 16.0 ± 13.5 | 15.4 ± 13.7 | 15.0 ± 11.2 | 0.31 | |||||||||||||||||||||||||||||||||||||||||||||||||||||||||||||||||||||||||||||||||||||||||||||||
| Plasma fibrinogen, mg/dL | 306.7 ± 65.3 | 306.6 ± 62.1 | 307.4 ± 65.6 | 0.96 | |||||||||||||||||||||||||||||||||||||||||||||||||||||||||||||||||||||||||||||||||||||||||||||||
| White blood cell count, 103/μL | 6.2 ± 1.7 | 6.3 ± 2.5 | 6.2 ± 1.7 | 0.12 | |||||||||||||||||||||||||||||||||||||||||||||||||||||||||||||||||||||||||||||||||||||||||||||||
| Health habits | |||||||||||||||||||||||||||||||||||||||||||||||||||||||||||||||||||||||||||||||||||||||||||||||||||
| Current smoker, % | 8.0 | 6.2 | 6.5 | 0.17 | |||||||||||||||||||||||||||||||||||||||||||||||||||||||||||||||||||||||||||||||||||||||||||||||
| Past smoker, % | 56.8 | 55.0 | 53.6 | 0.41 | |||||||||||||||||||||||||||||||||||||||||||||||||||||||||||||||||||||||||||||||||||||||||||||||
| Smoking, pack-years | 27.6 ± 35.4 | 25.4 ± 33.0 | 25.1 ± 34.4 | 0.20 | |||||||||||||||||||||||||||||||||||||||||||||||||||||||||||||||||||||||||||||||||||||||||||||||
| Alcohol consumption, ounces/month | 18.1 ± 40.1 | 19.6 ± 41.8 | 18.2 ± 37.8 | 0.58 | |||||||||||||||||||||||||||||||||||||||||||||||||||||||||||||||||||||||||||||||||||||||||||||||
| Physical activity index, metabolic work/day | 31 ± 4.6 | 30.8 ± 4.5 | 30.8 ± 4.6 | 0.38 | |||||||||||||||||||||||||||||||||||||||||||||||||||||||||||||||||||||||||||||||||||||||||||||||
| Difficulty in walking 0.8 km, % | 17.9 | 19.4 | 17.1 | 0.33 | |||||||||||||||||||||||||||||||||||||||||||||||||||||||||||||||||||||||||||||||||||||||||||||||
| On diabetes medication, % | 10.7 | 11.2 | 12.3 | 0.58 | |||||||||||||||||||||||||||||||||||||||||||||||||||||||||||||||||||||||||||||||||||||||||||||||
| Diseases | |||||||||||||||||||||||||||||||||||||||||||||||||||||||||||||||||||||||||||||||||||||||||||||||||||
| Hypertension (160/95), % | 53.5 | 53.5 | 53.4 | 1.00 | |||||||||||||||||||||||||||||||||||||||||||||||||||||||||||||||||||||||||||||||||||||||||||||||
| Coronary heart disease, % | 19.8 | 20.3 | 22.5 | 0.40 | |||||||||||||||||||||||||||||||||||||||||||||||||||||||||||||||||||||||||||||||||||||||||||||||
| Stroke history, % | 4.2 | 3.9 | 5.9 | 0.11 | |||||||||||||||||||||||||||||||||||||||||||||||||||||||||||||||||||||||||||||||||||||||||||||||
| Cancer, % | 15.1 | 13.3 | 10.7 | 0.032 | |||||||||||||||||||||||||||||||||||||||||||||||||||||||||||||||||||||||||||||||||||||||||||||||
| Diabetes, % | 26.9 | 28.8 | 31.1 | 0.16 | |||||||||||||||||||||||||||||||||||||||||||||||||||||||||||||||||||||||||||||||||||||||||||||||
| Depressive symptoms, % | 9.1 | 10.2 | 10.3 | 0.61 | |||||||||||||||||||||||||||||||||||||||||||||||||||||||||||||||||||||||||||||||||||||||||||||||
| Emphysema, % | 2.6 | 2.8 | 3.5 | 0.55 | |||||||||||||||||||||||||||||||||||||||||||||||||||||||||||||||||||||||||||||||||||||||||||||||
| Bypass history, % | 7.2 | 6.7 | 8.5 | 0.32 | |||||||||||||||||||||||||||||||||||||||||||||||||||||||||||||||||||||||||||||||||||||||||||||||
| Angioplasty, % | 5.3 | 8.0 | 6.1 | 0.013 | |||||||||||||||||||||||||||||||||||||||||||||||||||||||||||||||||||||||||||||||||||||||||||||||
| Ankle-brachial index < 0.9%, % | 12.6 | 12.1 | 13.3 | 0.74 | |||||||||||||||||||||||||||||||||||||||||||||||||||||||||||||||||||||||||||||||||||||||||||||||
| Sociodemographic | |||||||||||||||||||||||||||||||||||||||||||||||||||||||||||||||||||||||||||||||||||||||||||||||||||
| Education, years | 10.4 ± 3 | 10.6 ± 3.2 | 10.5 ± 3.1 | 0.16 | |||||||||||||||||||||||||||||||||||||||||||||||||||||||||||||||||||||||||||||||||||||||||||||||
| Married, % | 83.0 | 83.5 | 83.1 | 0.93 | |||||||||||||||||||||||||||||||||||||||||||||||||||||||||||||||||||||||||||||||||||||||||||||||
| Genotype frequencies indicated Hardy-Weinberg equilibrium. The demographic data shown were age-adjusted. | |||||||||||||||||||||||||||||||||||||||||||||||||||||||||||||||||||||||||||||||||||||||||||||||||||
GHR genotype and survival in subjects with, and without, the various diseases
Table 2 shows the results for 3 genetic models, i.e., AA vs AG/GG, AG vs AA/GG, and GG vs AA/AG (where G is the minor allele), using Cox proportional hazard models by disease status for diabetes, hypertension, CHD and cancer.
Table 2. Hazard ratios (HR) of heterozygotes vs. homozygotes of GHR SNP rs4130113 and other models with total mortality in men with diabetes, hypertension, CHD and cancer.
| With the disease | Without the disease | ||||||||||||||||||||||||||||||||||||||||||||||||||||||||||||||||||||||||||||||||||||||||||||||||||
| Disorder (n with/w’out) | Cox model | Genetic model† | HR¥ (95% CI) | p | HR (95% CI) | p | |||||||||||||||||||||||||||||||||||||||||||||||||||||||||||||||||||||||||||||||||||||||||||||
| Diabetes | 1* | AG vs. AA/GG | 1.04 (0.92-1.18) | 0.54 | 1.07 (0.99-1.16) | 0.090 | |||||||||||||||||||||||||||||||||||||||||||||||||||||||||||||||||||||||||||||||||||||||||||||
| (1000, 2508) | 2** | AG vs. AA/GG | 1.06 (0.92-1.21) | 0.43 | 1.07 (0.98-1.16) | 0.14 | |||||||||||||||||||||||||||||||||||||||||||||||||||||||||||||||||||||||||||||||||||||||||||||
| Hypertension | 1 | AG vs. AA/GG | 1.18 (1.08-1.30) | 0.00027 | 0.95 (0.86-1.05) | 0.32 | |||||||||||||||||||||||||||||||||||||||||||||||||||||||||||||||||||||||||||||||||||||||||||||
| (1901, 1656) | 2 | AG vs. AA/GG | 1.20 (1.09-1.33) | 0.00034 | 0.92 (0.82-1.02) | 0.11 | |||||||||||||||||||||||||||||||||||||||||||||||||||||||||||||||||||||||||||||||||||||||||||||
| CHD | 1 | AG vs. AA/GG | 1.05 (0.91-1.22) | 0.48 | 1.08 (1.00-1.16) | 0.050 | |||||||||||||||||||||||||||||||||||||||||||||||||||||||||||||||||||||||||||||||||||||||||||||
| (730, 2827) | 2 | AG vs. AA/GG | 1.03 (0.88-1.21) | 0.71 | 1.08 (0.99-1.17) | 0.077 | |||||||||||||||||||||||||||||||||||||||||||||||||||||||||||||||||||||||||||||||||||||||||||||
| Cancer | 1 | AG vs. AA/GG | 0.98 (0.82-1.18) | 0.85 | 1.09 (1.01-1.17) | 0.022 | |||||||||||||||||||||||||||||||||||||||||||||||||||||||||||||||||||||||||||||||||||||||||||||
| (485, 3072) | 2 | AG vs. AA/GG | 0.95 (0.78-1.17) | 0.64 | 1.08 (1.00-1.17) | 0.042 | |||||||||||||||||||||||||||||||||||||||||||||||||||||||||||||||||||||||||||||||||||||||||||||
| Diabetes | 1 | AG/GG vs. AA | 1.04 (0.91-1.19) | 0.54 | 1.02 (0.94-1.10) | 0.70 | |||||||||||||||||||||||||||||||||||||||||||||||||||||||||||||||||||||||||||||||||||||||||||||
| (1000, 2508) | 2 | AG/GG vs. AA | 1.05 (0.91-1.21) | 0.52 | 1.00 (0.91-1.09) | 0.92 | |||||||||||||||||||||||||||||||||||||||||||||||||||||||||||||||||||||||||||||||||||||||||||||
| Hypertension | 1 | AG/GG vs. AA | 1.12 (1.02-1.24) | 0.015 | 0.93 (0.84-1.03) | 0.17 | |||||||||||||||||||||||||||||||||||||||||||||||||||||||||||||||||||||||||||||||||||||||||||||
| (1901, 1656) | 2 | AG/GG vs. AA | 1.11 (1.00-1.23) | 0.059 | 0.90 (0.81-1.01) | 0.071 | |||||||||||||||||||||||||||||||||||||||||||||||||||||||||||||||||||||||||||||||||||||||||||||
| CHD | 1 | AG/GG vs. AA | 1.07 (0.92-1.25) | 0.37 | 1.02 (0.94-1.10) | 0.63 | |||||||||||||||||||||||||||||||||||||||||||||||||||||||||||||||||||||||||||||||||||||||||||||
| (730, 2827) | 2 | AG/GG vs. AA | 1.02 (0.86-1.21) | 0.80 | 1.01 (0.93-1.10) | 0.84 | |||||||||||||||||||||||||||||||||||||||||||||||||||||||||||||||||||||||||||||||||||||||||||||
| Cancer | 1 | AG/GG vs. AA | 0.93 (0.77-1.11) | 0.42 | 1.06 (0.98-1.14) | 0.15 | |||||||||||||||||||||||||||||||||||||||||||||||||||||||||||||||||||||||||||||||||||||||||||||
| (485, 3072) | 2 | AG/GG vs. AA | 0.88 (0.71-1.09) | 0.24 | 1.04 (0.96-1.13) | 0.37 | |||||||||||||||||||||||||||||||||||||||||||||||||||||||||||||||||||||||||||||||||||||||||||||
| Diabetes | 1 | AA/AG vs. GG | 1.00 (0.85-1.18) | 0.97 | 1.10 (0.99-1.22) | 0.085 | |||||||||||||||||||||||||||||||||||||||||||||||||||||||||||||||||||||||||||||||||||||||||||||
| (1000, 2508) | 2 | AA/AG vs. GG | 1.02 (0.86-1.21) | 0.82 | 1.13 (1.01-1.27) | 0.040 | |||||||||||||||||||||||||||||||||||||||||||||||||||||||||||||||||||||||||||||||||||||||||||||
| Hypertension | 1 | AA/AG vs. GG | 1.10 (0.98-1.24) | 0.11 | 1.03 (0.90-1.17) | 0.68 | |||||||||||||||||||||||||||||||||||||||||||||||||||||||||||||||||||||||||||||||||||||||||||||
| (1901, 1656) | 2 | AA/AG vs. GG | 1.16 (1.02-1.33) | 0.028 | 1.01 (0.88-1.17) | 0.86 | |||||||||||||||||||||||||||||||||||||||||||||||||||||||||||||||||||||||||||||||||||||||||||||
| CHD | 1 | AA/AG vs. GG | 0.98 (0.82-1.18) | 0.85 | 1.10 (1.00-1.22) | 0.053 | |||||||||||||||||||||||||||||||||||||||||||||||||||||||||||||||||||||||||||||||||||||||||||||
| (730, 2827) | 2 | AA/AG vs. GG | 1.02 (0.83-1.25) | 0.87 | 1.12 (1.00-1.25) | 0.041 | |||||||||||||||||||||||||||||||||||||||||||||||||||||||||||||||||||||||||||||||||||||||||||||
| Cancer | 1 | AA/AG vs. GG | 1.12 (0.86-1.45) | 0.41 | 1.06 (0.96-1.16) | 0.24 | |||||||||||||||||||||||||||||||||||||||||||||||||||||||||||||||||||||||||||||||||||||||||||||
| (485, 3072) | 2 | AA/AG vs. GG | 1.14 (0.85-1.53) | 0.37 | 1.08 (0.98-1.20) | 0.14 | |||||||||||||||||||||||||||||||||||||||||||||||||||||||||||||||||||||||||||||||||||||||||||||
| Diabetes | 1 | Additive | 1.02 (0.93-1.11) | 0.69 | 0.98 (0.93-1.04) | 0.51 | |||||||||||||||||||||||||||||||||||||||||||||||||||||||||||||||||||||||||||||||||||||||||||||
| (1000, 2508) | 2 | Additive | 1.01 (0.92-1.11) | 0.76 | 0.96 (0.91-1.02) | 0.24 | |||||||||||||||||||||||||||||||||||||||||||||||||||||||||||||||||||||||||||||||||||||||||||||
| Hypertension | 1 | Additive | 1.02 (0.96-1.09) | 0.44 | 0.96 (0.89-1.03) | 0.24 | |||||||||||||||||||||||||||||||||||||||||||||||||||||||||||||||||||||||||||||||||||||||||||||
| (1901, 1656) | 2 | Additive | 1.00 (0.94-1.07) | 0.94 | 0.95 (0.88-1.03) | 0.19 | |||||||||||||||||||||||||||||||||||||||||||||||||||||||||||||||||||||||||||||||||||||||||||||
| CHD | 1 | Additive | 1.04 (0.94-1.15) | 0.48 | 0.98 (0.93-1.03) | 0.47 | |||||||||||||||||||||||||||||||||||||||||||||||||||||||||||||||||||||||||||||||||||||||||||||
| (730, 2827) | 2 | Additive | 1.00 (0.90-1.12) | 0.93 | 0.97 (0.92-1.03) | 0.33 | |||||||||||||||||||||||||||||||||||||||||||||||||||||||||||||||||||||||||||||||||||||||||||||
| Cancer | 1 | Additive | 0.94 (0.82-1.07) | 0.32 | 1.01 (0.96-1.06) | 0.75 | |||||||||||||||||||||||||||||||||||||||||||||||||||||||||||||||||||||||||||||||||||||||||||||
| (485, 3072) | 2 | Additive | 0.91 (0.78-1.05) | 0.19 | 0.99 (0.94-1.05) | 0.84 | |||||||||||||||||||||||||||||||||||||||||||||||||||||||||||||||||||||||||||||||||||||||||||||
| Cox models: *Model 1: Age-adjusted; **Model 2: Covariate-adjusted, where covariates adjusted in Cox model were: age, BMI, glucose, smoking (pack-years), alcohol intake (ounces/month), physical activity index, depression, and stroke. | |||||||||||||||||||||||||||||||||||||||||||||||||||||||||||||||||||||||||||||||||||||||||||||||||||
| †Genetic models: Top: heterozygotes (AG) vs major allele homozygotes (AA) + minor allele homozygotes (GG). Middle: Major allele (A) vs minor allele (G) carrier recessive model. Bottom: Additive model. | |||||||||||||||||||||||||||||||||||||||||||||||||||||||||||||||||||||||||||||||||||||||||||||||||||
| ¥HR, hazard ratio (95% confidence interval). | |||||||||||||||||||||||||||||||||||||||||||||||||||||||||||||||||||||||||||||||||||||||||||||||||||
| After Bonferroni correction for multiple testing for covariate adjusted models (in total 32 models), only the effect of AG vs. AA/GG with hypertension was significant, pB = 0.011. | |||||||||||||||||||||||||||||||||||||||||||||||||||||||||||||||||||||||||||||||||||||||||||||||||||
The heterozygote disadvantage model showed a significant genotypic association with lifespan difference for just one of the 4 diseases, namely hypertension (p = 0.00027 for model 1 and p = 0.0034 for model 2; Table 2). After Bonferroni correction for the 32 comparisons in the multivariate analyses, the p values remained significant (p = 0.0086 and p = 0.011, respectively). Compared with the heterozygote (AG), being homozygous for either allele combined (AA or GG) showed significant protection against mortality in hypertensive subjects. The protection was similar for AA and GG (p = 0.92). However, in normotensive subjects, lifespan was significantly longer irrespective of GHR genotype (Kaplan-Meier Log-rank χ2 = 24.2, p = 8.9 x 10⁻⁷). Survival curves for hypertensive subjects and normotensive subjects according to whether their genotype was AG or AA/GG are shown in Figure 1. These curves were determined using a Cox proportional hazard model adding an interaction term of GHR with hypertension. Hazard ratios for homozygotes vs heterozygotes on mortality by hypertension status are shown in Table 3. In men with hypertension who had the longevity-associated genotype, mortality risk was reduced to normal (Figure 2). No genetic effects of GHR genotype on mortality were apparent in subjects with diabetes, CHD and cancer after Bonferroni correction (Table 2). For completeness, we also show the effect of GHR SNP rs4130113 on mortality in the whole cohort irrespective of disease status (Supplementary Table 3). As can be seen, only the heterozygote disadvantage model showed an association of rs4130113 with longevity.
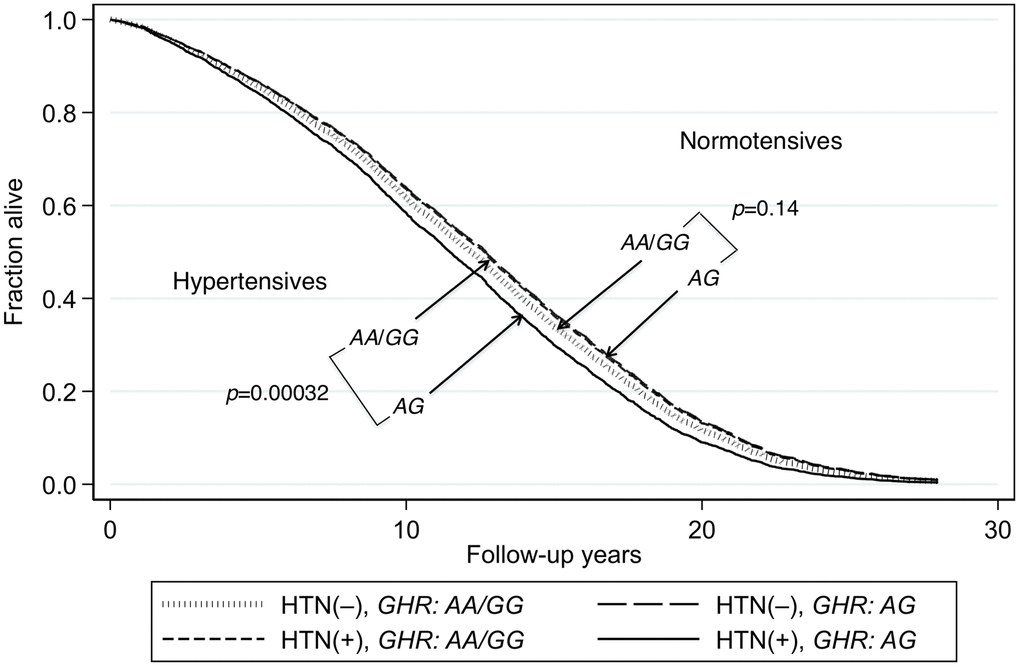
Figure 1. Survival curves spanning the period from baseline (1991–1993) to Dec 31, 2019 for subjects with and without hypertension according to genotypes of GHR SNP rs4130113. The survival probabilities were estimated from the Cox proportional hazard model: h(t) = h(t0) * exp(β1*Age + β2*BMI + β3*glucose + β4*hypertension + β5*GHR_AG + β6* (hypertension*GHR_ AG)), by fixing age at 75 years, BMI at the mean, 23.5 kg/m2, and glucose at the mean, 113 mg/dL (where β6 is the effect of the interaction of hypertension with GHR genotype on mortality, for AG vs AA/GG, i.e., a heterozygote disadvantage model, giving p(β6) = 0.0004). Survival curves of AG vs. AA/GG for hypertensive subjects and subjects without hypertension (p = 0.0003 and p = 0.14, respectively). In men with hypertension who had the longevity-associated genotype AA and those with the GG genotype, the mortality risk was reduced to a level not significantly different from subjects without hypertension (hypertensive AA/GG vs. normotensive AA/GG: p = 0.20; hypertensive AA/GG vs normotensive AG: p = 0.78).
Table 3. Hazard ratios (HR) of homozygotes (AA, GG) vs. heterozygotes (AG) of GHR SNP, rs4130113, with total mortality in men by hypertension status.
| Hypertensive (n = 1901) | Normotensive (n = 1656) | ||||||||||||||||||||||||||||||||||||||||||||||||||||||||||||||||||||||||||||||||||||||||||||||||||
| Cox model | Genetic model† | HR¥ (95% CI) | p | HR (95% CI) | p | ||||||||||||||||||||||||||||||||||||||||||||||||||||||||||||||||||||||||||||||||||||||||||||||
| 1* | AA vs AG | 0.85 (0.77-0.94) | 0.0012 | 1.08 (0.97-1.20) | 0.19 | ||||||||||||||||||||||||||||||||||||||||||||||||||||||||||||||||||||||||||||||||||||||||||||||
| GG vs AG | 0.84 (0.74-0.96) | 0.0079 | 1.00 (0.88-1.15) | 0.996 | |||||||||||||||||||||||||||||||||||||||||||||||||||||||||||||||||||||||||||||||||||||||||||||||
| 2** | AA vs AG | 0.87 (0.77-0.97) | 0.011 | 1.11 (0.99-1.25) | 0.0830 | ||||||||||||||||||||||||||||||||||||||||||||||||||||||||||||||||||||||||||||||||||||||||||||||
| GG vs AG | 0.81 (0.71-0.94) | 0.0041 | 1.02 (0.88-1.19) | 0.7702 | |||||||||||||||||||||||||||||||||||||||||||||||||||||||||||||||||||||||||||||||||||||||||||||||
| Cox models: *Model 1: Age-adjusted; **Model 2: Covariate-adjusted, where covariates adjusted in Cox model were: age, BMI, glucose, smoking (pack-years), alcohol intake (oz/mo), physical activity index, depression, cancer, and stroke, CHD, and diabetes. | |||||||||||||||||||||||||||||||||||||||||||||||||||||||||||||||||||||||||||||||||||||||||||||||||||
| †Genetic model: Heterozygote disadvantage. | |||||||||||||||||||||||||||||||||||||||||||||||||||||||||||||||||||||||||||||||||||||||||||||||||||
| ¥HR, hazard ratio; CI, confidence interval. | |||||||||||||||||||||||||||||||||||||||||||||||||||||||||||||||||||||||||||||||||||||||||||||||||||
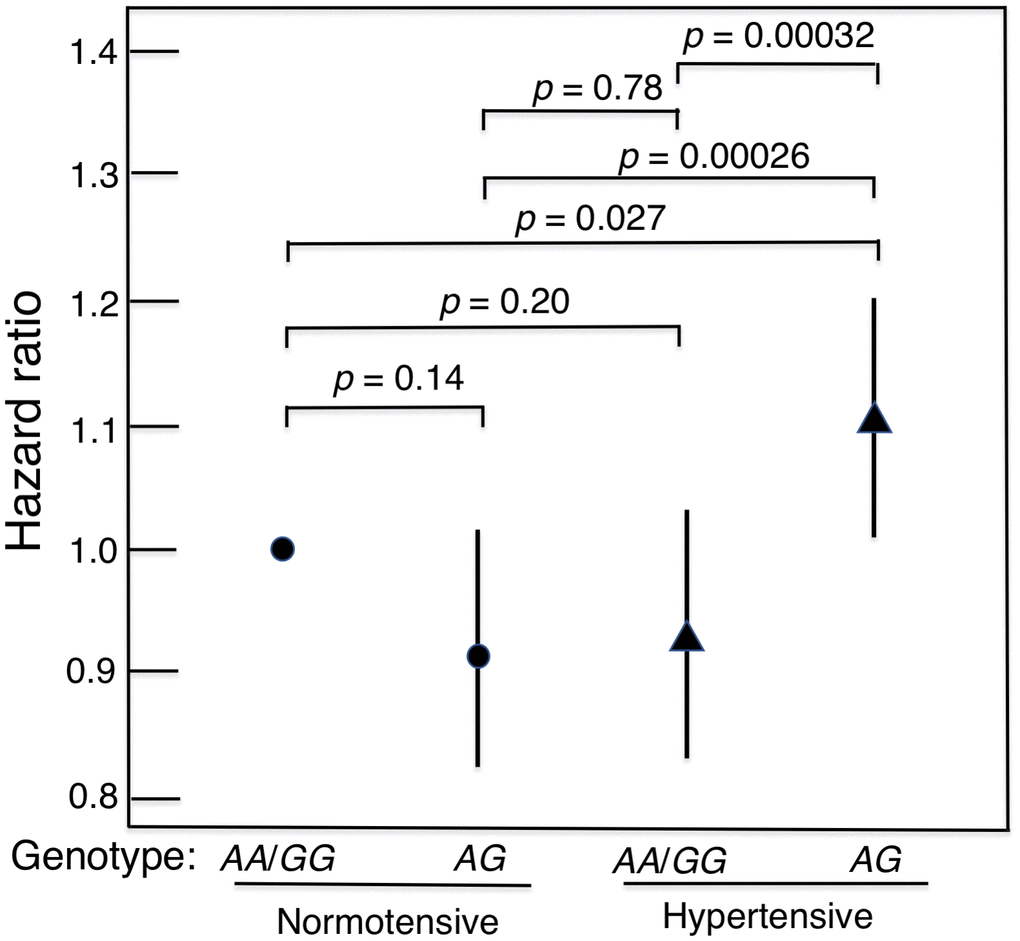
Figure 2. Mortality risk (hazard ratio), adjusted for age, BMI and glucose, for hypertensive subjects and normotensive subjects according to genotype of GHR SNP rs4130113 in heterozygote disadvantage model, AG vs.AA/GG. It can be seen that in men with hypertension who had a longevity-associated genotype, mortality risk was reduced to normal in that it did not differ significantly from the survival curves of normotensive men.
In a major allele recessive model, carriers of the longevity-associated minor allele (G) of rs4130113 showed a weaker association with lifespan difference in hypertensives compared with major allele homozygotes (p = 0.015 for model 1, and p = 0.059 for model 2) (Table 2), which were rendered nonsignificant by Bonferroni correction.
Functional annotations
In an attempt to determine how GHR may influence disease resistance and help to identify biological pathways we examined the following: (1) GHR tissue expression, (2) transcription factors (TFs) that might be modified by our sentinel SNP (rs4130113), (3) SNPs in linkage disequilibrium (LD) that might modify transcription factor binding, (4) the expression patterns of these TFs, and (5) the location of any cis-regulatory elements that are physically linked with our sentinel SNP. Supplementary Figure 1 shows that GHR is expressed most notably at high levels in adipose tissue, breast, liver, and muscle. We screened SNPs in and around rs4130113 for functional annotations using the HaploReg database. Our longevity SNP was predicted to influence the binding of transcription factors E2A, MYF, NRSF, TAL1, and TCF12 (Supplementary Figure 2). The effect of the major (i.e., more common) allele is predicted to reduce binding of E2A, MYF, NRSF and TCF12, and increase binding of TAL1. Biological effects, biological pathways, and tissue expression of these transcription factors are shown in Supplementary Table 4, and include expression in muscle, neuronal cells, hematopoietic tissues and skin. While no other SNPs were in strong LD, three putative functional features were in moderate LD with rs4130113 and were examined in more detail in Supplementary Figure 3 and Supplementary Table 5. A super-enhancer that is active in adipose tissue occupies a large portion of GHR. A 3,812 bp downstream promoter, LOC107963949, is specific for the most abundant version of the GHR protein (v1) found in liver. Variant rs10941580 is an intronic expression QTL (ieQTL), which is a variant associated with differences in mRNA expression levels, and may also be a pre-mRNA splicing-related QTL (sQTL) that, by an influence on splicing, would affect protein isoform profiles in adipose tissue, muscle, nerve, thyroid, and breast tissues), as shown in Supplementary Table 6. This variant is also identified as causing “non-sense–mediated transcript decay” (Supplementary Table 4). As well, the SNP has been identified as an eQTL that influences expression and exon usage in the above tissues (see GTEx database). Since these variants are in a non-coding region of the genome, they are presumed to affect transcription and/or mRNA splicing/exon usage, whether directly or indirectly as chromatin modifying units (i.e., cis-regulatory elements). The tissue spectrum of GHR expression involves high levels in adipose tissue, breast, liver, and muscle, as shown in Supplementary Figure 1. According to the GTEx database, GHR has 13 different transcripts that result in five major isoforms. The majority of these are expressed in liver, muscle, breast, and adipose tissue (Supplementary Figure 4). Screening of GHR for eQTLs using the GTEx portal identified 4,568 entries in addition to rs10941580 (not shown) and 18,128 sQTLs in addition to rs10941580 (not shown). Data supporting the involvement of rs10941580 with exon usage and the tissues involved are shown in Supplementary Table 6.
In an attempt to determine how the GHR longevity SNP might influence biological pathways and to try to define the role that rs4130113 plays in resilience, we mapped the above potential regulatory sites using the WashU Genome Browser. Supplementary Figure 5 shows the location of GHR and its various transcripts (purple herring bones) and the location of the super-enhancer (bar) along with location of the three features: rs4130113, LOC107963949, and rs10941580. Shown in the Figure are data from ChIP-seq experiments, as follows: (a) DNAse I sensitive sites in muscle, (b) H3Kme3 histone marks in liver, (c), histone H3K27ac marks in muscle, (d) histone H3K27ac in liver, (e) histone H3K4me1 marks in liver, (f) H3K36me3 marks in liver, (g) histone marks in the HepG2 cell line (all of these using chromHMM, which is software for learning and characterizing chromatin states that can integrate multiple chromatin datasets such as ChIP-seq data of various histone modifications to discover de novo the major reoccurring combinatorial and spatial patterns of chromatin marks), (h) the location of HNF4A binding, which has been shown to induce the “downstream promoter”, (i) locations of RNA polymerase II (RNAPII) binding, and (j) CTCF binding sites and chromatin loop domains. H3K4me3 and DNAse I hypersensitivity are associated with sites of open chromatin, which are associated with activation of transcription of nearby genes [9]. H3K27ac is associated with activation in promoters/enhancers, H3K4me1 with activation in enhancers, and H3K36me3 with activation in gene bodies. The GHR promoter, rs4130113 and “downstream promoter” overlap with sites of H3K4me3, H3K27ac, and DNAse I hypersensitivity, as well as CTCF binding sites, the latter being able to serve as either 3-dimensional insulators or for the grouping of functional features together in cis-acting topological domains. Together these features are predicted to form a cis-regulatory unit consisting of the super-enhancer, rs4130113, and open chromatin sites. This is supported by the locations of CTCF binding sites that generally form insulator domains [10, 11].
Discussion
The present study has found that the longevity-associated AA genotype (frequency 35.3%), but also the GG genotype (frequency 17.1%), of GHR SNP rs4130113 is associated with protection against risk of mortality in hypertensive elderly American men of Japanese ancestry. As a result, those individuals lived longer, whereas individuals with the AG genotype (frequency 47.6%) died sooner. Moreover, the survival curve for hypertensive AA/GG subjects did not differ significantly from the survival curve for normotensive subjects with the AA/GG genotype. This indicated that possession of the GHR longevity-associated genotype can mitigate the adverse effects on lifespan of having hypertension.
Long-lived Ghr–/– mice have elevated subcutaneous fat mass, APOE and insulin sensitivity of cardiac and skeletal muscle, but lower body weight, plasma cholesterol, IGF-I, plasma insulin, glucose tolerance, and cancer [12]. In our subjects, elevated BMI was associated with lower mortality in old age (HR = 0.96; 95% 0.95-0.97, p < 0.0001). Lifespan of mice with liver- and fat-specific Ghr knockout was not affected, and only a modest lifespan extension in males was seen in muscle-specific Ghr knockout mice [13]. Moreover, Ghr knockout in almost fully-grown mice can still extend lifespan, indicating the importance of GH-related mechanisms in adulthood [14]. GH secretion is lower and more tightly controlled in offspring of long-lived families when compared with their partners [15]. Subtle differences in GH-related effects are apparent between mice and humans, possibly arising from the fast vs. slow pace of life in each [2]. A notable example is the GHR exon 3 deletion variant that is associated with GH sensitivity, greater height, lower serum IGF-1, and longevity in men [16]. Individuals homozygous for a GHR exon 3 deletion (d3/d3) were reported to exhibit increased lifespan [16]. We did not, however, find an association of d3/d3 with longevity in our cohort. In the covariate-adjusted model, HR was 0.98 in the baseline sample. In the hypertensive subjects, HR was 1.02 (95% CI 0.84–1.24; p = 0.84). After adjusting for d3/d3 in the covariate model, the HR for the effect of GHR heterozygotes on mortality in hypertensive subjects was unchanged, 1.20 (1.09–1.33; p = 0.00034).
Heterozygote disadvantage is when a heterozygote has a lower overall fitness than either homozygote, and can be a potent driver of population genetic divergence [17]. Why then would heterozygotes with hypertension be at a disadvantage? The effect of transcription factor binding, whether positive or negative, would be greater in homozygotes (AA and GG) than heterozygotes (AG). The repertoire of transcription factors would in turn be influenced by external factors, including a prevailing pathophysiological condition, in this case hypertension. To elucidate the mechanism explaining heterozygote disadvantage, future research should aim to ascertain the effect of each individual transcription factor on each genotype in the hypertensive vs normotensive state. As background, the GHR is either a monomer or homodimer. GHR is encoded by at least 10 exons, with exons 2–7 encoding the extracellular domain, exon 8 the transmembrane domain, and exons 9–10 the intracellular domain [18]. The predominant isoform, version v1, is shown as ENST00000230882.8 in Supplementary Figure 4. The exon 3 deletion variant, GHGRd3, is shown as ENST00000357703.6, and is the result of a deletion of the exon rather than being caused by a splicing event. As can be seen in Supplementary Figure 4 there are multiple (as many as 13) transcripts caused by alternate splicing events, resulting in at least five protein isoforms that are differentially expressed, the majority of which are expressed largely in liver, muscle, and adipose tissue. Two of these alternatively spliced transcripts, at exon 9, GHR-(1–279) and GHR-(1–277), were identified in human liver [19, 20] and function as dominant negative inhibitors of the full-length receptor. GHR-(1–279) lacks the first 26 bp of exon 9 of the full-length receptor (GHRfl), whereas for GHR-(1–277) this exon is deleted in its entirety [20]. Both alternatively spliced isoforms result in a frame shift and a premature stop codon, leading to mRNAs with intact extracellular and transmembrane domains, but lacking more than 90% of the intracellular domain. While these receptor variants have no signaling capacity, they can inhibit GH action mediated by GHRfl in a dominant negative manner [20, 21]. Patients heterozygous for genetic variants or mutations that generate splicing-related deletion of exon 9 are GH-insensitive [21, 22], providing evidence for a pathophysiological role for these truncated receptors. We propose that the heterogeneity of protein isoforms helps to explain the disadvantage that heterozygotes with hypertension have for mortality. A search of the GTEx portal for other functional variants in GHR found that there are 18,128 neighboring SNPs associated with exon usage and 4,568 eQTL variants associated with expression levels. There is an ieQTL, rs10941580, that influences expression in adipose tissue, muscle, nerve, breast, and thyroid. An ieQTL is a cis-regulatory element that is predicted to influence the expression levels of a nearby gene [23].
Alternate splicing has been shown to change with age [24]. We believe that variants that influence transcript splicing are important factors in the heterozygote disadvantage model that we have found to be responsible for GHR resilience to aging-related morbidity risk.
In Japanese and other populations, hypertension increases risk of death from CHD [25], cerebrovascular accident (stroke) [25, 26], and dementia [27], each of which has genetic components [28–31]. Other GHR SNPs – rs6182, rs6180, rs6184 (minor allele frequencies 0.137, 0.387, 0.077) that are non-synonymous (amino acid changes Cys440Phe, Leu544Ile and Pro579Thr, respectively) – have been found to be associated with hypertension and elevated blood pressure in Japanese men [32]. These variants are located in exon 5 of isoform 1 and are missing in the isoform 12 precursor, leading to isoform 5. A UK study found an association of the longevity-associated [16] GHR exon 3 deletion variant with hypertension amongst stroke patients [33].
In conclusion, men without hypertension lived the longest, while, in the group with hypertension, those homozygous for either the major (common) or minor (less common) allele of GHR SNP rs4130113 lived longer than those who were heterozygous for this SNP. The overall association of genetic variation in GHR with mortality risk was contributed entirely by genotype-dependent amelioration of the increased mortality risk from hypertension.
Materials and Methods
Study participants
See Supplementary Methods and Supplementary Study Cohort.
Genotyping
Genotyping methods were as described previously [7] (Supplementary Methods).
Variant search
Variants surrounding rs4130113 were screened on the RegulomeDB site, which includes known and predicted regulatory elements in the intergenic regions, as well as regions of DNAase hypersensitivity, binding sites for transcription factors, and promoter regions. Sources of these data included public datasets from GEO, the ENCODE project, and published literature [34]. Chromosome 5 locations used the GRCh37.p13 genome build (http://www.gencodegenes.org/releases/19.html).
We also screened the variants using HaploReg, which is a tool for exploring annotations of the noncoding genome at variants on haplotype blocks, such as candidate regulatory SNPs at disease-associated loci [35]. The sentinel SNP rs4130113 was not in strong LD with any other variants (Supplementary Figure 1). We also searched for transcription factor binding sites predicted to be significantly modified by this SNP.
Statistical analyses
General linear models were used to compare age-adjusted indirect measurements between groups, and logistic models was used to compare the age-adjusted direct measurements. Cox proportional models were used to assess the association of GHR for 3 genetic models – namely, AA vs AG/GG, AG vs AA/GG, and GG vs AA/AG – on mortality stratified by disease status, such as by diabetes, by hypertension, by CHD, and by cancer. The effects of the genotype on mortality were corrected for multiple tests using by the Bonferroni method. The significant genetic model was selected and used in the analyses. The Cox proportional hazard assumption was tested for each Cox model. The effect of interaction of disease with GHR genotype on mortality was tested in the Cox model. All statistical analyses were performed using the Statistical Analysis System version 9.4 [36]. Figures were generated using STATA 12 Graphics [37].
Supplementary Materials
Author Contributions
B.J.M. and T.A.D. conceived the idea presented, designed the study, steered the analyses and wrote the manuscript. R.C. performed statistical analyses of the data. K.H.M. and B.J.W. managed clinical aspects and collected the data. All authors discussed the results and contributed to the final manuscript.
Acknowledgments
The authors thank all study participants and their families for their cooperation and the Hawaii State Department of Health for its help. The authors wish to acknowledge Dr. Alvin T. Onaka, Brian Horiuchi, and Caryn Tottori of the Hawaii State Department of Health for providing death certificate data on cause of death for the KHHP participants, Ms. Ayako Elliott and Ms. Eva Ardo for assistance with genotyping, and Ms. Hiromi Nakada and Ms. Ka-on Fong for monitoring the vital status of KHHP participants.
Conflicts of Interest
The authors declare that they have no conflicts of interest.
Funding
Research reported in this publication was supported by the Kuakini Medical Center, the US National Institutes of Health (contract N01-AG-4-2149, Grants 5 U01 AG019349-05, 5R01AG027060 [Kuakini Hawaii Lifespan Study], 5R01AG038707 [Kuakini Hawaii Healthspan Study], 1P20GM125526-01A1 [Kuakini Center of Biomedical Research Excellence for Clinical and Translational Research on Aging]), and contract N01-HC-05102 from the National Heart, Lung, and Blood Institute.
References
- 1. Bartke A, Westbrook R. Metabolic characteristics of long-lived mice. Front Genet. 2012; 3:288. https://doi.org/10.3389/fgene.2012.00288 [PubMed]
- 2. Bartke A. Growth hormone and aging. Rev Endocr Metab Disord. 2021; 22:71–80. https://doi.org/10.1007/s11154-020-09593-2 [PubMed]
- 3. Brown-Borg HM, Borg KE, Meliska CJ, Bartke A. Dwarf mice and the ageing process. Nature. 1996; 384:33. https://doi.org/10.1038/384033a0 [PubMed]
- 4. Coschigano KT, Clemmons D, Bellush LL, Kopchick JJ. Assessment of growth parameters and life span of GHR/BP gene-disrupted mice. Endocrinology. 2000; 141:2608–13. https://doi.org/10.1210/endo.141.7.7586 [PubMed]
- 5. Icyuz M, Zhang F, Fitch MP, Joyner MR, Challa AK, Sun LY. Physiological and metabolic characteristics of novel double-mutant female mice with targeted disruption of both growth hormone-releasing hormone and growth hormone receptor. Aging Cell. 2021; 20:e13339. https://doi.org/10.1111/acel.13339 [PubMed]
- 6. He Q, Morris BJ, Grove JS, Petrovitch H, Ross W, Masaki KH, Rodriguez B, Chen R, Donlon TA, Willcox DC, Willcox BJ. Shorter men live longer: association of height with longevity and FOXO3 genotype in American men of Japanese ancestry. PLoS One. 2014; 9:e94385. https://doi.org/10.1371/journal.pone.0094385 [PubMed]
- 7. Donlon TA, Morris BJ, Chen R, Masaki KH, Allsopp RC, Willcox DC, Tiirikainen M, Willcox BJ. Analysis of polymorphisms in 59 potential candidate genes for association with human longevity. J Gerontol A Biol Sci Med Sci. 2018; 73:1459–64. https://doi.org/10.1093/gerona/glx247 [PubMed]
- 8. Estep PW 3rd, Warner JB, Bulyk ML. Short-term calorie restriction in male mice feminizes gene expression and alters key regulators of conserved aging regulatory pathways. PLoS One. 2009; 4:e5242. https://doi.org/10.1371/journal.pone.0005242 [PubMed]
- 9. Morris BJ, Willcox BJ, Donlon TA. Genetic and epigenetic regulation of human aging and longevity. Biochim Biophys Acta Mol Basis Dis. 2019; 1865:1718–44. https://doi.org/10.1016/j.bbadis.2018.08.039 [PubMed]
- 10. Ali T, Renkawitz R, Bartkuhn M. Insulators and domains of gene expression. Curr Opin Genet Dev. 2016; 37:17–26. https://doi.org/10.1016/j.gde.2015.11.009 [PubMed]
- 11. Donlon TA, Morris BJ. In silico analysis of human renin gene-gene interactions and neighborhood topologically associated domains suggests breakdown of insulators contribute to ageing-associated diseases. Biogerontology. 2019; 20:857–69. https://doi.org/10.1007/s10522-019-09834-1 [PubMed]
- 12. Young JA, List EO, Kopchick JJ. Deconstructing the growth hormone receptor (GHR): Physical and metabolic phenotypes of tissue-specific GHR gene-disrupted mice. Prog Mol Biol Transl Sci. 2016; 138:27–39. https://doi.org/10.1016/bs.pmbts.2015.10.014 [PubMed]
- 13. List EO, Berryman DE, Ikeno Y, Hubbard GB, Funk K, Comisford R, Young JA, Stout MB, Tchkonia T, Masternak MM, Bartke A, Kirkland JL, Miller RA, Kopchick JJ. Removal of growth hormone receptor (GHR) in muscle of male mice replicates some of the health benefits seen in global GHR-/- mice. Aging (Albany NY). 2015; 7:500–12. https://doi.org/10.18632/aging.100766 [PubMed]
- 14. Junnila RK, Duran-Ortiz S, Suer O, Sustarsic EG, Berryman DE, List EO, Kopchick JJ. Disruption of the GH receptor gene in adult mice increases maximal lifespan in females. Endocrinology. 2016; 157:4502–13. https://doi.org/10.1210/en.2016-1649 [PubMed]
- 15. van der Spoel E, Jansen SW, Akintola AA, Ballieux BE, Cobbaert CM, Slagboom PE, Blauw GJ, Westendorp RG, Pijl H, Roelfsema F, van Heemst D. Growth hormone secretion is diminished and tightly controlled in humans enriched for familial longevity. Aging Cell. 2016; 15:1126–31. https://doi.org/10.1111/acel.12519 [PubMed]
- 16. Ben-Avraham D, Govindaraju DR, Budagov T, Fradin D, Durda P, Liu B, Ott S, Gutman D, Sharvit L, Kaplan R, Bougnères P, Reiner A, Shuldiner AR, et al. The GH receptor exon 3 deletion is a marker of male-specific exceptional longevity associated with increased GH sensitivity and taller stature. Sci Adv. 2017; 3:e1602025. https://doi.org/10.1126/sciadv.1602025 [PubMed]
- 17. Láruson ÁJ, Reed FA. Stability of underdominant genetic polymorphisms in population networks. J Theor Biol. 2016; 390:156–63. https://doi.org/10.1016/j.jtbi.2015.11.023 [PubMed]
- 18. Leung DW, Spencer SA, Cachianes G, Hammonds RG, Collins C, Henzel WJ, Barnard R, Waters MJ, Wood WI. Growth hormone receptor and serum binding protein: purification, cloning and expression. Nature. 1987; 330:537–43. https://doi.org/10.1038/330537a0 [PubMed]
- 19. Dastot F, Sobrier ML, Duquesnoy P, Duriez B, Goossens M, Amselem S. Alternatively spliced forms in the cytoplasmic domain of the human growth hormone (GH) receptor regulate its ability to generate a soluble GH-binding protein. Proc Natl Acad Sci USA. 1996; 93:10723–28. https://doi.org/10.1073/pnas.93.20.10723 [PubMed]
- 20. Ross RJ, Esposito N, Shen XY, Von Laue S, Chew SL, Dobson PR, Postel-Vinay MC, Finidori J. A short isoform of the human growth hormone receptor functions as a dominant negative inhibitor of the full-length receptor and generates large amounts of binding protein. Mol Endocrinol. 1997; 11:265–73. https://doi.org/10.1210/mend.11.3.9901 [PubMed]
- 21. Ayling RM, Ross R, Towner P, Von Laue S, Finidori J, Moutoussamy S, Buchanan CR, Clayton PE, Norman MR. A dominant-negative mutation of the growth hormone receptor causes familial short stature. Nat Genet. 1997; 16:13–14. https://doi.org/10.1038/ng0597-13 [PubMed]
- 22. Iida K, Takahashi Y, Kaji H, Nose O, Okimura Y, Abe H, Chihara K. Growth hormone (GH) insensitivity syndrome with high serum GH-binding protein levels caused by a heterozygous splice site mutation of the GH receptor gene producing a lack of intracellular domain. J Clin Endocrinol Metab. 1998; 83:531–37. https://doi.org/10.1210/jcem.83.2.4601 [PubMed]
- 23. Fish AE, Capra JA, Bush WS. Are interactions between cis-regulatory variants evidence for biological epistasis or statistical artifacts? Am J Hum Genet. 2016; 99:817–30. https://doi.org/10.1016/j.ajhg.2016.07.022 [PubMed]
- 24. Bhadra M, Howell P, Dutta S, Heintz C, Mair WB. Alternative splicing in aging and longevity. Hum Genet. 2020; 139:357–69. https://doi.org/10.1007/s00439-019-02094-6 [PubMed]
- 25. Satoh M, Ohkubo T, Asayama K, Murakami Y, Sugiyama D, Yamada M, Saitoh S, Sakata K, Irie F, Sairenchi T, Ishikawa S, Kiyama M, Ohnishi H, et al., and EPOCH-JAPAN Research Group. Lifetime risk of stroke and coronary heart disease deaths according to blood pressure level: EPOCH-JAPAN (Evidence for Cardiovascular Prevention From Observational Cohorts in Japan). Hypertension. 2019; 73:52–59. https://doi.org/10.1161/HYPERTENSIONAHA.118.11635 [PubMed]
- 26. Georgakis MK, Gill D, Malik R, Protogerou AD, Webb AJ, Dichgans M. Genetically predicted blood pressure across the lifespan: Differential effects of mean and pulse pressure on stroke risk. Hypertension. 2020; 76:953–61. https://doi.org/10.1161/HYPERTENSIONAHA.120.15136 [PubMed]
- 27. Ninomiya T, Ohara T, Hirakawa Y, Yoshida D, Doi Y, Hata J, Kanba S, Iwaki T, Kiyohara Y. Midlife and late-life blood pressure and dementia in Japanese elderly: the Hisayama study. Hypertension. 2011; 58:22–28. https://doi.org/10.1161/HYPERTENSIONAHA.110.163055 [PubMed]
- 28. Miyaki K, Htun NC, Song Y, Ikeda S, Muramatsu M, Shimbo T. The combined impact of 12 common variants on hypertension in Japanese men, considering GWAS results. J Hum Hypertens. 2012; 26:430–36. https://doi.org/10.1038/jhh.2011.50 [PubMed]
- 29. Lu X, Peloso GM, Liu DJ, Wu Y, Zhang H, Zhou W, Li J, Tang CS, Dorajoo R, Li H, Long J, Guo X, Xu M, et al, and GLGC Consortium. Exome chip meta-analysis identifies novel loci and East Asian-specific coding variants that contribute to lipid levels and coronary artery disease. Nat Genet. 2017; 49:1722–30. https://doi.org/10.1038/ng.3978 [PubMed]
- 30. Ehret GB, Ferreira T, Chasman DI, Jackson AU, Schmidt EM, Johnson T, Thorleifsson G, Luan J, Donnelly LA, Kanoni S, Petersen AK, Pihur V, Strawbridge RJ, et al. The genetics of blood pressure regulation and its target organs from association studies in 342,415 individuals. Nat Genet. 2016; 48:1171–84. https://doi.org/10.1038/ng.3667 [PubMed]
- 31. Weinstein G, Beiser AS, Au R, Decarli C, Wolf PA, Seshadri S. Association of parental stroke with brain injury and cognitive measures in offspring: the Framingham Heart Study. Stroke. 2013; 44:812–15. https://doi.org/10.1161/STROKEAHA.112.680520 [PubMed]
- 32. Kokubo Y, Tomoike H, Tanaka C, Banno M, Okuda T, Inamoto N, Kamide K, Kawano Y, Miyata T. Association of sixty-one non-synonymous polymorphisms in forty-one hypertension candidate genes with blood pressure variation and hypertension. Hypertens Res. 2006; 29:611–19. https://doi.org/10.1291/hypres.29.611 [PubMed]
- 33. Horan M, Newsway V, Ya, Lewis MD, Easter TE, Rees DA, Mahto A, Millar DS, Procter AM, Scanlon MF, Wilkinson IB, Hall IP, Wheatley A, et al. Genetic variation at the growth hormone (GH1) and growth hormone receptor (GHR) loci as a risk factor for hypertension and stroke. Hum Genet. 2006; 119:527–40. https://doi.org/10.1007/s00439-006-0166-5 [PubMed]
- 34. Boyle AP, Hong EL, Hariharan M, Cheng Y, Schaub MA, Kasowski M, Karczewski KJ, Park J, Hitz BC, Weng S, Cherry JM, Snyder M. Annotation of functional variation in personal genomes using RegulomeDB. Genome Res. 2012; 22:1790–97. https://doi.org/10.1101/gr.137323.112 [PubMed]
- 35. Ward LD, Kellis M. HaploReg: a resource for exploring chromatin states, conservation, and regulatory motif alterations within sets of genetically linked variants. Nucleic Acids Res. 2012; 40:D930–34. https://doi.org/10.1093/nar/gkr917 [PubMed]
- 36. Statistical Analysis System (SAS) version 9.4. SAS Institute, Cary, NC, USA. 2020. https://libguides.library.kent.edu/statconsulting/SAS.
- 37. StataCorp. Stata Statistical Software: Release 12. College Station, TX: StataCorp LP, 2011.