


Introduction
Depression or loss of facial tissue is a common problem in plastic surgery [1, 2]. Autologous fat grafting has become an important method for volume augmentation and tissue reconstruction, largely owing to several advantages of adipose tissue: abundance, ease of acquisition, and absence of a graft rejection reaction [3, 4]. However, the rigid support capacity of adipose tissue remains unsatisfactory for some clinical applications, grafting in the nasal base and chin [5, 6].
The stiffness of adipose tissue is 2–4 kPa [7], resulting in unsatisfactory rigid support capacity. The stiffness of adipose depends on the proportion of extracellular matrix (ECM) [8]. The ECM consists of various types of collagen, including collagen I, II, III, IV, and other small-fragment collagens [9, 10]. In particular, collagen I, the most prominent component of ECM distributed throughout the interstitium, constitutes up to 90% of the total connective tissue [11]. Thus, the low proportion of stable ECM and low percentage of collagen I are responsible for the low stiffness of adipose tissue.
Current fat grafting techniques, including centrifugation, mesh filtering, and the Telfa technique do not focus on collagen in adipose tissue [12]. Collagen I can provide mechanical rigidity [13] and also increase stiffness. The higher the proportion of type I collagen, the higher the tissue rigidity [14]. In addition, a high-stiffness environment could stimulate mesenchymal stem cells to secrete more collagen I [15]. Hence, we hypothesized that extraction of the collagen I-rich part of adipose tissue could increase the rigidity of a graft and maintain it for a long time after grafting.
Collagen I is a macromolecular fragment, which fibrillary assemblies could be crowding-enhanced matrix assembly with other type of collagen [16]. Matrix assembly can be easily blocked [17]. Accordingly, the collagen I-rich fraction of adipose tissue could be collected by physical mechanical process.
This study describes a practical strategy for transplantation of the collagen I-rich fraction, adipose matrix complex (AMC), which is obtained by mechanical preparation and purification of ECM from lipoaspirates. In comparison with Coleman fat, AMC contains a higher proportion of type I collagen; therefore, it has a higher stiffness. Consequently, it can be used for clinical filling of areas requiring rigid support (such as the nasal base and chin). We performed measurements to determine the stiffness of, and histological changes in, AMC before and after grafting and compared them with the corresponding properties of Coleman fat.
Results
Physical properties of AMC
General examination revealed that AMC had higher plasticity (Figure 1E, 1F) and higher stiffness than Coleman fat (6.1±0.83 kPa vs. 1.9±0.22 kPa, respectively; p<0.01) (Figure 1G), as well as a higher volume percentage of collagen 43±8.5% vs. 12±4.5%, respectively; p<0.01) (Figure 1H).
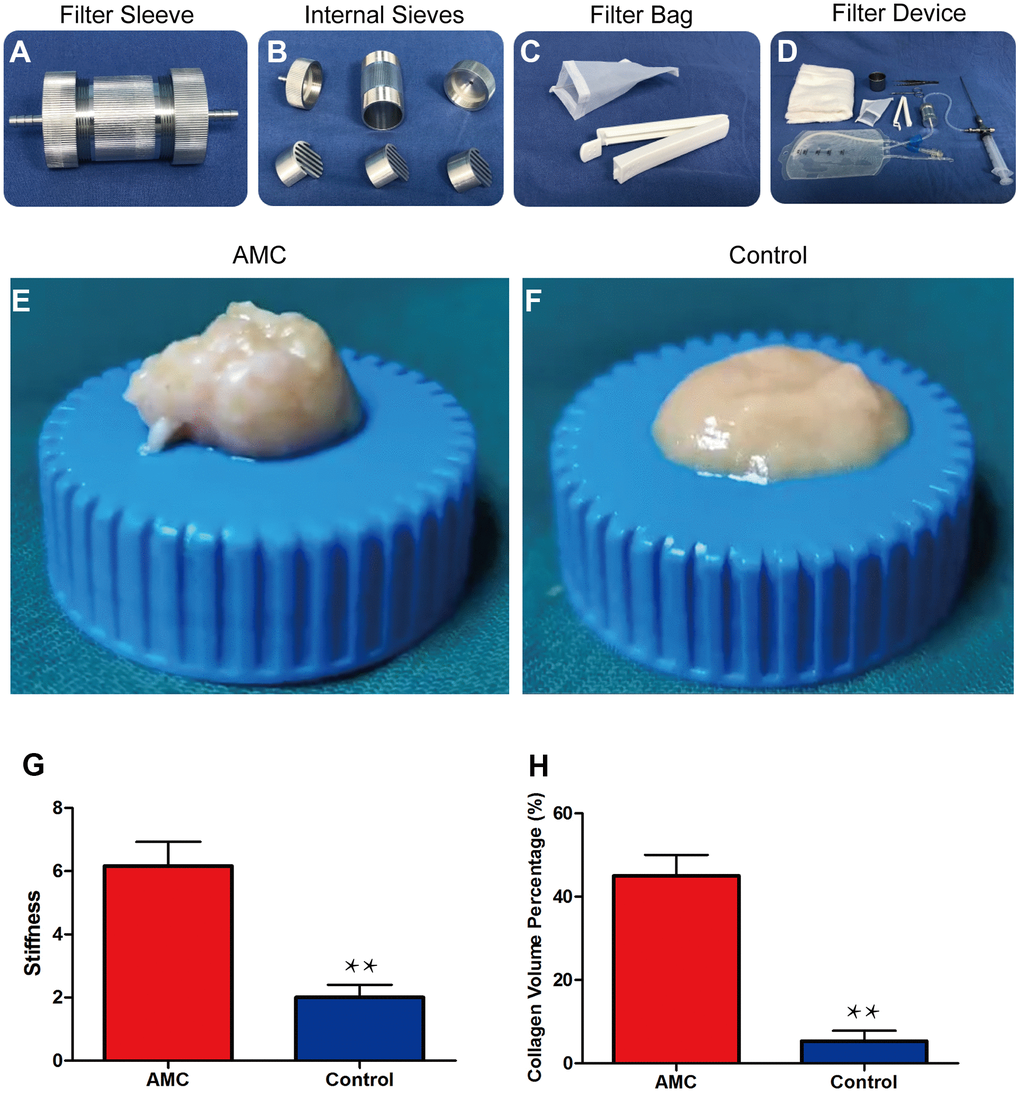
Figure 1. Preparation and physical properties of AMC. (A) Filter sleeve used to separate and collect AMC. (B) Three sieves inside the filter sleeve. (C) Filter bag (100 mesh) for dehydrating AMC. (D) The entire filter device used to prepare AMC. (E, F) Appearance of AMC and Coleman fat (control) before grafting. (G) Stiffness analysis of AMC and Coleman fat (control) before grafting. (H) Collagen volume percentage of AMC and Coleman fat (control) before grafting. Results are presented as the mean ± SD (n = 7 per group). ** control vs. AMC; P < 0.01.
Collagen and cell percentage of AMC
HE and Masson analysis revealed that more ECM was present in AMC than in Coleman fat (Figure 2A–2D). SEM examination confirmed that more fibrous connective tissue was present in AMC (Figure 2E, 2F). Collagen percentage was higher in AMC than Coleman fat (45±3.2% vs. 15±3.5%, respectively; p<0.01) (Figure 3A), as was the total number of cells (p<0.01) (Figure 3B). Quantitative analysis revealed that the levels of collagen I (Figure 3D) (p<0.01), collagen II (Figure 3E) (p<0.01), collagen III (Figure 3F) (p<0.05), and collagen IV (Figure 3G) (p<0.05) were higher in AMC than in the Coleman fat.
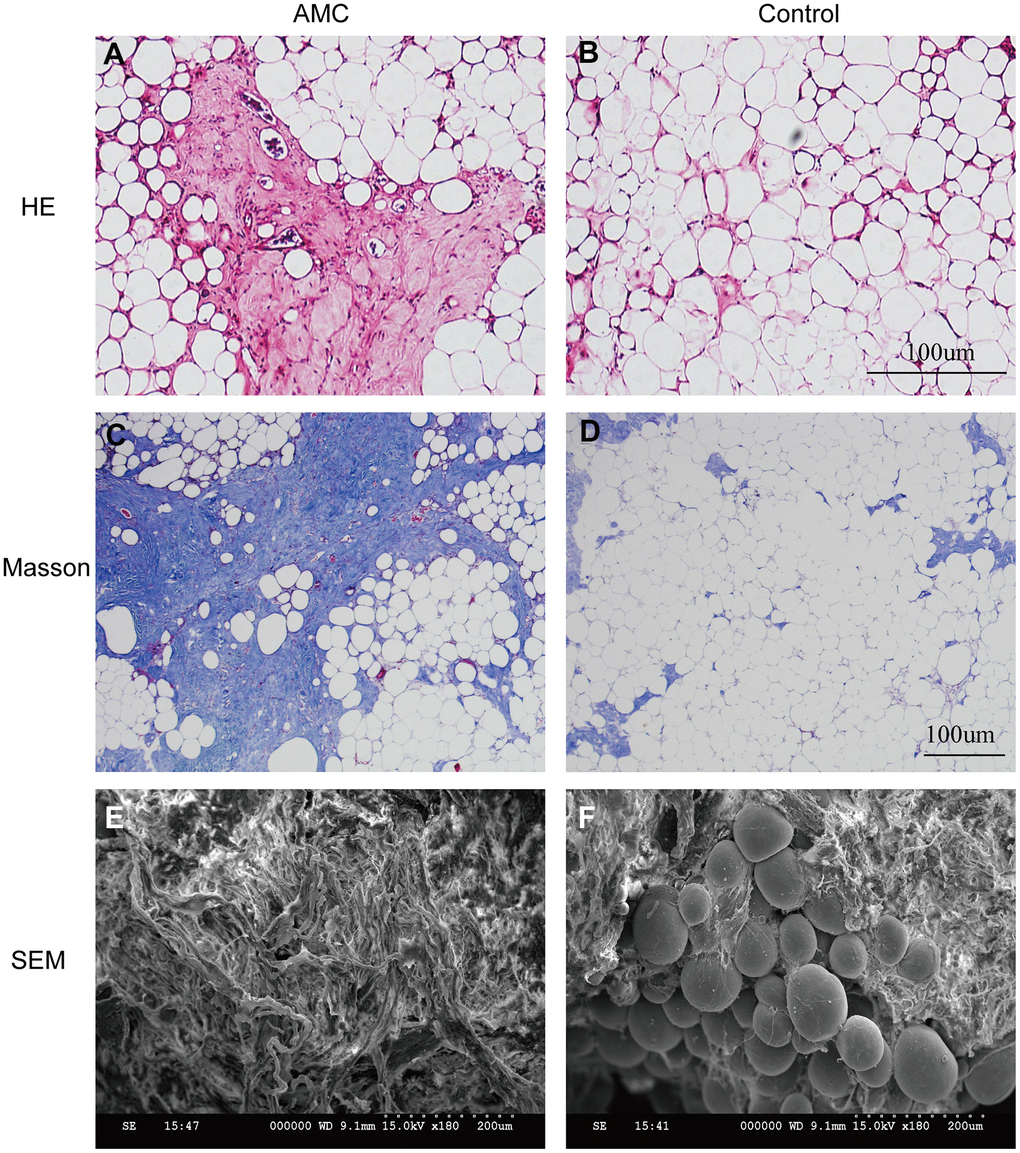
Figure 2. Histological structure analysis of AMC and Coleman fat. (A, B) Hematoxylin/eosin staining of AMC and Coleman fat (control) before grafting. (C, D) Masson’s trichrome staining of AMC and Coleman fat (control) before grafting. (E, F) Microstructure of AMC and Coleman fat (control) before grafting, as determined by electron microscopy.
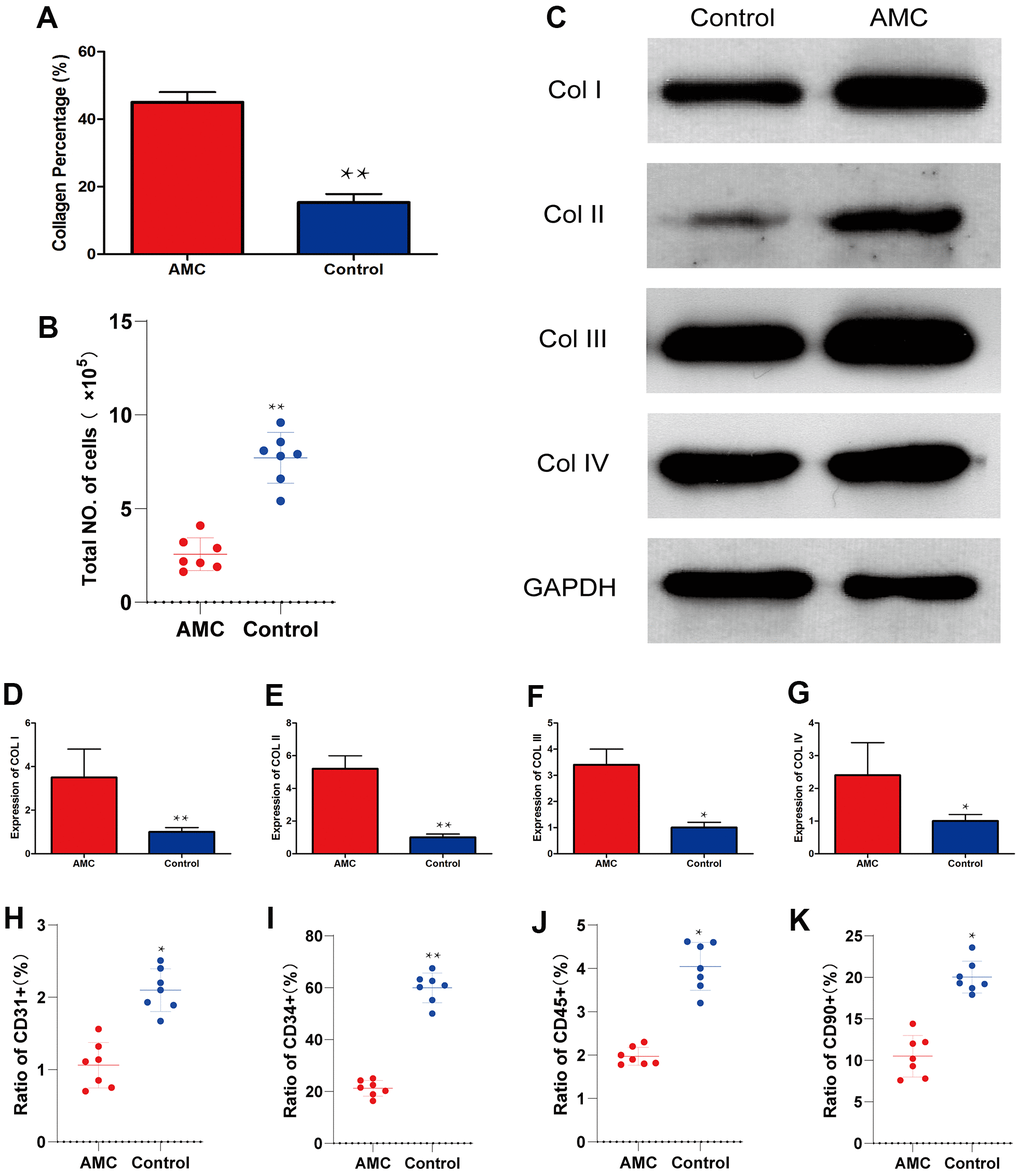
Figure 3. Collagen and cell percentage in AMC and Coleman fat. (A) Collagen percentage in AMC and Coleman fat (control) before grafting, as calculated by quantification of the positive area in Masson stained sections. (B) Total number of cells in AMC and Coleman fat (control) before grafting. (C) Expression of Collagen I, II, III, and IV in AMC and Coleman fat (control) before grafting. (D) Quantification of collagen I expression in AMC and Coleman fat (control) before grafting. (E) Quantification of collagen II expression in AMC and Coleman fat (control) before grafting. (F) Quantification of collagen III expression in AMC and Coleman fat (control group) before grafting. (G) Quantification of collagen IV expression in AMC and Coleman fat (control group) before grafting. (H) Ratio of CD31+ cells in AMC and Coleman fat (control group) before grafting, calculated by flow cytometry. (I) Ratio of CD31+ cells in AMC and Coleman fat (control group) before grafting, calculated by flow cytometry. (J) Ratio of CD90+ cells in AMC and Coleman fat (control group) before grafting, calculated by flow cytometry. (K) Ratio of CD45+ cells in AMC and Coleman fat (control group) before grafting, calculated by flow cytometry. Results are presented as the mean ± SD (n = 7 per group). * control vs. AMC; P < 0.05. * * control vs. AMC; P < 0.01.
Almost all cell subsets associated with regeneration, including CD31+ cells (Figure 3H) (p<0.05), CD34+ cells (Figure 3I) (p<0.01), and CD90+ cells (Figure 3J) (p<0.05), were significantly less abundant in AMC than in Coleman fat. The ratio of CD45+ cells was also lower in AMC (p<0.05) (Figure 3K).
Assessment of grafts
AMC and Coleman fat (Control Group) were grafted onto different sides on the backs of nude mice (Figure 4A). On Day 90, the two types of grafts had a similar outward appearance (Figure 4B). The retention rate of AMC was always higher than that of Control (75±7.5% vs. 42±13.5%, respectively). Volume retention decreased slowly in AMC, but decreased rapidly in Control, from Day 7 to 14. Final retention on Day 90 was higher in AMC than in in the Control (Figure 4C).
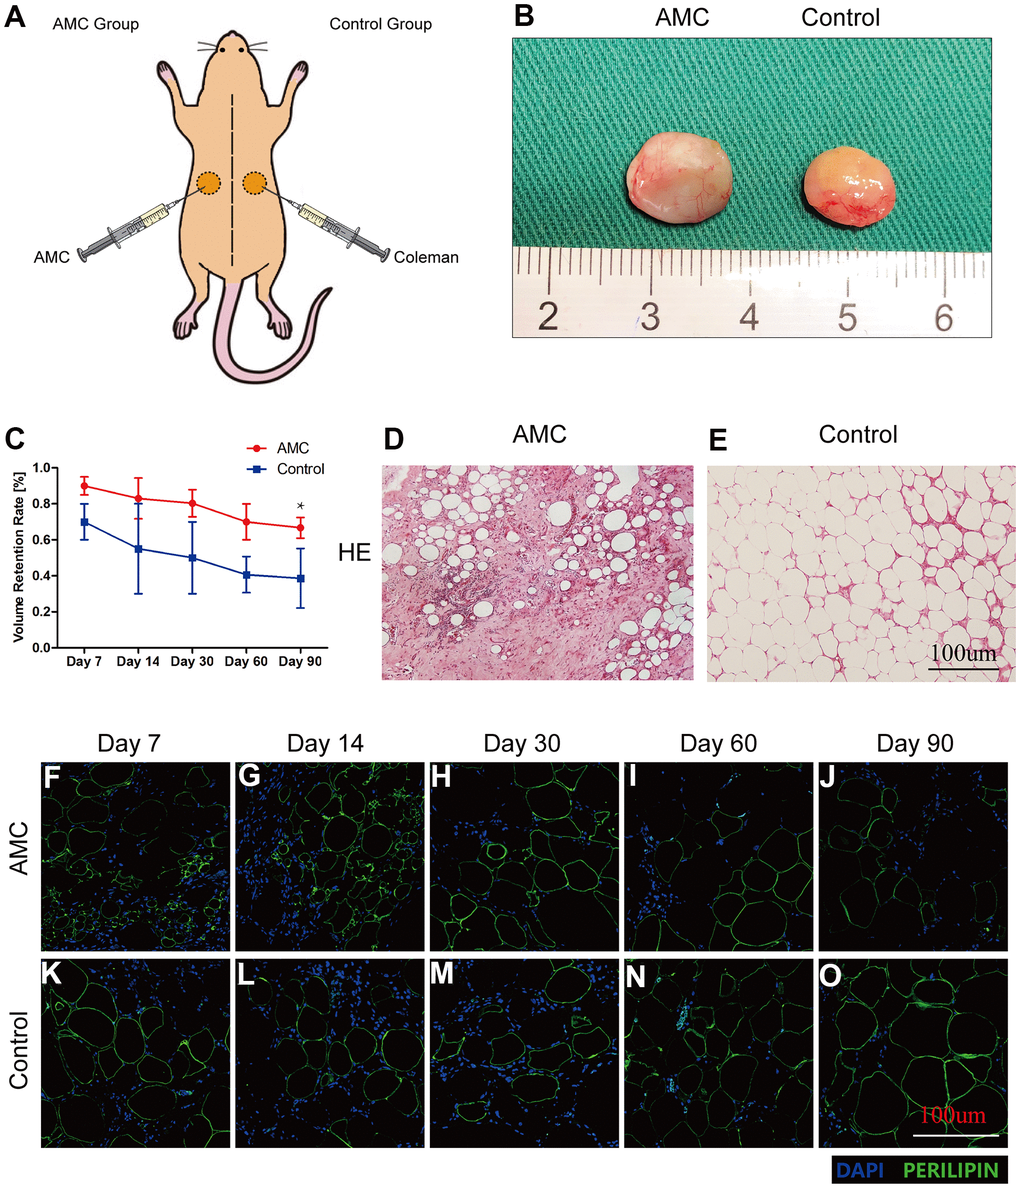
Figure 4. Retention and tissue structure of AMC and Coleman fat after grafting. (A) Transplantation of AMC and Coleman fat (control group) into nude mice. (B) Outward appearance of grafts in AMC and Coleman fat (control group) on Day 90. (C) Retention rates of grafts in AMC and Coleman fat (control group) on Days 7, 14, 30, 60, and 90 after grafting. (D, E) Hematoxylin/eosin staining of grafts in AMC and Coleman fat (control group) on Day 90 after grafting. (F–O) Immunofluorescence staining of grafts in AMC and Coleman fat (control group) on Days 7, 14, 30, 60, and 90. PERILIPIN+ (green) indicates adipose cells. DAPI+ (blue) indicates cell nuclei. Results are presented as the mean ± SD (n = 7 per group). * P < 0.05, control vs. AMC; ** P < 0.01, control vs. AMC.
Histological structure analysis of grafts in two groups
HE analysis revealed fewer adipocytes in AMC grafts (Figure 4D) than in Control grafts on Day 90 (Figure 4E). Immunofluorescence staining revealed that more cells infiltrated into AMC than Control grafts on Days 7 and 14 (Figure 4F, 4G, 4K, 4L), although the number of infiltrating cells decreased rapidly on Day 30 (Figure 4H, 4M). The area of mature adipocytes was smaller in AMC than Control grafts on Days 60 and 90 (Figure 4I, 4J, 4N, 4O).
Collagen analysis of grafts in two groups
Masson analysis revealed much more ECM in AMC (Figure 5A) than in Control grafts (Figure 5B) on Day 90. Immunohistochemistry revealed that in the AMC group, mouse collagen I increased from the outermost to the innermost of the organization (red line) from Day 7 to Day 90 (Figure 5C–5G). By contrast, in Control grafts, mouse collagen I increased steadily (Figure 5H–5L). Mouse collagen I was much more abundant in AMC than Control grafts on Day 90 (Figure 5G, 5L). Accordingly, the stiffness of AMC grafts was higher than that of Control grafts. Additionally, the stiffness of grafts in AMC was maintained at a high level after grafting, similar to the level before grafting (Figure 5M). Quantitative analysis revealed AMC grafts maintained a higher collagen percentage than Control grafts (Figure 5N). In addition, expression of mouse collagen I increased faster and remained at a higher level in AMC than in Control grafts (Figure 5O).
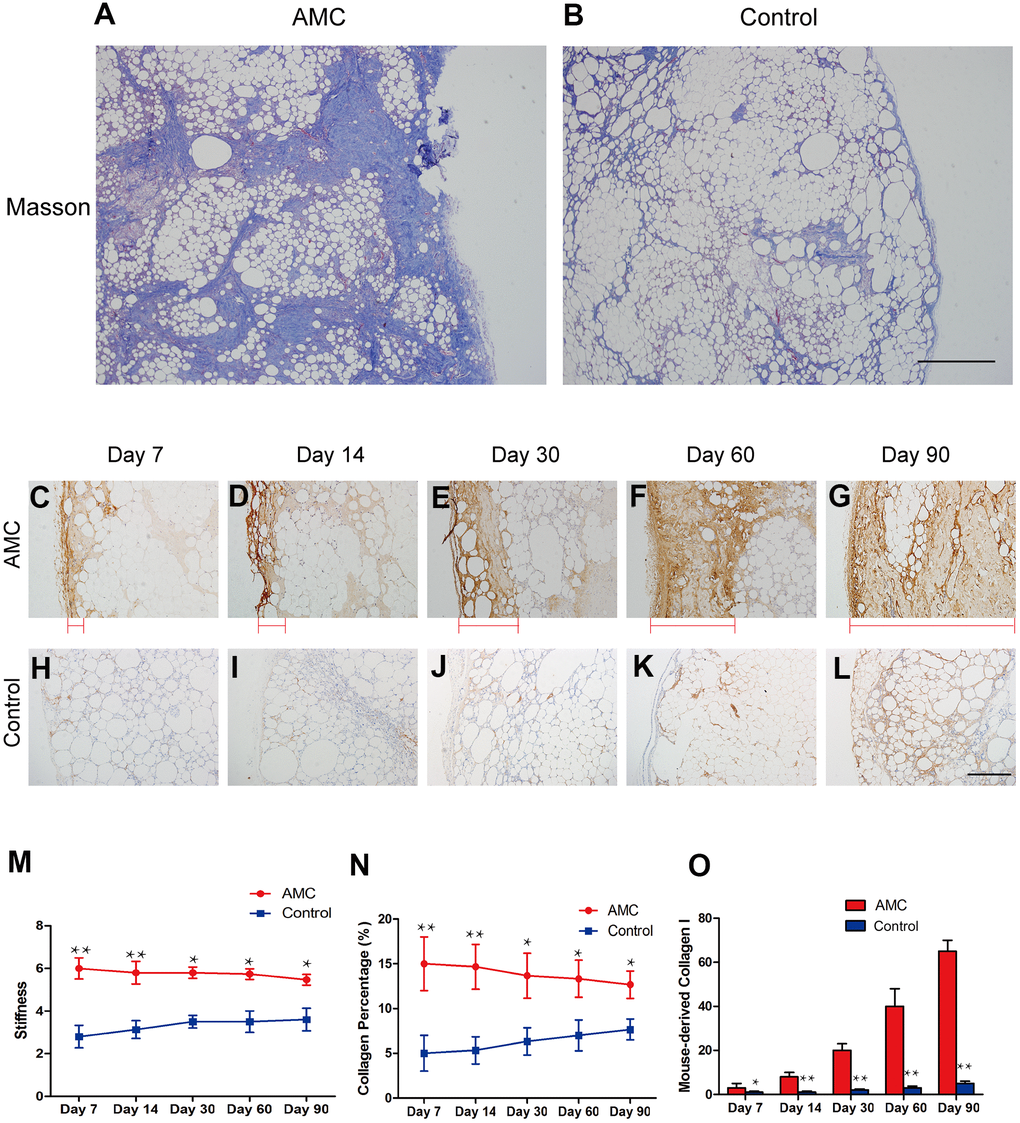
Figure 5. Changes in collagen in AMC and Coleman fat after grafting. (A, B) Masson’s trichrome staining of grafts in AMC and Coleman fat (control) on Day 90 after grafting. (C–L) Immunohistochemical staining of mouse type I collagen in grafts of AMC and Coleman fat (control) on Days 7, 14, 30, 60 and 90. Red line: type I collagen thickness, from the outermost to the innermost of grafts. (M) Stiffness analysis of grafts of AMC and Coleman fat (control) on Days 7, 14, 30, 60, and 90 after grafting. (N) Collagen percentage in grafts of AMC and Coleman fat (control) on Days 7, 14, 30, 60, and 90, calculated by quantification of positive area in Masson stained sections. (O) Quantification of the area positive for mouse collagen I immunohistochemical staining in grafts of AMC and Coleman fat (control) on Days 7, 14, 30, 60 and 90. Results are presented as the mean ± SD (n = 7 per group). * P < 0.05, control vs. AMC; **, control vs. AMC; P < 0.01.
Discussion
In this study, we investigated a new mechanical strategy for optimizing the components of lipoaspirates for rigid support grafting. We used a filtering device consisting of a sleeve and three internal sieves to collect AMC from adipose tissue. The role of the three internal sieves was to prevent collagen tissue from passing through the sleeve, allowing it to be stored. The role of the filter bag (100 mesh) was to dehydrate collagen tissue. We defined the collagen tissue as AMC. The yield of AMC was about 10%. Using our mechanical process, AMC containing high levels of ECM and collagen I could be collected from Coleman fat. Moreover, AMC had sufficient rigid support capacity. This novel strategy for transplantation of AMC can maintain stable rigid support and improve retention rates.
Traditionally, clinicians use a prosthesis or cartilage to solve the problem of insufficient support [18]. However, for prostheses, immune rejection reaction and absorption have always been problems [19], whereas for cartilage, trauma to the donor site and surgical complications are inevitable [20]. Currently, in the field of tissue engineering, implantation of biodegradable scaffolds in conjunction with fat grafts can be used to improve the rigid support capacity of fat grafting. However, this method has been limited largely to animal experiments due to the need for open surgical incisions, as well as the antigenicity of exogenous scaffold materials [21].
By contrast, AMC can be collected from adipose tissue, which has a high retention rate and causes less trauma and complications. Importantly, AMC also provides sufficient rigid support.
The stable stiffness of tissue depends on the ECM percentage [22]. In this study, we found that the ECM percentage of AMC was greater than 45% before grafting, and that stiffness was about 6 kPa; these values were preserved after grafting. Thus, our results suggest that when the percentage of ECM is greater than 45%, the tissue can provide stable stiffness. Indeed, AMC prepared by our mechanical strategy maintained an ECM percentage above 45%.
AMC contained about 45% collagen by volume, which was much higher than that of Coleman fat (10%). Moreover, expression of collagen I, II, III and IV was higher in AMC. Collagen I, which is the most prominent component of ECM molecules distributed throughout the interstitium, constitutes up to 90% of total connective tissue [11]. In addition, we found that collagen I was the major component in ECM. As we describe, collagen I is macromolecular fragment, which fibrillary assemblies could be crowding-enhanced matrix assembly with other type of collagen [16]. Tissue stiffness increases with the level of collagen I [13, 14]. Thus, the stiffness of AMC, which was capable of providing sufficient rigid support, was much higher than that of Coleman fat.
Additionally, we compared the CD31, CD34, CD90, and CD45 cell ratios between AMC and Coleman fat. CD31 is a marker of vascular endothelial cells [23, 24], which are less abundant in AMC, implying that the angiogenesis capability of AMC might be lower than that of Coleman fat. CD34 is a marker of adipose-derived stem cells (ASCs) [25, 26], and CD45 is considered a marker of immune cells [27, 28], which were also less abundant in AMC, implying that the tissue reorganization capability of AMC might also be lower than that of Coleman fat. More interesting were CD90+ cells, a marker of fibroblasts [29, 30], which were less abundant in AMC than in Coleman fat. Collagen is secreted by various cells [31, 32], including fibroblasts, macrophages, and stem cells [33–35], although fibroblasts are the main cells responsible for collagen secretion [36, 37]. Thus, the collagen regeneration capacity should be lower in AMC than Coleman fat. However, we found that mouse collagen I was increased from the outermost to the innermost of the organization. However, the ECM percentage did not differ among time points after grafting. Together, these observations indicate that the collagen retention mechanism in AMC might involve host-derived collagen regeneration.
The collagen regeneration mechanism appeared to differ between AMC and Coleman fat. After grafting, we observed that more cells infiltrated AMC grafts during the early stage, after which the level of mouse collagen increased. This process deserves our attention. In fact, most cells, including stem cells and endothelial cells, actively migrate from a low-stiffness area to a high-stiffness area [38–40]. Thus, after grafting, the higher stiffness of AMC could result in recruitment of more stromal cells [7, 41], which could explain the faster cell infiltration in the early stage after grafting. In addition, a high level of collagen I can stimulate stem cells to secrete more collagen [42, 43]. This process could maintain a high level of collagen I in tissue after grafting. Also, we found that the collagen percent did not differ among time points after grafting. That is to say, AMC could provide sufficient stiffness, and could maintain stable stiffness after grafting, due to the high level of collagen I in the tissue. We plan to investigate the underlying mechanism in future research.
In the clinic, AMC is collected from adipose tissue after liposuction. Indeed, the mechanical strategy had almost no influence to the adipose tissue. After separation of AMC, adipose tissue could be used for filling, allowing even more smooth injection. Further randomized controlled trials will be required to evaluate the clinical use of AMC for chin and alar base filling, and the efficacy of this strategy should be compared with those of conventional methods.
Materials and Methods
Fat harvesting and AMC preparation
Human abdominal lipoaspirates were obtained from eight healthy women with no systemic diseases. Liposuction at -0.75 atm of suction pressure was performed with a 3 mm multiport cannula containing several sharp side holes 1 mm in diameter (Tulip Medical Products, San Diego, CA, USA). The fat passed through a filtering device before being collected. The filter device consisted of a sleeve and three internal sieves (Figure 1A, 1B). After filtering, the sieves were removed and the attached tissue was collected. A filter bag (100 mesh) was used for dehydration (Figure 1C, 1D). The resultant tissue was defined as AMC. Finally, the AMC was cut into pieces to ensure that it could pass through the injection needle. [Supplementary Video 1, which shows the whole process of preparing AMC].
For quantification of collagen volume, AMC and Coleman fat were homogenized at 12,000 rpm for 2 min at room temperature using a tissue crushing homogenizer (JJ-2 FK-A, Puyun International Trade Co., Ltd., Shanghai, China). The tissue suspension was centrifuged at 2300 × g for 5 min and the upper oil layer was discarded. The isolated collagen at the bottom of the tube was collected and measured.
Animals
Animals were cared for in accordance with our institutional guidelines. Seventy nude mice of Health SPF level (provided by the experimental animal center, Nanfang Medical University), weighing 15–18 g at age 4–6 weeks (irrespective of sex), were housed in individual cages with a 12 hr light/dark cycle, Animals were provided with standard food and water ad libitum.
Animal model
Mice were anesthetized by intraperitoneal injection of pentobarbital sodium (50 mg/kg). To prepare for grafting, 0.3 ml of prepared AMC or adipose tissue was injected into subcutaneous tissues; this served as the fat graft baseline for each mouse. On Days 7, 14, 30, 60 or 90 post-grafting, the grafts were harvested, carefully separated from surrounding tissue, and their volumes measured. The retention rate of grafts was defined as follows: retention rate (%)=the graft volume at harvest time/injection fat volume (i.e., 0.3 ml)×100%.
Histological analysis
Samples were fixed in 4% paraformaldehyde, dehydrated, embedded in paraffin, and stained with hematoxylin–eosin and Masson’s trichrome. The samples were then sectioned and examined under an Olympus BX51 microscope. Images were acquired using an Olympus DP71 digital camera.
Scanning electron microscopy
Fractions were fixed with 2% glutaraldehyde and 1% osmium tetroxide for 1 h. Fat was then dehydrated in acetone, sputtered with gold using an MED 010 coater, and examined under an S-3000N scanning electron microscope (SEM) (Hitachi, Ltd., Tokyo, Japan).
Stiffness testing
A BOSE ElectroForce load testing device was used to analyze stiffness. The load cell used to measure forces ranged from 0 N to 225 N. The device's electromagnetic actuator allows axial travel of 6 mm. Therefore, a preload was applied to remove slack from tissues and induce elongation. Each tissue sample was clamped, and then a preload (25–30 N) was applied followed by ramp loading. The preload was selected based on preliminary testing. The ramp loading was set to 8 mm/s, and samples were expected to rupture during the application of this loading. The highest force achieved before the sutures tore was electronically recorded for each sample. Finally, the device calculated the tissue stiffness.
Immunohistochemistry and immunofluorescence
Full-thickness biopsies of the grafts were obtained before and after grafting. Tissue sections were incubated overnight at 4° C with the primary antibody (rabbit anti-mouse type I collagen; 1:200; Sigma) [44]. Tissue sections were washed three times with PBS and then incubated at 37° C for 1 h with biotin-labeled rat anti-rabbit IgG (1:200; Invitrogen) [45]. Signals were observed using the avidin–biotin–horseradish peroxidase detection system. Slides were examined under an Olympus BX51 microscope.
Immunofluorescence staining was performed at 4° C overnight with guinea pig anti-mouse perilipin (1:400; Progen, Heidelberg, Germany) [46]. Tissue sections were washed three times with PBS and then incubated at 37° C for 1 h with rhodamine-conjugated goat anti-guinea pig Alexa Fluor 647 IgG (Abcam, Cambridge, MA, USA) [45]. Nuclei were stained with DAPI (1:200; Sigma). Images were acquired and analyzed under a C1Si confocal laser scanning microscope (Nikon, Tokyo, Japan).
Western blotting
Total cell lysates were prepared using M-PER Mammalian Protein Extraction Reagent (Thermo Fisher Scientific, Waltham, MA, USA). A BCA protein assay (Thermo Fisher Scientific) was used to estimate the concentration of the protein.
After separation by SDS-PAGE on a NuPAGE electrophoresis system, protein extracts were transferred to immobilon poly-vinylidene difluoride membranes (Millipore, Billerica, MA, USA). Membranes were blocked in 5% milk and immunoblotted with the following primary antibodies: anti-Col I (1:1000; Cell Signaling Technology, Danvers, MA, USA), anti-Col II (1:1000; Cell Signaling Technology), anti-Col III (1:1000; Cell Signaling Technology), and anti-Col IV (1:1000; Cell Signaling Technology). Subsequently, membranes were incubated with the appropriate secondary antibodies. The WesternBreeze Chemiluminescent Detection Kit (ThermoFisher Scientific) was used to detect signals. GAPDH served as an internal control.
Flow cytometry
Cells were isolated from AMC and Coleman fat at the indicated time points. Briefly, the fat was digested (30 minutes on a shaker at 37° C) in PBS containing 0.075% collagenase. Mature adipocytes and connective tissue were removed by centrifugation at 800 × g for 5 minutes. The cell pellets were resuspended and filtered through a 100 μm mesh and a 70 μm mesh. Total cells were then counted. Then, the cells were stimulated for 4 h with 20 ng/ml phorbol myristate acetate (Sigma-Aldrich) and 1 μg/ml ionomycin (Sigma-Aldrich) prior to addition of 10 μg/ml brefeldin A (BFA) (eBiosciences). For the detection of surface markers, cells were stained with CD31 (eBiosciences), CD34 (eBiosciences), CD90 (eBiosciences), and CD45 (eBiosciences) and then incubated for 15 min at 4° C in the dark. After washing, cells were fixed and permeabilized using fixation buffer and permeabilization buffer (BD Biosciences). Acquisition was performed on a Coulter Epics-XL flow cytometer using the System II software (Coulter Corporation, Brea, CA, USA). Data analysis was performed using FCS express software (De Novo Software, Los Angeles, CA, USA).
Statistical analysis
Mice were grouped according to random numbers generated using SAS 9.4 software (SAS Institute, Inc., Cary, NC, USA). All data were analyzed with IBM SPSS Version 20.0 software (IBM Corp., Armonk, NY, USA). Results are presented as the mean ± standard deviation. Comparisons between multiple time points were assessed by two-way analysis of variance. Comparisons between two groups at a single time point were assessed using an independent Student’s t-test. A two-tailed p-value > 0.05 was considered statistically significant.
Supplementary Materials
Author Contributions
Ye Li, Pan Zhang and Xue Zhang: Investigation, Methodology, Writing-Original draft preparation. Xin Bi and Mengfan Wu: Conceptualization, Data curation. Jialiang Zou and Zijue Wang: Visualization, Software, Supervision. Feng Lu, Jianhua Gao and Ziqing Dong: Writing-Reviewing and Editing.
Conflicts of Interest
The authors have no financial interest to declare in relation to the products, devices, or drugs mentioned in this article.
Funding
This work was supported by the National Nature Science Foundation of China (81601702, 81671931, 81772101, 81701920, 81801933, 81801932, 81871573, 81901976, 81901975, 81971852). Postdoctoral Science Foundation of China (2020M672723). Medical Scientific Research Foundation of Guangdong Province of China (A2020542). Administrator Foundation of Nanfang Hospital (2019B021). National undergraduate innovation and entrepreneurship training program (X202012121222, X202012121312).
References
- 1. Shridharani SM, Tufaro AP. A systematic review of acelluar dermal matrices in head and neck reconstruction. Plast Reconstr Surg. 2012 (Suppl 2); 130:35S–43S. https://doi.org/10.1097/PRS.0b013e31825eff7a [PubMed]
- 2. Tanna N, Wan DC, Kawamoto HK, Bradley JP. Craniofacial microsomia soft-tissue reconstruction comparison: inframammary extended circumflex scapular flap versus serial fat grafting. Plast Reconstr Surg. 2011; 127:802–11. https://doi.org/10.1097/PRS.0b013e3181fed6e4 [PubMed]
- 3. Strong AL, Cederna PS, Rubin JP, Coleman SR, Levi B. The Current State of Fat Grafting: A Review of Harvesting, Processing, and Injection Techniques. Plast Reconstr Surg. 2015; 136:897–912. https://doi.org/10.1097/PRS.0000000000001590 [PubMed]
- 4. Kaufman MR, Miller TA, Huang C, Roostaien J, Wasson KL, Ashley RK, Bradley JP. Autologous fat transfer for facial recontouring: is there science behind the art? Plast Reconstr Surg. 2007; 119:2287–96. https://doi.org/10.1097/01.prs.0000260712.44089.e7 [PubMed]
- 5. Monreal J. Fat grafting to the nose: personal experience with 36 patients. Aesthetic Plast Surg. 2011; 35:916–22. https://doi.org/10.1007/s00266-011-9681-4 [PubMed]
- 6. Kridel RW, Patel S. Cheek and Chin Implants to Enhance Facelift Results. Facial Plast Surg. 2017; 33:279–84. https://doi.org/10.1055/s-0037-1598055 [PubMed]
- 7. Li Y, Wu M, Zhang Z, Xia J, Wang Z, Chen X, Xiao X, Lu F, Dong Z. Application of External Force Regulates the Migration and Differentiation of Adipose-Derived Stem/Progenitor Cells by Altering Tissue Stiffness. Tissue Eng Part A. 2019; 25:1614–22. https://doi.org/10.1089/ten.TEA.2019.0046 [PubMed]
- 8. Seyfi B, Fatouraee N, Samani A. A novel micro-to-macro structural approach for mechanical characterization of adipose tissue extracellular matrix. J Mech Behav Biomed Mater. 2018; 77:140–47. https://doi.org/10.1016/j.jmbbm.2017.09.006 [PubMed]
- 9. Kubota H, Nagata K. Roles of collagen fibers and its specific molecular chaperone: analysis using HSP47-knockout mice. Biol Sci Space. 2004; 18:118–19. [PubMed]
- 10. Teng F, Kawalec M, Weinstock GM, Hryniewicz W, Murray BE. An Enterococcus faecium secreted antigen, SagA, exhibits broad-spectrum binding to extracellular matrix proteins and appears essential for E. faecium growth. Infect Immun. 2003; 71:5033–41. https://doi.org/10.1128/iai.71.9.5033-5041.2003 [PubMed]
- 11. Chun SY, Lim JO, Lee EH, Han MH, Ha YS, Lee JN, Kim BS, Park MJ, Yeo M, Jung B, Kwon TG. Preparation and Characterization of Human Adipose Tissue-Derived Extracellular Matrix, Growth Factors, and Stem Cells: A Concise Review. Tissue Eng Regen Med. 2019; 16:385–93. https://doi.org/10.1007/s13770-019-00199-7 [PubMed]
- 12. Cleveland EC, Albano NJ, Hazen A. Roll, Spin, Wash, or Filter? Processing of Lipoaspirate for Autologous Fat Grafting: An Updated, Evidence-Based Review of the Literature. Plast Reconstr Surg. 2015; 136:706–13. https://doi.org/10.1097/PRS.0000000000001581 [PubMed]
- 13. Latinovic O, Hough LA, Daniel Ou-Yang H. Structural and micromechanical characterization of type I collagen gels. J Biomech. 2010; 43:500–05. https://doi.org/10.1016/j.jbiomech.2009.09.041 [PubMed]
- 14. Kisling A, Lust RM, Katwa LC. What is the role of peptide fragments of collagen I and IV in health and disease? Life Sci. 2019; 228:30–34. https://doi.org/10.1016/j.lfs.2019.04.042 [PubMed]
- 15. Islam A, Mbimba T, Younesi M, Akkus O. Effects of substrate stiffness on the tenoinduction of human mesenchymal stem cells. Acta Biomater. 2017; 58:244–53. https://doi.org/10.1016/j.actbio.2017.05.058 [PubMed]
- 16. Chiquet M, Birk DE, Bönnemann CG, Koch M. Collagen XII: Protecting bone and muscle integrity by organizing collagen fibrils. Int J Biochem Cell Biol. 2014; 53:51–54. https://doi.org/10.1016/j.biocel.2014.04.020 [PubMed]
- 17. Holmes DF, Lu Y, Starborg T, Kadler KE. Collagen Fibril Assembly and Function. Curr Top Dev Biol. 2018; 130:107–42. https://doi.org/10.1016/bs.ctdb.2018.02.004 [PubMed]
- 18. Genther DJ, Papel ID. Surgical Nasal Implants: Indications and Risks. Facial Plast Surg. 2016; 32:488–99. https://doi.org/10.1055/s-0036-1592101 [PubMed]
- 19. Kim IS. Augmentation Rhinoplasty Using Silicone Implants. Facial Plast Surg Clin North Am. 2018; 26:285–93. https://doi.org/10.1016/j.fsc.2018.03.003 [PubMed]
- 20. Wee JH, Park MH, Oh S, Jin HR. Complications associated with autologous rib cartilage use in rhinoplasty: a meta-analysis. JAMA Facial Plast Surg. 2015; 17:49–55. https://doi.org/10.1001/jamafacial.2014.914 [PubMed]
- 21. Chhaya MP, Balmayor ER, Hutmacher DW, Schantz JT. Transformation of Breast Reconstruction via Additive Biomanufacturing. Sci Rep. 2016; 6:28030. https://doi.org/10.1038/srep28030 [PubMed]
- 22. Basu S, Sutradhar S, Paul R. Substrate stiffness and mechanical stress due to intercellular cooperativity guides tissue structure. J Theor Biol. 2018; 457:124–36. https://doi.org/10.1016/j.jtbi.2018.08.001 [PubMed]
- 23. Park JK, Lee TW, Do EK, Moon HJ, Kim JH. Role of Notch1 in the arterial specification and angiogenic potential of mouse embryonic stem cell-derived endothelial cells. Stem Cell Res Ther. 2018; 9:197. https://doi.org/10.1186/s13287-018-0945-7 [PubMed]
- 24. Zhang YY, Kong LQ, Zhu XD, Cai H, Wang CH, Shi WK, Cao MQ, Li XL, Li KS, Zhang SZ, Chai ZT, Ao JY, Ye BG, Sun HC. CD31 regulates metastasis by inducing epithelial-mesenchymal transition in hepatocellular carcinoma via the ITGB1-FAK-Akt signaling pathway. Cancer Lett. 2018; 429:29–40. https://doi.org/10.1016/j.canlet.2018.05.004 [PubMed]
- 25. Maumus M, Peyrafitte JA, D’Angelo R, Fournier-Wirth C, Bouloumié A, Casteilla L, Sengenès C, Bourin P. Native human adipose stromal cells: localization, morphology and phenotype. Int J Obes (Lond). 2011; 35:1141–53. https://doi.org/10.1038/ijo.2010.269 [PubMed]
- 26. Baer PC. Adipose-derived mesenchymal stromal/stem cells: An update on their phenotype in vivo and in vitro. World J Stem Cells. 2014; 6:256–65. https://doi.org/10.4252/wjsc.v6.i3.256 [PubMed]
- 27. Zimmerman KA, Bentley MR, Lever JM, Li Z, Crossman DK, Song CJ, Liu S, Crowley MR, George JF, Mrug M, Yoder BK. Single-Cell RNA Sequencing Identifies Candidate Renal Resident Macrophage Gene Expression Signatures across Species. J Am Soc Nephrol. 2019; 30:767–81. https://doi.org/10.1681/ASN.2018090931 [PubMed]
- 28. Hermiston ML, Xu Z, Weiss A. CD45: a critical regulator of signaling thresholds in immune cells. Annu Rev Immunol. 2003; 21:107–37. https://doi.org/10.1146/annurev.immunol.21.120601.140946 [PubMed]
- 29. Ho JD, Chung HJ, Ms Barron A, Ho DA, Sahni D, Browning JL, Bhawan J. Extensive CD34-to-CD90 Fibroblast Transition Defines Regions of Cutaneous Reparative, Hypertrophic, and Keloidal Scarring. Am J Dermatopathol. 2019; 41:16–28. https://doi.org/10.1097/DAD.0000000000001254 [PubMed]
- 30. Kumar A, Bhanja A, Bhattacharyya J, Jaganathan BG. Multiple roles of CD90 in cancer. Tumour Biol. 2016; 37:11611–22. https://doi.org/10.1007/s13277-016-5112-0 [PubMed]
- 31. Kisseleva T, Brenner DA. Mechanisms of fibrogenesis. Exp Biol Med (Maywood). 2008; 233:109–22. https://doi.org/10.3181/0707-MR-190 [PubMed]
- 32. Di Carlo SE, Peduto L. The perivascular origin of pathological fibroblasts. J Clin Invest. 2018; 128:54–63. https://doi.org/10.1172/JCI93558 [PubMed]
- 33. Ucero AC, Bakiri L, Roediger B, Suzuki M, Jimenez M, Mandal P, Braghetta P, Bonaldo P, Paz-Ares L, Fustero-Torre C, Ximenez-Embun P, Hernandez AI, Megias D, Wagner EF. Fra-2-expressing macrophages promote lung fibrosis in mice. J Clin Invest. 2019; 129:3293–309. https://doi.org/10.1172/JCI125366 [PubMed]
- 34. Meng XM, Wang S, Huang XR, Yang C, Xiao J, Zhang Y, To KF, Nikolic-Paterson DJ, Lan HY. Inflammatory macrophages can transdifferentiate into myofibroblasts during renal fibrosis. Cell Death Dis. 2016; 7:e2495. https://doi.org/10.1038/cddis.2016.402 [PubMed]
- 35. Shirai K, Obara K, Tohgi N, Yamazaki A, Aki R, Hamada Y, Arakawa N, Singh SR, Hoffman RM, Amoh Y. Expression of anti-aging type-XVII collagen (COL17A1/BP180) in hair follicle-associated pluripotent (HAP) stem cells during differentiation. Tissue Cell. 2019; 59:33–38. https://doi.org/10.1016/j.tice.2019.06.001 [PubMed]
- 36. Baranyi U, Winter B, Gugerell A, Hegedus B, Brostjan C, Laufer G, Messner B. Primary Human Fibroblasts in Culture Switch to a Myofibroblast-Like Phenotype Independently of TGF Beta. Cells. 2019; 8:721. https://doi.org/10.3390/cells8070721 [PubMed]
- 37. Sanchez A, Blanco M, Correa B, Perez-Martin RI, Sotelo CG. Effect of Fish Collagen Hydrolysates on Type I Collagen mRNA Levels of Human Dermal Fibroblast Culture. Mar Drugs. 2018; 16:144. https://doi.org/10.3390/md16050144 [PubMed]
- 38. Hadjipanayi E, Mudera V, Brown RA. Guiding cell migration in 3D: a collagen matrix with graded directional stiffness. Cell Motil Cytoskeleton. 2009; 66:121–28. https://doi.org/10.1002/cm.20331 [PubMed]
- 39. Lo CM, Wang HB, Dembo M, Wang YL. Cell movement is guided by the rigidity of the substrate. Biophys J. 2000; 79:144–52. https://doi.org/10.1016/S0006-3495(00)76279-5 [PubMed]
- 40. Allioux-Guérin M, Icard-Arcizet D, Durieux C, Hénon S, Gallet F, Mevel JC, Masse MJ, Tramier M, Coppey-Moisan M. Spatiotemporal analysis of cell response to a rigidity gradient: a quantitative study using multiple optical tweezers. Biophys J. 2009; 96:238–47. https://doi.org/10.1529/biophysj.108.134627 [PubMed]
- 41. Vincent LG, Choi YS, Alonso-Latorre B, del Álamo JC, Engler AJ. Mesenchymal stem cell durotaxis depends on substrate stiffness gradient strength. Biotechnol J. 2013; 8:472–84. https://doi.org/10.1002/biot.201200205 [PubMed]
- 42. Juncosa-Melvin N, Matlin KS, Holdcraft RW, Nirmalanandhan VS, Butler DL. Mechanical stimulation increases collagen type I and collagen type III gene expression of stem cell-collagen sponge constructs for patellar tendon repair. Tissue Eng. 2007; 13:1219–26. https://doi.org/10.1089/ten.2006.0339 [PubMed]
- 43. Xia H, Liang C, Luo P, Huang J, He J, Wang Z, Cao X, Peng C, Wu S. Pericellular collagen I coating for enhanced homing and chondrogenic differentiation of mesenchymal stem cells in direct intra-articular injection. Stem Cell Res Ther. 2018; 9:174. https://doi.org/10.1186/s13287-018-0916-z [PubMed]
- 44. Langen UH, Pitulescu ME, Kim JM, Enriquez-Gasca R, Sivaraj KK, Kusumbe AP, Singh A, Di Russo J, Bixel MG, Zhou B, Sorokin L, Vaquerizas JM, Adams RH. Cell-matrix signals specify bone endothelial cells during developmental osteogenesis. Nat Cell Biol. 2017; 19:189–201. https://doi.org/10.1038/ncb3476 [PubMed]
- 45. Shekhawat G, Tark SH, Dravid VP. MOSFET-Embedded microcantilevers for measuring deflection in biomolecular sensors. Science. 2006; 311:1592–95. https://doi.org/10.1126/science.1122588 [PubMed]
- 46. Cai J, Feng J, Liu K, Zhou S, Lu F. Early Macrophage Infiltration Improves Fat Graft Survival by Inducing Angiogenesis and Hematopoietic Stem Cell Recruitment. Plast Reconstr Surg. 2018; 141:376–86. https://doi.org/10.1097/PRS.0000000000004028 [PubMed]