


Introduction
The stringent cell growth arrest associated with cellular senescence is determined, among other mechanisms, by activities of cyclin-dependent kinase inhibitor proteins p16Ink4a and p21Cip1/Waf1, encoded by the Cdkn2a and Cdkn1a loci, respectively [1]. The increased expression of these proteins is a major hallmark of senescence in most cells, and therefore have become markers of senescence both in culture and in vivo. Consistent with the fact that senescent cells increase with age in many mouse and human tissues, Cdkn2a (p16Ink4a) mRNA levels also increase with age in these tissues [2]. Based on this association, transgenic mice have been generated to detect [3] and selectively eliminate senescent cells in vivo [4, 5]. By contrast, despite having a key role in the senescence growth arrest, Cdkn1a/p21Cip1/Waf1 upregulation during aging is often moderate or absent in vivo, and tissue-dependent [2, 6–8]. For example, p21Cip1/Waf1 reporter mouse have shown increased reporter activity only in kidneys of 23.5 month-old mice [9]. Further, in most tissues, calorie restriction does not prevent the age-related increase in Cdkn1a expression, in contrast to Cdkn2a expression [7]. Consequently, the role of Cdkn1a/p21Cip1/Waf1 as an in vivo marker of aging or cellular senescence remains uncertain.
Two transcript variants are currently annotated for the murine Cdkn1a gene (Figure 1A). The better-studied mRNA (Cdkn1a transcript variant 1, NM_007669.5, hereafter termed p21var1) contains three exons, the two latter of which encode the p21Cip1/Waf1 protein. An alternative transcript (Cdkn1a transcript variant 2, NM_001111099.2, hereafter termed p21var2) differs from p21var1 in the first exon and therefore contains an almost entirely different 5’ untranslated region (UTR), despite encoding the same protein [10]. Additionally, the p21var2 transcription start site (TSS) lies ~2.8 kb upstream of p21var1, and thus might be subject to regulation by elements not present in p21var1. Interestingly, the p21var2 is generally less abundant than p21var1, but the translation of the p21var2 transcript increases under nutrient stress; consequently, the relative contribution of each variant to the total pool of p21Cip1/Waf1 protein likely varies depending on stress and possibly other conditions [11]. To date, possible changes in the expression of Cdkn1a transcript-specific variants during age or cellular senescence have not been explored.
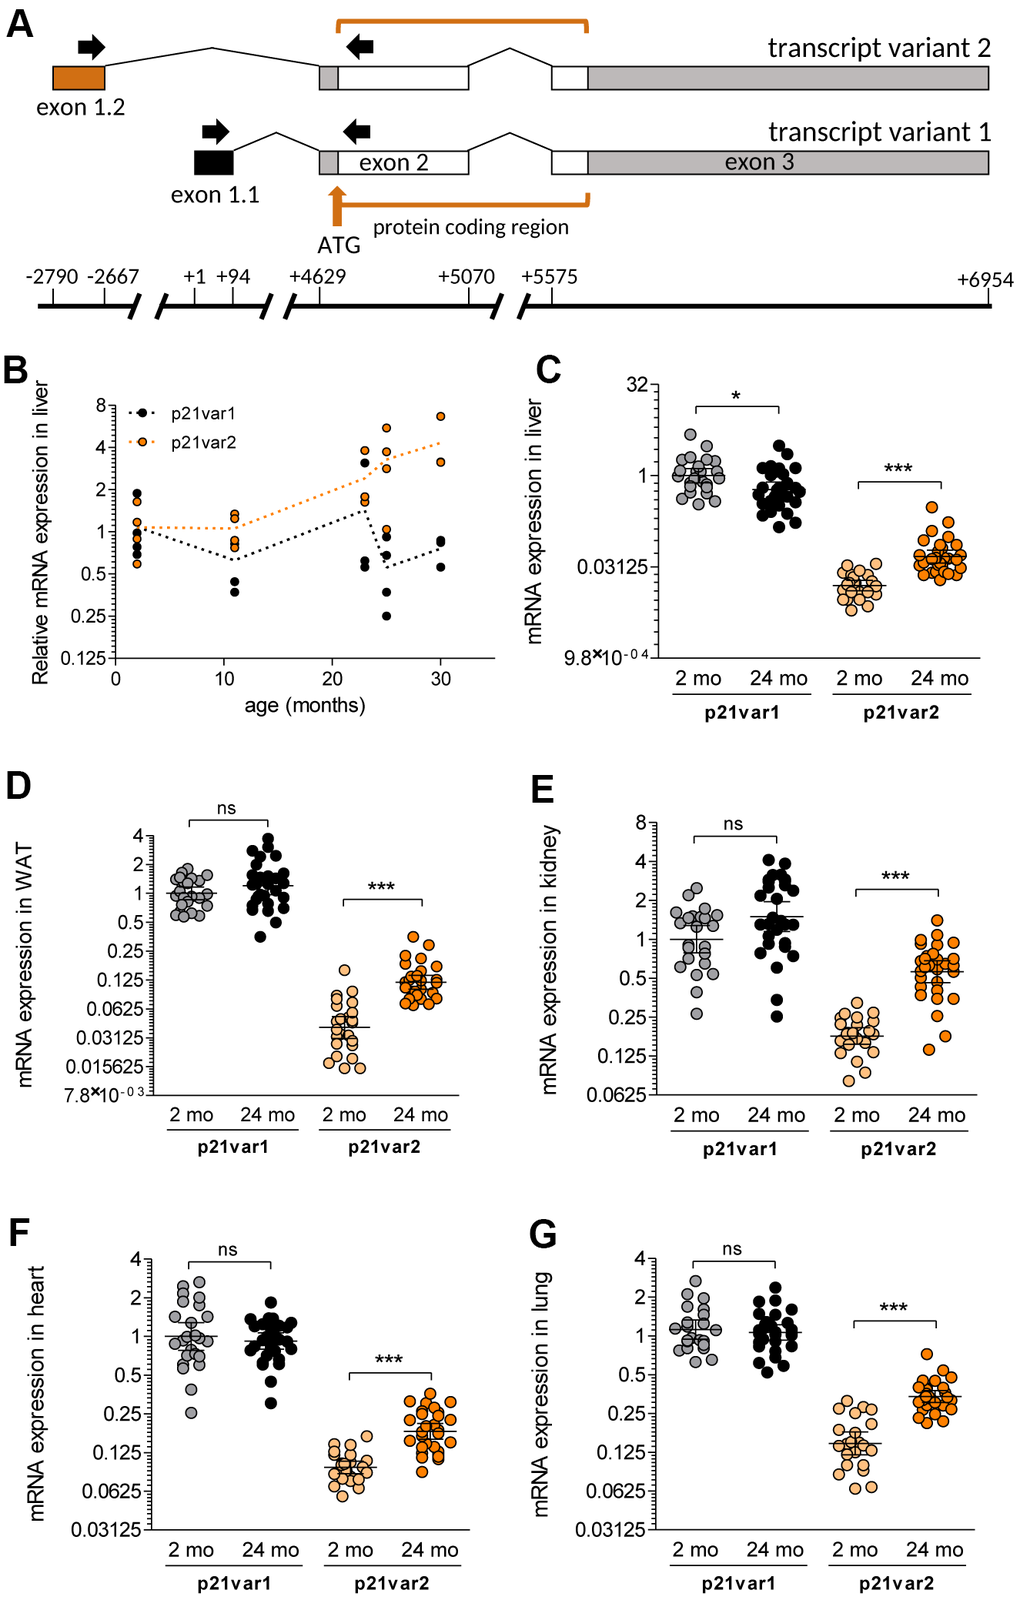
Figure 1. The Cdkn1a variant 2 transcript is preferentially induced during aging. (A) We designed primers (black arrows) to specifically detect Cdkn1a variant 1 and 2 transcripts, spanning the first and second exons in each case. The protein-coding region is indicated as well as the ATG start codon (brown arrow). Transcription starts at +1 for p21var1 and at -2790 for p21var2. The first and last bases of each exon are also indicated. (B) mRNA levels of p21var1 and p21var2 in the livers of male mice aged 2 to 30 months of age, normalized to levels in livers of 2 month-old animals. (C–G) Levels of each Cdkn1a transcript were assessed in 2 (young) and 24 (old) month-old mice. Animals were young males (n = 12), young females (n = 12), old males (n =14-15) and old females (n = 14-15). Results are shown for (C) liver, (D) adipose tissue, (E) kidney, (F) heart and (G) lung. In (C–G) data were normalized to p21var1 levels in young mice. Note Y axes are log-2 scales. 1-way ANOVA and Tukey post-tests were applied. * p < 0.05, ** p < 0.01, *** p < 0.001, ns = not-significant.
To fill this gap in our knowledge, we explored the expression levels of each Cdkn1a transcript variant in several tissues from aged mice. We also analyze their expression levels in a cell culture model of mouse cells subjected to genotoxic stress-induced senescence to evaluate their relative utility as senescence markers both in culture and in vivo. Finally, we show that well-established regulators of Cdkn1a expression have variant-specific effects, which add a novel level of complexity to the biological roles of p21Cip1/Waf1.
Results
Cdkn1a transcript variant 2 is preferentially induced with age
To assess expression levels of the individual Ckdn1a mRNA transcript variants, we designed two primer sets in which the forward primers hybridize with the variant-specific first exons (Figure 1A). To determine whether differential regulation occurs during aging in vivo, we analyzed liver samples from male mice at 2, 11, 23, 25 and 30 months of age. Relative to 2 month-old mice, p21var2, but not p21var1, increased after 20 months of age (Figure 1B). We then obtained additional tissues from 2 and 24 month-old male and female animals (n = 12-15 per sex and age). p21var2 levels were higher than p21var1 levels in aged liver, white adipose tissue, kidney, heart and lung (Figure 1C–1G). Steady-state levels of p21var1 remained unaltered with age, and were even slightly reduced with age in liver. On average, p21var2 abundance increased 3-fold with age in liver, kidney and adipose tissue, and 2-fold in heart and lung. Mice at 4 months of age used as young control yielded equivalent results (data not shown). The transcript encoding p16Ink4a also increased with age in all these tissues (Supplementary Figure 1A–1E).
When males and females were analyzed separately, p21var2 increased with age in all tissues and in both sexes (Supplementary Figure 2A–2J), with the only exception of heart in male mice, where the upwards trend did not reach statistical significance (Supplementary Figure 2D). Of note, we detected higher p21var1 levels in the kidney of aged females (Supplementary Figure 2H). Despite the propensity of p21var2 to increase with age, overall, in all organs tested, p21var1 was more abundant than p21var2, as reported [10]. In sum, p21var2 expression is consistently elevated with age, in contrast with an absence of age-related change in p21var1 levels.
Both Cdnk1a transcript variants are induced in cellular senescence
To determine whether either transcript variant is preferentially upregulated in senescent cells, we induced senescence in primary mouse dermal fibroblasts (MDFs) using 15 GY ionizing radiation (IR), which induces a senescence response in virtually all the irradiated cells. Seven days later, irradiated, but not sham-irradiated, MDFs showed hallmarks of senescence, including increased levels of the mRNA encoding p16Ink4a and lower levels of the mRNA encoding lamin-B1, as expected [12] (Supplementary Figure 3A–3B). The levels of both p21var1 and p21var2 also increased. However, as reported [10], p21var2 levels were 6- to 8-fold lower compared to p21var1 (data not shown). These data show that both of the murine Ckdn1a transcript variants are valid readouts to evaluate cellular senescence in cultured MDFs.
We then tested the dynamics of Cdkn1a variant expression in MDFs after irradiation. Expression of p21var1 increased 3 hours after irradiation, then progressively declined to a level twice that of baseline by 12 hours after irradiation. In contrast, p21var2 levels remained unaltered for the first 24 hours after irradiation (Figure 2A). Thereafter, both Cdkn1a variants steadily increased from day 3, without reaching a plateau by the end of the 12-day time course. Establishment of senescence was verified by increased p16Ink4a and decreased lamin B1 mRNA levels (Figure 2B). Treatment of MDFs with 250 nM doxorubicin (doxo), a chemotherapeutic agent known to cause cellular senescence in culture and in vivo [13], increased p21var1 levels within the 24 hours, followed by a smaller increase in p21var2 levels (Figure 2C). Similar to the pattern in irradiated cells, from day 5 onwards both variants were coordinately and increasingly upregulated, concomitant with senescence-associated changes in p16Ink4a and lamin B1 expression (Figure 2D). Together, our results show that p21var1 increases preferentially shortly after acute genotoxic stress, but both variants gradually rise as cells enter a senescent state.
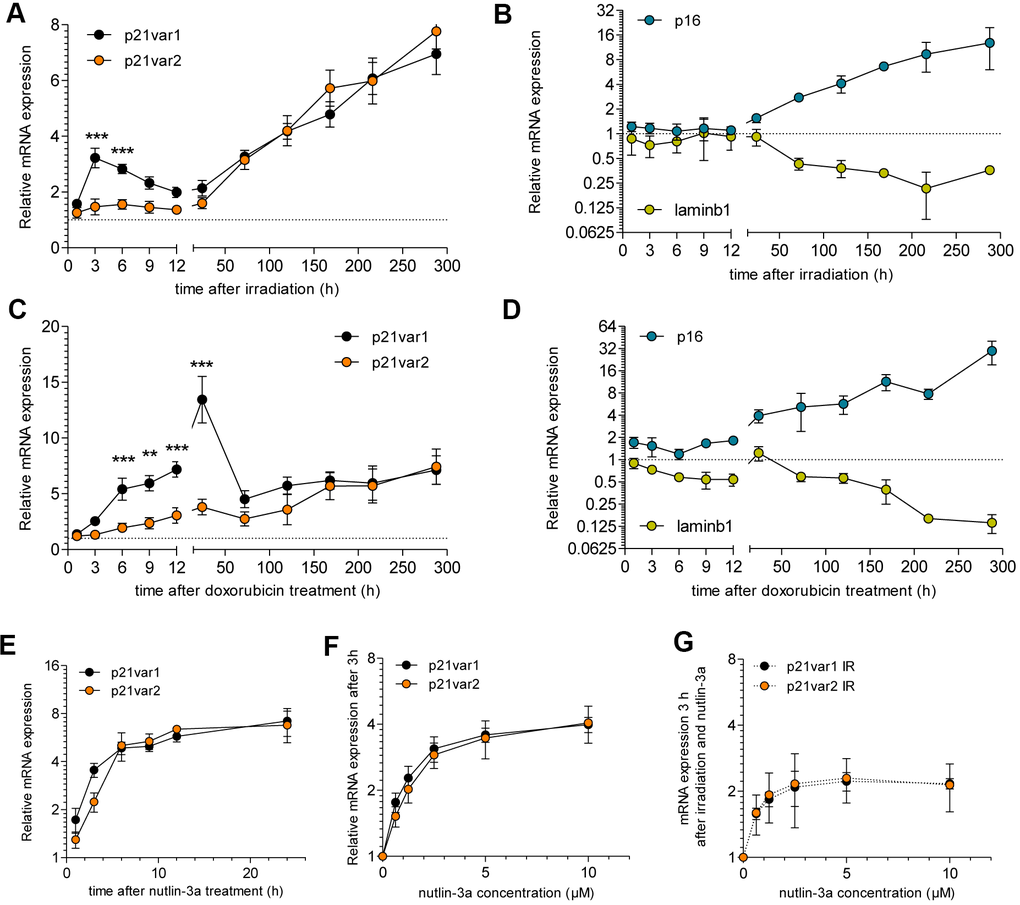
Figure 2. Cdkn1a variant 2 increases as cells acquire senescent phenotypes in culture. Time course of (A) p21var1 and p21var2 levels and (B) p16Ink4a and lamin B1 mRNA levels after 15 Gy irradiation. 2-way ANOVA test was applied. Time course of (C) p21var1 and p21var2 levels and (D) p16Ink4a and lamin B1 levels after a 24 h exposure to 250 nM doxorubicin. 2-way ANOVA test was applied. (E) p21var1 and p21var2 levels in MDFs after treatment with 10 μM nutlin-3a. (F) mRNA levels 3 hours after treatment with increasing doses of nutlin-3a. (G) mRNA levels 3 hours after irradiation (15 Gy) and treatment with increasing doses of nutlin-3a. Mean ± SEM is shown. Note Y axes are log-2 scales. * p < 0.05, ** p < 0.01, *** p < 0.001.
p53 stabilization upregulates both Cdkn1a transcript variants
The basal expression of p21var1 and p21var2 is differentially regulated by p53, likely due to the proximity of the p21var2 transcription start site (TSS) to a p53-response elements (p53-Res) [10]. We performed a promoter analysis (TRANSFAC version 2018.3) for both Cdkn1a TSSs, spanning 2.5 kb upstream and 0.5 kb downstream of each TSS (Supplementary Information). Among a plethora of predicted transcription factor binding sites, p53-REs were detected within 500 bases upstream of both TSSs, even when we applied the most stringent algorithm. To understand the p53 responsiveness of the Cdkn1a transcript variants, we treated MDFs with 10 μM nutlin-3a, an MDM-2 inhibitor that stabilizes p53 [14]. The levels of both variants increased within 1 hour, reaching a plateau approximately 12 hours later (Figure 2E). Lower concentrations of nutlin-3a failed to reveal any sensitivity differences between the variants. Three hours after treatment, the dose-response curves were similar in shape for both Cdkn1a transcripts (Figure 2F). The same was true for senescent (irradiated) MDFs treated with 10 μM nutlin-3a (Figure 2G). These results suggest that p21var1 and p21var2 are equally sensitive to transcriptional upregulation upon p53 stabilization.
Circadian regulation of p21Cip1/Waf1 does not involve transcript variant 2
To further explore the expression pattern of p21var2 in vivo, we asked whether it is subject to circadian regulation, as described for p21Cip1/Waf1 [15]. We euthanized 2 month-old male mice at 3 hour intervals for 12 hours. In liver samples, p21var1 mRNA levels were highest at the end of the dark cycle (6:00 am Pacific time) and progressively decreased 8-fold to a minimum in the afternoon (Figure 3A). The p21var2 remained unaltered, at lower levels, throughout the same period. A similar pattern was observed in adipose and kidney tissue (Figure 3B, 3C). These results indicate that the circadian regulation of p21Cip1/Waf1 is driven solely by expression of Cdkn1a transcript variant 1.
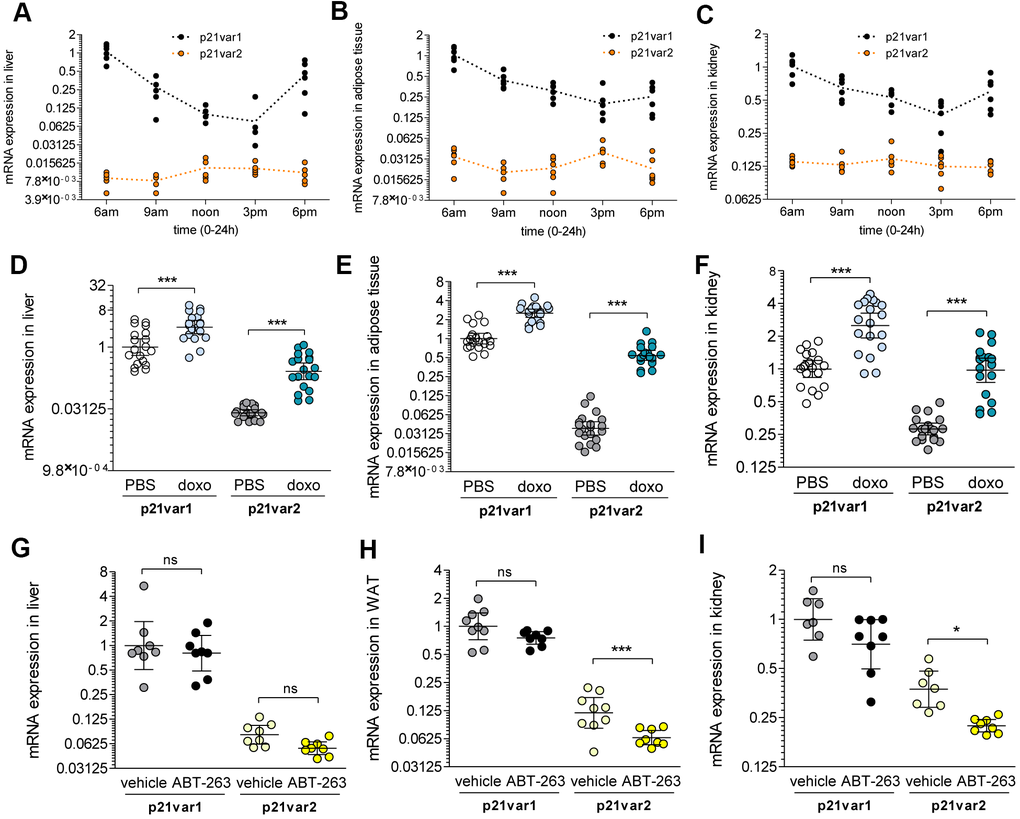
Figure 3. Cdkn1a variant 1 is circadian regulated, whereas variant 2 rises with senescence in vivo. (A) Cdkn1a variants expression throughout the light cycle (6 am to 6 pm) in the liver, (B) white adipose tissue and (C) kidney of 6 week-old male mice. (D–F) A cohort of 6 week-old mice were treated with doxorubicin or vehicle (n = 9-10 for either males or females, n = 9-10 for either vehicle or doxorubicin) and Cdkn1a variant levels were analyzed 6 weeks later. Results are shown for (D) liver, (E) adipose tissue and (F) kidney. (G–I) A cohort of 18 to 22 month-old mice were treated with ABT-263 or vehicle. Pooled results are shown for (G) liver, (H) adipose tissue and (I) kidney. 1-way ANOVA and Tukey post-tests were applied. * p < 0.05, ** p < 0.01, *** p < 0.001, ns = not significant.
Expression of p21var2 in vivo is increased by doxorubicin and decreased by ABT-263
To determine how Cdkn1a transcript variants are expressed when cellular senescence is induced in vivo, we induced cellular senescence in vivo by intraperitoneal injection of a single dose (10 mg/kg) of doxorubicin. After 6 weeks, p21var1 increased 3-fold while p21var2 increased 25-fold (reaching levels comparable to those of p21var1 at baseline) in the livers of treated mice (Figure 3D and Supplementary Figure 4A, 4B). Similar elevations were observed in the adipose tissue and kidneys (Figure 3E, 3F and Supplementary Figure 4C–4F) of male and female mice, consistent with the widespread luminescence reported in doxorubicin-treated p21-reporter mice [9]. Our data suggest that p21var2 is a more sensitive readout for doxorubicin-induced senescence in vivo than p21var1.
ABT-263 (navitoclax) has been shown to clear senescent cells by inhibiting Bcl-2 and related anti-apoptotic proteins [16, 17]. In a mixed cohort of 20-22 month-old male and female mice, ABT-263 specifically reduced p21var2 levels in adipose tissue and kidney, whereas p21var1 levels remained unaltered (Figure 3H–3L). There were no significant changes in the levels of either variant in liver (Figure 3G). Together, these results reinforce the idea p21var2 is a better marker than p21var1 for assessing the presence of senescent cells in vivo.
Discussion
Cdkn1a transcript variant 2 has received little attention since it was first described, likely because the encoded protein is identical to that encoded by variant 1, and both variants are regulated by p53. Our results are, to our knowledge, the first to study Ckdn1a transcript variants in the context of aging. We show that, although tissue-specific exceptions may arise, p21var2 but not p21var1 is a better candidate marker of aging and senescence in mice.
Our findings help explain previous reports regarding changes in p21Cip1/Waf1 with age. Thus, given the architecture of the promoters for both transcript variants, a p21Cip1/Waf1 reporter mouse that included 2.5 kb of the Cdkn1a upstream sequence [9] would not detect p21var2, unlike a reporter mouse containing 4.5 kb of Cdkn1a upstream sequences [18] or a knock-in p21FLuc reporter mouse [19]. In line with our data, the reporter mouse containing 2.5 kb of the Cdkn1a promoter did not detect an age-related increase in expression, except for the kidney, in which we also observed an increase in p21var1 levels in old females. Our findings clarify the interpretation of previous and future results on the age-related changes in expression of this locus.
Key to understanding the biological context of Cdkn1a transcriptional regulation is the different circadian expression pattern between both transcript variants. Thus, comparisons among previous studies may be confounded by an absence of data regarding the time of euthanasia, a limitation that could be, in principle, avoided by measuring p21var2. In the liver, the wide circadian oscillation of p21var1 contrasts with the more subtle age-related changes in p21var2. This disconnect suggests that p21var1 would be, in accordance to its higher relative contribution to the Cdkn1a mRNA pool, the main source of p21Cip1/Waf1 for homeostatic functions [9], whereas p21var2 could be more selectively responsive to stress signals and ultimately more reflective of cellular senescence in vivo.
Our data do not explain why an increase in p21var2, but not p21var1, which is also observed in cultured senescent cells, is detected in aged animals. One possibility is that some transcriptional modulators are evident in vivo, but not necessarily in cultured cells. In addition, there may be cell type-specific expression of Cdkn1a variants in senescent cells. Our data show that p53 stabilization cannot explain the expression dynamics of Cdkn1a variants upon genotoxic-stress. However, the differences between the variant promoters, of which our analysis provides only an initial hint, may well affect which variant is expressed under different circumstances.
A recent report describes how the dynamics of p21Cip1/Waf1 levels in response to DNA damage determine whether cancer cells enter a permanent cell cycle arrest or return to proliferation [20]. It remains unexplored the possibility that the different transcript variants are preferentially associated with one or other cell fate. Additionally, translational regulation at the 5’ UTR of the variants has been shown to affect cell fate [11, 21]. Human cells also express several Cdkn1a transcript variants [22]. Among the ten human transcript variants currently annotated, at least one (transcript variant 4) shares translational regulatory mechanisms with the murine p21var2 [21]. Interestingly, even though murine variant 2 and human variant 4 do not appear to share sequence homology, the translational regulation in both transcripts is driven by the integrated stress response and results in cell cycle arrest [21]. The potential relevance of this mechanism for cellular senescence in humans remains unknown, and the functions and interrelations of the different Cdkn1a transcript variants have not been studied in depth. Our findings may thus lead to a better understanding of the age-related functions of p21 and improve our ability to monitor the effectiveness of anti-aging therapies.
Materials and Methods
Mouse models
Animal husbandry
C56BL/6 mice were purchased from The Jackson Laboratory and allowed to acclimate to the Buck Institute facilities. The animals were group housed under controlled conditions of temperature (22-24° C), humidity (40-60%), and a 12 h light-dark cycle. All animal procedures were approved by the Buck Institute Institutional Animal Care and Use Committee (IACUC).
Aging cohorts
C56BL/6 were aged at the Buck Institute vivarium and male and female littermates derived from the same colony were used as young controls.
Doxorubicin treatment
6-week old male and female C57BL/6 littermates were intraperitoneally (IP) injected with a single dose of doxorubicin (10 mg/kg) to induce widespread senescence [13]. After 6 weeks, the animals were euthanized by CO2 inhalation followed by cervical dislocation, and tissues were harvested and flash frozen in liquid nitrogen.
ABT-263 treatment
ABT-263 or vehicle (5% DMSO, 95% corn oil) was delivered to 20-month old C57BL/6 littermates via IP injection at 50 mg/kg for 7 consecutive days per cycle for two cycles, with a 2-week interval between cycles. Animals were sacrificed one week after the last treatment cycle and tissues were collected and flash frozen in liquid nitrogen.
Cell culture
Mouse dermal fibroblasts
Primary mouse dermal fibroblasts (MDF) were obtained from postnatal day 2-3 C57BL/6 mice. Skin was excised from the mice and incubated overnight in 0.25% trypsin-EDTA. The dermis was mechanically disengaged and incubated with 10 mg/ml collagenase for 30 min at room temperature. The mixture was filtered and plated. MDF were cultured in 3% oxygen in Dulbecco’s modified Eagle’s medium (DMEM) with 10% fetal bovine serum and 100 U/ml streptomycin and penicillin.
Irradiation and doxorubicin treatment
MDFs were induced to senesce by X-irradiation (15 Gy), as described [23], or mock-irradiated (control). Alternatively, MDF were treated with 250 nM doxorubicin or vehicle (DMSO, control) for 24 h, then washed and cultured in fresh complete medium. Senescence markers were tested at different times (1, 3, 6, 9, 12 h and 1, 3, 5, 7, 9, 12 days) after treatment.
Nutlin-3a treatment
MDFs were incubated with 10 μM nutlin-3a or vehicle (DMSO, control) and RNA was collected 1, 3, 6, 9, 12 and 24 h later. MDFs were also treated with different nutlin-3a concentrations (0.6-10 μM), irradiated (15 Gy X-rays) or mock-irradiated and RNA collected 3 h later.
RNA extraction and RT-qPCR
RNA was extracted using Tri-reagent and isolated with the Direct-Zol RNA miniprep kit (Genesee Scientific). For adipose tissue, the RNeasy Lipid Tissue mini kit (Qiagen) was used. cDNA was synthesized using the High Capacity cDNA RT kit (Life Technologies). Transcripts were analyzed using a Roche LightCycler 480 II in 384-well plates and the UPL probe system. Bioline SensiFast Probe No-ROX was used as a master mix. Primer sequences and respective probes were as follows: Cdkn2a (p16), forward 5’-TCCTCGCAGTTCGAATCTG, reverse 5’-AACTCTTTCGGTCGTACCCC, with a custom designed probe (5'- /56-FAM/AGG TGA TGA /ZEN/TGA TGG GCA ACG TTC AC/3IABkFQ/ -3'); Cdkn1a (p21) variant 1, forward 5’-TCCACAGCGATATCCAGACA, reverse 5’-GGACATCACCAGGATTGGAC, with UPL probe 21; Cdkn1a (p21) variant 2, forward 5’-TTGCCAGCAGAATAAAAGGTG, reverse 5’-TTTGCTCCTGTGCGGAAC, with UPL probe 9; β-actin: forward 5’- CTAAGGCCAACCGTGAAAAG, reverse 5’- ACCAGAGGCATACAGGGACA, with UPL probe 64; tubulin: forward 5’- CTGGAACCCACGGTCATC, reverse 5’- GTGGCCACGAGCATAGTTATT, UPL probe 88. Results were normalized to β-actin and tubulin. ΔΔCt values prior to logarithmic transformation were used for statistical analyses.
Promoter analysis
Transcription factor binding sites were analyzed using TRANSFAC version 2018.3 (geneXplain) and sequences between -2500 and +500 for each variant. For each variant, two analyses were performed, either minimizing false positives (minFP) or balancing false positives and false negatives (minSUM), using algorithms provided by the software.
Statistical analysis
Unless otherwise noted, results are shown as individual data points with geometric means and 95% CIs. Comparisons between multiple groups were analyzed using 1-way ANOVA with Tukey post-tests, or 2-way ANOVA with Bonferroni post-tests if a second variant (usually time) was present. No statistical outliers were removed.
Supplementary Materials
Author Contributions
J.A.L.-D., S.R.L. and U.A.C performed the experimental work. M.K. performed the in vivo ABT-263 experiment. J.A.L.-D., U.A.C, R.-M.L. P.-Y.D. and J.C. designed experiments and interpreted the results. J.M.V. and C.C. contributed to interpretation of the results. J.A.L.-D., P.-Y.D. and J.C. wrote the paper.
Conflicts of Interest
J.C. is a cofounder of Unity Biotechnology, which is developing senolytic agents. R.-M.L. and J.C. are co-inventors on patent applications licensed to or filed by Unity Biotechnology.
Funding
This work was supported by the Spanish Ministry of Economy project grant BFU2015-64630-R and pre-doctoral fellowship BES-2016-078229, and by UNITY Biotechnology.
References
- 1. Campisi J, d’Adda di Fagagna F. Cellular senescence: when bad things happen to good cells. Nat Rev Mol Cell Biol. 2007; 8:729–40. https://doi.org/10.1038/nrm2233 [PubMed]
- 2. Krishnamurthy J, Torrice C, Ramsey MR, Kovalev GI, Al-Regaiey K, Su L, Sharpless NE. Ink4a/Arf expression is a biomarker of aging. J Clin Invest. 2004; 114:1299–307. https://doi.org/10.1172/JCI22475 [PubMed]
- 3. Sorrentino JA, Krishnamurthy J, Tilley S, Alb JG
Jr , Burd CE, Sharpless NE. p16INK4a reporter mice reveal age-promoting effects of environmental toxicants. J Clin Invest. 2014; 124:169–73. https://doi.org/10.1172/JCI70960 [PubMed] - 4. Demaria M, Ohtani N, Youssef SA, Rodier F, Toussaint W, Mitchell JR, Laberge RM, Vijg J, Van Steeg H, Dollé ME, Hoeijmakers JH, de Bruin A, Hara E, Campisi J. An essential role for senescent cells in optimal wound healing through secretion of PDGF-AA. Dev Cell. 2014; 31:722–33. https://doi.org/10.1016/j.devcel.2014.11.012 [PubMed]
- 5. Baker DJ, Wijshake T, Tchkonia T, LeBrasseur NK, Childs BG, van de Sluis B, Kirkland JL, van Deursen JM. Clearance of p16Ink4a-positive senescent cells delays ageing-associated disorders. Nature. 2011; 479:232–36. https://doi.org/10.1038/nature10600 [PubMed]
- 6. Baker DJ, Childs BG, Durik M, Wijers ME, Sieben CJ, Zhong J, Saltness RA, Jeganathan KB, Verzosa GC, Pezeshki A, Khazaie K, Miller JD, van Deursen JM. Naturally occurring p16(Ink4a)-positive cells shorten healthy lifespan. Nature. 2016; 530:184–89. https://doi.org/10.1038/nature16932 [PubMed]
- 7. Edwards MG, Anderson RM, Yuan M, Kendziorski CM, Weindruch R, Prolla TA. Gene expression profiling of aging reveals activation of a p53-mediated transcriptional program. BMC Genomics. 2007; 8:80. https://doi.org/10.1186/1471-2164-8-80 [PubMed]
- 8. Hudgins AD, Tazearslan C, Tare A, Zhu Y, Huffman D, Suh Y. Age- and Tissue-Specific Expression of Senescence Biomarkers in Mice. Front Genet. 2018; 9:59. https://doi.org/10.3389/fgene.2018.00059 [PubMed]
- 9. Ohtani N, Imamura Y, Yamakoshi K, Hirota F, Nakayama R, Kubo Y, Ishimaru N, Takahashi A, Hirao A, Shimizu T, Mann DJ, Saya H, Hayashi Y, et al. Visualizing the dynamics of p21(Waf1/Cip1) cyclin-dependent kinase inhibitor expression in living animals. Proc Natl Acad Sci USA. 2007; 104:15034–39. https://doi.org/10.1073/pnas.0706949104 [PubMed]
- 10. Gartel AL, Radhakrishnan SK, Serfas MS, Kwon YH, Tyner AL. A novel p21WAF1/CIP1 transcript is highly dependent on p53 for its basal expression in mouse tissues. Oncogene. 2004; 23:8154–57. https://doi.org/10.1038/sj.onc.1207820 [PubMed]
- 11. Lehman SL, Cerniglia GJ, Johannes GJ, Ye J, Ryeom S, Koumenis C. Translational Upregulation of an Individual p21Cip1 Transcript Variant by GCN2 Regulates Cell Proliferation and Survival under Nutrient Stress. PLoS Genet. 2015; 11:e1005212. https://doi.org/10.1371/journal.pgen.1005212 [PubMed]
- 12. Freund A, Laberge RM, Demaria M, Campisi J. Lamin B1 loss is a senescence-associated biomarker. Mol Biol Cell. 2012; 23:2066–75. https://doi.org/10.1091/mbc.E11-10-0884 [PubMed]
- 13. Demaria M, O’Leary MN, Chang J, Shao L, Liu S, Alimirah F, Koenig K, Le C, Mitin N, Deal AM, Alston S, Academia EC, Kilmarx S, et al. Cellular Senescence Promotes Adverse Effects of Chemotherapy and Cancer Relapse. Cancer Discov. 2017; 7:165–76. https://doi.org/10.1158/2159-8290.CD-16-0241 [PubMed]
- 14. Kojima K, Konopleva M, McQueen T, O’Brien S, Plunkett W, Andreeff M. Mdm2 inhibitor Nutlin-3a induces p53-mediated apoptosis by transcription-dependent and transcription-independent mechanisms and may overcome Atm-mediated resistance to fludarabine in chronic lymphocytic leukemia. Blood. 2006; 108:993–1000. https://doi.org/10.1182/blood-2005-12-5148 [PubMed]
- 15. Gréchez-Cassiau A, Rayet B, Guillaumond F, Teboul M, Delaunay F. The circadian clock component BMAL1 is a critical regulator of p21WAF1/CIP1 expression and hepatocyte proliferation. J Biol Chem. 2008; 283:4535–42. https://doi.org/10.1074/jbc.M705576200 [PubMed]
- 16. Chang J, Wang Y, Shao L, Laberge RM, Demaria M, Campisi J, Janakiraman K, Sharpless NE, Ding S, Feng W, Luo Y, Wang X, Aykin-Burns N, et al. Clearance of senescent cells by ABT263 rejuvenates aged hematopoietic stem cells in mice. Nat Med. 2016; 22:78–83. https://doi.org/10.1038/nm.4010 [PubMed]
- 17. Zhu Y, Tchkonia T, Fuhrmann-Stroissnigg H, Dai HM, Ling YY, Stout MB, Pirtskhalava T, Giorgadze N, Johnson KO, Giles CB, Wren JD, Niedernhofer LJ, Robbins PD, Kirkland JL. Identification of a novel senolytic agent, navitoclax, targeting the Bcl-2 family of anti-apoptotic factors. Aging Cell. 2016; 15:428–35 https://doi.org/10.1111/acel.12445 [PubMed]
- 18. Vasey DB, Wolf CR, MacArtney T, Brown K, Whitelaw CB. p21-LacZ reporter mice reflect p53-dependent toxic insult. Toxicol Appl Pharmacol. 2008; 227:440–50. https://doi.org/10.1016/j.taap.2007.11.029 [PubMed]
- 19. Tinkum KL, Marpegan L, White LS, Sun J, Herzog ED, Piwnica-Worms D, Piwnica-Worms H. Bioluminescence imaging captures the expression and dynamics of endogenous p21 promoter activity in living mice and intact cells. Mol Cell Biol. 2011; 31:3759–72. https://doi.org/10.1128/MCB.05243-11 [PubMed]
- 20. Hsu CH, Altschuler SJ, Wu LF. Patterns of Early p21 Dynamics Determine Proliferation-Senescence Cell Fate after Chemotherapy. Cell. 2019; 178:361–73.e12. https://doi.org/10.1016/j.cell.2019.05.041 [PubMed]
- 21. Collier AE, Spandau DF, Wek RC. Translational control of a human Cdkn1a mRNA splice variant regulates the fate of UVB-irradiated human keratinocytes. Mol Biol Cell. 2018; 29:29–41. https://doi.org/10.1091/mbc.E17-06-0362 [PubMed]
- 22. Radhakrishnan SK, Gierut J, Gartel AL. Multiple alternate p21 transcripts are regulated by p53 in human cells. Oncogene. 2006; 25:1812–5. https://doi.org/10.1038/sj.onc.1209195 [PubMed]
- 23. Rodier F, Coppé JP, Patil CK, Hoeijmakers WA, Muñoz DP, Raza SR, Freund A, Campeau E, Davalos AR, Campisi J. Persistent DNA damage signalling triggers senescence-associated inflammatory cytokine secretion. Nat Cell Biol. 2009; 11:973–9. https://doi.org/10.1038/ncb1909 [PubMed]