


Introduction
The age dedifferentiation hypothesis suggests that as humans age we become more reliant on general intelligence (g) for the different cognitive functions [1]. This is a somewhat contested idea in the geriatric field where it has been suggested that underlying pathology accounts for dedifferentiation [2]. Based on early research on dedifferentiation of cognitive abilities in later life, [3] this hypothesis suggests that the influence of g on cognitive test performance increases as the biological constraint that comes with old age renders specific cognitive abilities more similar [4]. When dedifferentiation is combined with the (i) known differentiation of cognitive functioning that occurs due to skill specialization from young age to adulthood, and (ii) stability of adult cognitive functioning from 18-65 years of age, [5] a conceptual U-type lifespan plot can be drawn (Figure 1) similar to Craik and Bialystok [6].
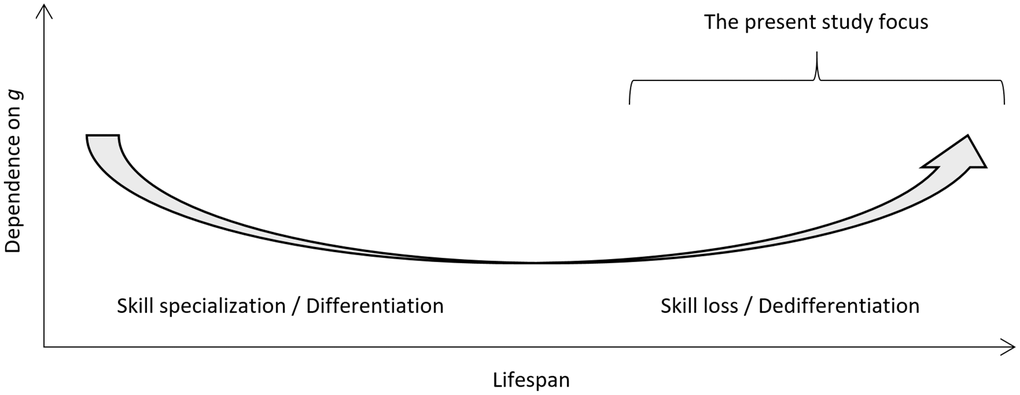
Figure 1. Conceptual plot for the degree of dependence of cognitive test scores on general intelligence (g) as a function of cognitive development and specialization in young age, stability in adult age, and decline in old age. The present study focus is highlighted.
In the neuroscience literature, age-related neural dedifferentiation is a fairly robust phenomenon [7]. However, ascribing aging itself causal agency for dedifferentiation is probably too coarse [6]. Studies have shown substantial cognitive dedifferentiation in older samples but only in those with suspected [8] or diagnosed [9] abnormal neurodegenerative decline. An age indifferentiation hypothesis has also been proposed that stresses the stability of cognitive ability over time [10]. Aside from aging, other potential causes of dedifferentiation have been described, such as educational attainment [11]. Control for education and other potential confounders is needed if one wants to estimate the unique contribution of neurodegeneration to dedifferentiation [8].
Dedifferentiation seems in part specific to abnormal cognitive decline and, consequently, of specific interest for clinical geriatric populations. Among patients with subjective cognitive complaints seeking healthcare, subjective cognitive impairment (SCI) is distinguished from cognitive impairment (CI) – i.e. either Mild Cognitive Impairment (MCI) or dementia diagnosis – through comprehensive multidisciplinary investigation at a specialized hospital unit, usually a Memory Clinic [12] To our knowledge, the dedifferentiation hypothesis has not been tested in a large, ecologically valid and representative sample of memory clinic patients. Dedifferentiation in these patients, whom have all undergone the memory clinic investigation and been diagnosed as either CI (MCI or dementia) or No CI (SCI), can be studied and the association of CI with dedifferentiation estimated.
The present study thus tested the dedifferentiation hypothesis as a function of CI in two cohorts, each of considerable size and each including both individuals with CI and NCI, but with important differences regarding their geographical location (ADNI: North America [13], MemClin: Sweden) [12], diagnostic setting (research setting; clinical setting), sample selection, and data characteristics. After controlling for age, education, and sex, we hypothesized that as CI comes into play, dedifferentiation is greater and the influence of g on cognitive test performance is higher. We also expected dedifferentiation to be more clear in the ADNI database compared to MemClin since ADNI applied a set of additional exclusion criteria to a priori differentiate diagnostic groups whereas MemClin did not have such exclusion but instead by design includes patients that are the most difficult to diagnostically differentiate requiring full memory clinic investigation.
Results
Summary statistics for patients subgrouped by dataset and by group are available in Table 1. Within each dataset, patients with CI were older, had completed fewer years of education, more likely male, and performed worse on psychometric tests, compared to NCI patients. Across datasets, patients were similar in age but ADNI patients had more years of education. ADNI patient counts were more evenly dispersed across groups relative to MemClin. In addition, differences in psychometric performance across CI and NCI groups were slightly more pronounced in ADNI compared to MemClin.
Table 1. Descriptive statistics in ADNI and MemClin within each dataset stratified as CI and NCI.
| ADNI | MemClin | ||||||||||||||||||||||||||||||||||||||||||||||||||||||||||||||||||||||||||||||||||||||||||||||||||
| CI (n = 884) | NCI (n = 398) | CI (n = 1071) | NCI (n = 152) | ||||||||||||||||||||||||||||||||||||||||||||||||||||||||||||||||||||||||||||||||||||||||||||||||
| Age (yrs) | 74.33 (7.40) | 74.24 (5.68) | 78.32 (6.00) | 75.32 (5.70) | |||||||||||||||||||||||||||||||||||||||||||||||||||||||||||||||||||||||||||||||||||||||||||||||
| Education (yrs) | 15.76 (2.86) | 16.40 (2.68) | 12.22 (3.59) | 13.54 (3.74) | |||||||||||||||||||||||||||||||||||||||||||||||||||||||||||||||||||||||||||||||||||||||||||||||
| Male sex | 517 (58.8) | 188 (47.2) | 551 (51.4) | 61 (40.1) | |||||||||||||||||||||||||||||||||||||||||||||||||||||||||||||||||||||||||||||||||||||||||||||||
| Diagnosis, three class | |||||||||||||||||||||||||||||||||||||||||||||||||||||||||||||||||||||||||||||||||||||||||||||||||||
| Dementia*/AD | 503 (56.9) | 0 (0.0) | 331 (30.9) | 0 (0.0) | |||||||||||||||||||||||||||||||||||||||||||||||||||||||||||||||||||||||||||||||||||||||||||||||
| MCI | 381 (43.1) | 0 (0.0) | 740 (69.1) | 0 (0.0) | |||||||||||||||||||||||||||||||||||||||||||||||||||||||||||||||||||||||||||||||||||||||||||||||
| CN/SCI | 0 (0.0) | 398 (100.0) | 0 (0.0) | 152 (100.0) | |||||||||||||||||||||||||||||||||||||||||||||||||||||||||||||||||||||||||||||||||||||||||||||||
| Key psychometric tests | |||||||||||||||||||||||||||||||||||||||||||||||||||||||||||||||||||||||||||||||||||||||||||||||||||
| AVLT 1 | 4.05 (1.57) | 5.48 (1.73) | 3.55 (1.68) | 5.64 (1.73) | |||||||||||||||||||||||||||||||||||||||||||||||||||||||||||||||||||||||||||||||||||||||||||||||
| AVLT delayed recall | 2.64 (3.42) | 7.85 (3.76) | 3.98 (3.22) | 10.11 (2.96) | |||||||||||||||||||||||||||||||||||||||||||||||||||||||||||||||||||||||||||||||||||||||||||||||
| TMT B / TMT 3 | 142.97 (81.77) | 82.86 (41.07) | 84.87 (38.93) | 46.62 (16.62) | |||||||||||||||||||||||||||||||||||||||||||||||||||||||||||||||||||||||||||||||||||||||||||||||
| MMSE | 26.30 (2.73) | 29.07 (1.16) | 26.67 (2.46) | 28.91 (1.36) | |||||||||||||||||||||||||||||||||||||||||||||||||||||||||||||||||||||||||||||||||||||||||||||||
| Data are mean (SD) and count (%). Psychometric tests are raw scores. *MemClin includes other subtypes, most frequently AD, vascular dementia, and mixed dementia. ADNI, Alzheimer’s Disease Neuroimaging Initiative; MemClin, Memory Clinic project; AD, Alzheimer’s disease; AVLT, Rey Auditory Verbal Learning Test; CI, Cognitive impairment; NCI, No cognitive impairment; CN, Cognitively normal; MCI, Mild cognitive impairment; MMSE, Mini Mental State Examination; SCI, Subjective cognitive impairment; TMT, Trail-Making Test. | |||||||||||||||||||||||||||||||||||||||||||||||||||||||||||||||||||||||||||||||||||||||||||||||||||
Table 2 shows a higher proportion of variance in psychometric test scores explained by PC1 for the CI group vs NCI, across both ADNI and MemClin. Applying the Kaiser rule retained one less PC for the CI group vs NCI in ADNI. However, equal amount of PCs were retained across groups in MemClin. Regarding individual PC1 test loadings for key cognitive domains, the averages were slightly higher and less variable across domains for the CI group vs NCI in ADNI but not in MemClin.
Table 2. Principal component analysis (PCA) in the separate ADNI and MemClin datasets by CI vs NCI groups after matching.
| ADNI | MemClin | ||||||||||||||||||||||||||||||||||||||||||||||||||||||||||||||||||||||||||||||||||||||||||||||||||
| CI (n = 392) | NCI (n = 392) | CI (n = 143) | NCI (n = 143) | ||||||||||||||||||||||||||||||||||||||||||||||||||||||||||||||||||||||||||||||||||||||||||||||||
| % variance explained by PC1 | 53.1 | 38.3 | 33.3 | 30.8 | |||||||||||||||||||||||||||||||||||||||||||||||||||||||||||||||||||||||||||||||||||||||||||||||
| N factors with eigenvalues > 1 | 2 | 3 | 5 | 5 | |||||||||||||||||||||||||||||||||||||||||||||||||||||||||||||||||||||||||||||||||||||||||||||||
| Individual test loadings on PC1 | |||||||||||||||||||||||||||||||||||||||||||||||||||||||||||||||||||||||||||||||||||||||||||||||||||
| Working memory (AVLT 1) | 0.24 | 0.27 | 0.28 | 0.27 | |||||||||||||||||||||||||||||||||||||||||||||||||||||||||||||||||||||||||||||||||||||||||||||||
| Episodic memory (AVLT delayed recall; AVLT 5) | 0.26 | 0.32 | 0.28 | 0.29 | |||||||||||||||||||||||||||||||||||||||||||||||||||||||||||||||||||||||||||||||||||||||||||||||
| Executive function (TMT B; TMT 3) | 0.24 | 0.13 | 0.18 | 0.19 | |||||||||||||||||||||||||||||||||||||||||||||||||||||||||||||||||||||||||||||||||||||||||||||||
| General (MMSE) | 0.25 | 0.10 | 0.20 | 0.18 | |||||||||||||||||||||||||||||||||||||||||||||||||||||||||||||||||||||||||||||||||||||||||||||||
| Patients have been propensity score matched 1:1 without replacement on age, education and sex. PCA was thereafter performed through single value decomposition. Values are calculated with imputed and propensity score matched data controlling for age, education, and sex. ADNI, Alzheimer’s Disease Neuroimaging Initiative; MemClin, Memory Clinic Project; AVLT, Rey Auditory Verbal Learning Test; CI, Cognitive impairment; NCI, No cognitive impairment; MMSE, Mini Mental State Examination. | |||||||||||||||||||||||||||||||||||||||||||||||||||||||||||||||||||||||||||||||||||||||||||||||||||
All informative test pair correlations (105 for ADNI; 190 for MemClin) sorted from weakest to strongest magnitude stratified by database and group are depicted in Figure 2 showing dedifferentiation by impairment in both datasets, i.e. generally stronger linear associations between test pairs among CI vs NCI patients (ADNI: mean inter-test r = 0.51 vs r = 0.33, p < 0.001) and MemClin: r = 0.31 vs r = 0.27, p = 0.042). We also see that the dedifferentiation pattern is more pronounced in ADNI compared to MemClin but present in both.
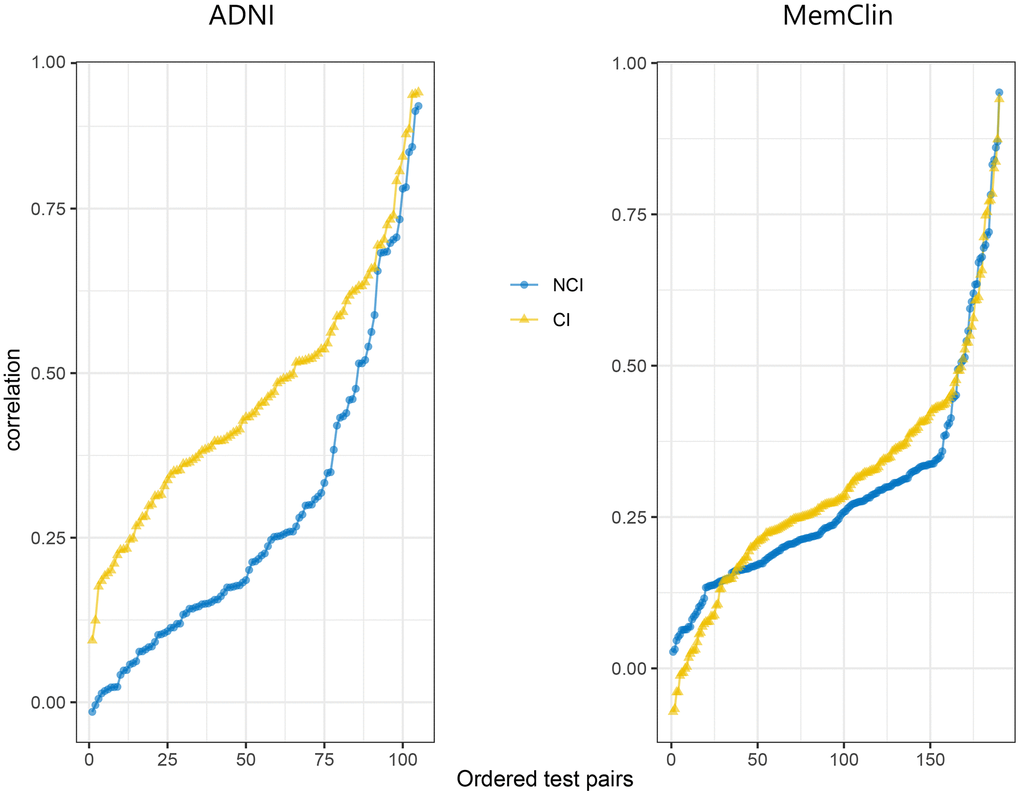
Figure 2. Sorted correlation strengths across all informative test pairs in the ADNI (n = 105) and MemClin (n = 190) datasets. Notice that inverse test scores (e.g. TMT) had been rescaled prior and that the assumption of positive manifold is slightly violated (a few negative correlations), possibly due to stochasticity. ADNI, Alzheimer’s Disease Neuroimaging Initiative; MemClin, Memory Clinic Project; CI, Cognitive Impairmen; NCI, No Cognitive Impairment; TMT, Trail-Making Test.
Discussion
After controlling for age, education and sex through propensity score matching, dedifferentiation was specifically associated with cognitive impairment in the present study. This was shown in two large, high-quality cohorts that differed in several aspects; the research oriented ADNI and the naturalistic cohort MemClin. Our findings are in line with previous studies showing age-related dedifferentiation of cognitive abilities, yet does not focus on aging with respect to dedifferentiation. Instead, our findings corroborate previous research highlighting the role of impairment of cognitive functions as explanatory for cognitive dedifferentiation in the latter portion of life, rather than explained by aging per se [8, 9].
Research on dedifferentiation, as the phenomenon is defined and investigated with data, predominantly focuses on cognitive change processes that are global in their nature. There are however more specific and also subtle changes to human cognition in late life. Cognitive reorganization has been suggested, [14] as well as findings suggesting that differentiation and dedifferentiation processes can be simultaneously ongoing as part of a cognitive restructuring process that is compensatory to newly developed cognitive deficiency [15]. There is also the concept of cognitive reserve suggesting interindividual differences with regards to the amount of complex cognitive activity experienced during life. This experience in turn determines interindividual differences in accumulated cognitive reserve which functions as a flexible and active buffer to cognitive decline, for some but not for others, as neurodegeneration progresses [16]. There are likely both fixed and modifiable factors producing variability in cognitive reserve across individuals that may in turn influence dedifferentiation caused by neurodegeneration. In our study we did control for education and thus also controlled for cognitive reserve by proxy so the present findings can hardly be explained by cognitive reserve. One can conclude that more research on these largely interlinked cognitive processes and their relationship with dedifferentiation is needed.
Clinical perspective
To our knowledge, this is the first time cognitive impairment as explanatory variable for dedifferentiation is found in two large and separate cohorts in which each patient’s cognition has been thoroughly examined and diagnosed. The present study therefore puts particular emphasis on the dedifferentiation phenomenon in the context of geriatric care and its patient population in abnormal cognitive decline, i.e. patients with MCI or dementia.
One important issue that the present study highlights pertains to the cognitive profile of a patient, and whether this profile of performance on psychometric tests is relatively similar across cognitive domains gauged by the tests. Clinicians often reason that an “even” profile is a sign of healthy cognitive functioning, and vice versa. The present study problematizes such reasoning as it suggests that an even cognitive profile can de facto be due to dedifferentiation of cognitive abilities. Most clinicians are well-aware that a cognitive test profile that is similar across domains but significantly worse across these domains relative to normative test scores usually signifies some form of cognitive decline. If however dedifferentiation presents itself early on for a patient, it might obscure a serious condition if the clinician applies the “even profile” heuristic when presented with a cognitive profile that is a bit lower in performance relative to applicable test norms but similar across cognitive domains. Simply because AD is very common, and because the classic AD profile is uneven with fairly distinct underperformance on episodic memory tests, does not allow for diagnostic heuristics to be applied insofar that possible dedifferentiation is ignored. Further, if a cognitive profile of a patient is even because of dedifferentiation and then also coupled with inadequately estimated premorbid cognition, proper diagnosis of MCI could be substantially delayed for patients initially classified as cognitively healthy or with only subjective cognitive impairment.
Cognitive status conditions are difficult to diagnose and require thorough examination by a multidisciplinary team at a memory clinic to achieve sufficient diagnostic accuracy for the most difficult to separate patients. In clinical practice, stronger dedifferentiation with progressing neurodegeneration means that impaired patients depend to a greater extent on their general intelligence because their task specific skills developed earlier in life are deteriorating. This suggests that important lessons are to be learned regarding how these patients become, for instance, cognitively overburdened in concrete daily situations, during which they previously could offload their cognitive ability through skill heuristics but which are no longer accessible, or not as easily accessible to them.
Limitations and strengths
All observational research is limited by possibly remaining residual confounding. This includes our study, since there may be other factors than cognitive impairment that produces dedifferentiation of cognitive abilities in late life. Factors such as biological age [15], cognitive reserve [17], or brain compensation [18] might also produce dedifferentiation, and we cannot exclude the possibility that compensatory mechanisms co-exist with cognitive impairment, especially in the early phases. We were not able to directly control for all these factors in the present study, but through propensity score matching on age, education, and sex, it is reasonable to assume that we control for the bulk of such possible confounding indirectly. Control for premorbid ability was not deemed necessary as years of education was controlled for and is considered a good proxy for premorbid ability. Moreover, the different prevailing retrospective methods for estimating premorbid ability; using education and demographics, or semantic knowledge test performance (e.g. WAIS-IV Information), or a specific pronunciation type test (e.g. NART [19], ISW [20]), have their respective limitations such as overestimation and conceptual biases. More research is likely needed in which other potential confounders are controlled for, simultaneously being wary of the modelling pitfall of overadjustment bias, i.e. controlling for intermediary variables situated on the suggested causal path from cognitive impairment to dedifferentiation. Our study was also limited by data being cross-sectional. There are longitudinal measurements on some variables in both ADNI and MemClin but a more complete recording of psychometric performance across time is needed to study dedifferentiation over time within individuals. Another important feature in our study was the multiple dimensions for which the ADNI and MemClin cohorts differ. For instance, ADNI is a North American research database, employing in part different psychometric tests, brain imaging techniques, diagnostic methods, and patient inclusion procedures compared to the Swedish MemClin database. Because of these differences, the two datasets could not be combined and analysed as a whole. We could however use the strengths of this study feature by investigating, and also finding, dedifferentiation in the two datasets separately, leveraging their individually fairly large size and generally high quality of measurements. Another important difference relates to differing sampling procedures for which ADNI deliberately sampled healthy controls whereas MemClin controls where SCI patients. The pattern of dedifferentiation was also more pronounced in ADNI compared to MemClin. Importantly, MemClin is a new large-scale naturalistic database with high ecological validity and generalizability to the clinical geriatric population in its specialized care setting provides both a rare strength, and a complement to the excellent ADNI database for conducting such studies as the present one.
Conclusions
Dedifferentiation of cognitive abilities in late life was investigated and identified in two large and independent cohorts. Through adjustment for age, education, and sex, an independent association of cognitive impairment on dedifferentiation was found. The meta-cognitive aspect of dedifferentiation is important and should be accounted for by clinicians as they diagnose, treat, and care for their patients.
Materials and Methods
Study population
We included patients from the Alzheimer’s Disease Neuroimaging Initiative (ADNI, n = 1282) [13] and the Memory Clinic Project (MemClin, n = 1223) [12]. The diagnostic procedures for ADNI [21] and MemClin have previously been described [12]. For ADNI, the diagnosis procedure relied on subjective and objective cognitive measures but was independent of biomarker information. For MemClin, diagnosis was determined at multidisciplinary consensus meetings based on cognitive testing, neurological examination, brain imaging, biomarkers and other routine clinical measures as available [12, 22, 23]. The diagnosed cognitive statuses of dementia, MCI, and SCI were collapsed into two classes: CI and NCI. CI represents impairment of clinically diagnosed severity whereas NCI represents no objective impairment.
Cognitive variables
The administered neuropsychological batteries of ADNI and MemClin are described elsewhere [12, 14] and covered similar cognitive domains and subdomains with some differences by original design. Importantly however, across main analysis comparisons of dedifferentiation in on CI vs NCI variables were identical in each database. Unless further defined, psychometric tests are total raw scores. Some psychometric variables were reverse coded as needed. Psychometric tests are separated with semi-colon (;) and subtests belonging to the same test are separated with dash (/) as follows.
From ADNI we selected patient performance on 15 variables: the Mini Mental State Examination (MMSE); Clock test; Copy test; Rey Auditory Verbal Learning Test (AVLT) trial 1/2/3/4/5/total score/delayed recall/recognition; semantic fluency (animals); Trail-Making Test (TMT) A/B; and Boston Naming Test spontaneous recall.
From MemClin we selected 20 variables: MMSE; Wechsler Adult intelligence Scale 4th edition (WAIS-IV) Information; Block design; Digit Span total/forward/backward; AVLT 1/2/3/4/5/total score; Rey Complex Figure copy; Delis-Kaplan Executive Function System (D-KEFS) Verbal fluency FAS/semantic fluency/shifting (correct answers)/shifting (correct shiftings); and TMT 1/2/3. TheHiveDB was used for MemClin data management [24].
Statistical analyses
All analyses were mirrored and run separately in both ADNI and MemClin. Due to missing data some variables were excluded (cut-off > 25% missing). Remaining missing data sorted by % missing of total (in ADNI: TMT B [1.9], NART [0.7], sex [0.3], age [0.3], edu [0.3] and in MemClin: AVLT total [23.8], D-KEFS TMT 3 [22.8], RCFT copy [22.6], WAIS-IV Block design [20.9], D-KEFS TMT 1 [20.7] was deemed acceptable, assumed to be missing at random (MAR) and imputed with k Nearest Neighbour (kNN) [25, 26] applying the unweighted Gower distance metric [27] with k set to three.
To control for confounding of the Dedifferentiation ~ CI association, propensity score matching [28, 29] was performed prior to main analysis. A logit model was constructed estimating the probability for CI with age at examination, years of education, and sex as predictors. Exposed (CI) where thereafter propensity score matched 1:1 with unexposed (NCI) without replacement on this probability applying SD = 0.05 caliper width. Figure 3 plots the matching diagnostics and resulting across-group balance in the confounders.
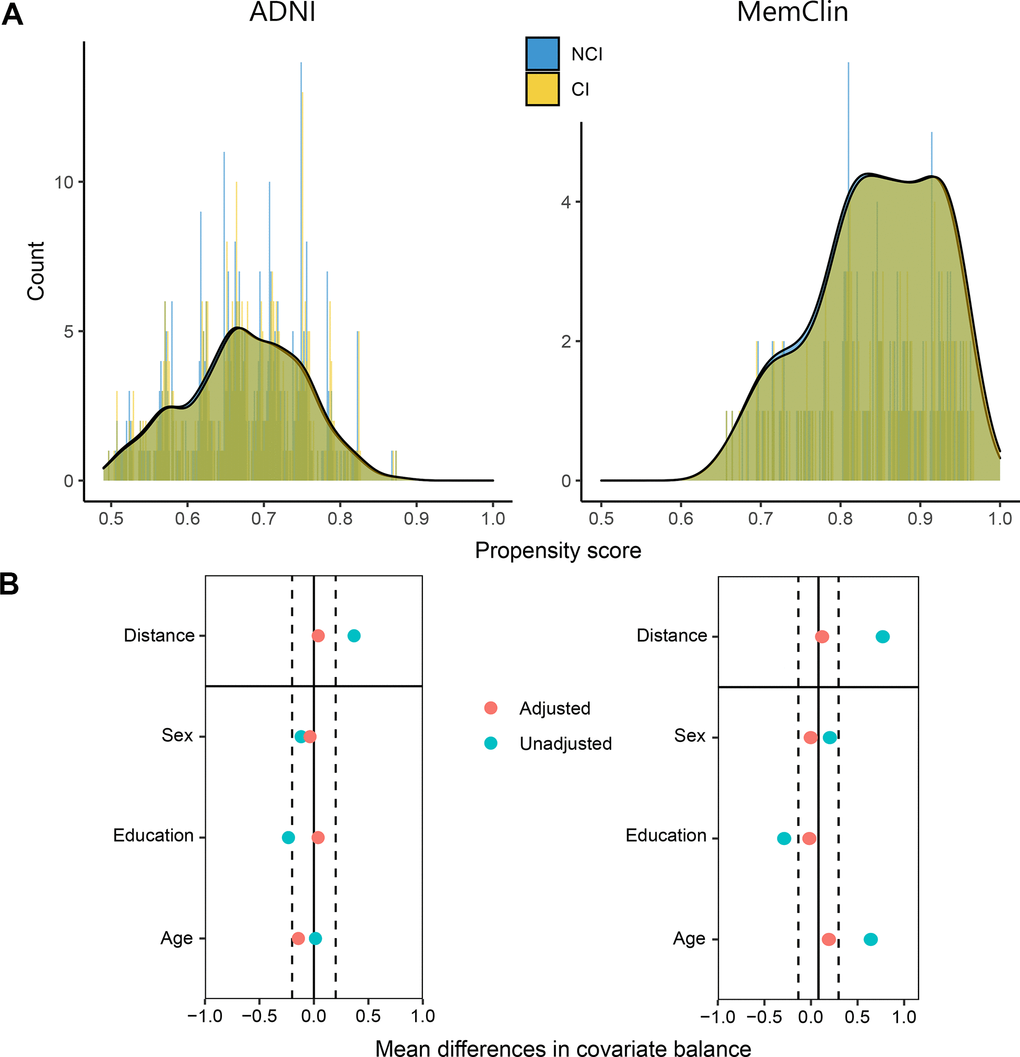
Figure 3. Propensity score matching diagnostics in the ADNI and MemClin datasets. (A) Patient counts after matching are shown as a function of their individual propensity score and overlayed with density plots, stratified by level of cognitive impairment. (B) Mean distance followed by single-covariate balance by group calculated before (Unadjusted) and after (Adjusted) matching. ADNI matched: n CI= 392, n NCI = 392. MemClin matched: n CI = 143, n NCI = 143. ADNI, Alzheimer’s Disease Neuroimaging Initiative; MemClin, Memory Clinic Project; CI, cognitive impairment; NCI, no cognitive impairment.
Main analysis
After matching, principal component analysis (PCA) was performed on the mean centered and unit variance scaled psychometric variables through single value decomposition. Percentage explained variance in psychometric variables by the first unrotated component (PC1), a proxy for general cognitive ability, was compared across the matched CI and NCI groups expecting a smaller % explained variance by PC1 among scores in the CI vs the NCI group. We also report n components with eigenvalues > 1 (Kaiser criterion) expecting fewer selected components by this criterion for CI vs NCI. Loadings on PC1 by key psychometric tests that tap central cognitive domains were expected to be higher in CI vs NCI groups. Supplementary Tables 1, 2 show PCA analysis by subgroups after propensity score matching for both the ADNI and the MemClin cohort.
Correlation coefficients calculated across all informative pairings of psychometric variables were thereafter sorted from weakest to strongest and assessed by t-test and also by visual inspection comparing the strengths of correlations across matched CI and NCI groups expecting average test-pair correlations to be higher in the CI vs the NCI group.
Additional statistics
Unless further explained, bivariate summary statistics are presented as mean (SD) for numeric variables and count (%) for factors. Statistical significance was set to 5%.
Analyses were performed in R version 4.0.1 using packages caret, cobalt, corrplot, data.table, dummies, factoextra, FactoMineR, foreign, ggplot2, gridExtra, haven, MatchIt, matrixStats, mice, readxl, tableone, and VIM.
Supplementary Materials
Author Contributions
JW and UE designed the study. JW drafted the manuscript and analyzed data. All authors interpreted the results, revised the manuscript, and approved the final submission.
Acknowledgments
We are deeply thankful to the ADNI and MemClin participants and clinicians as they made this study possible.
Data collection and sharing for this project was funded by the Alzheimer's Disease Neuroimaging Initiative (ADNI) (National Institutes of Health Grant U01 AG024904) and DOD ADNI (Department of Defense award number W81XWH-12-2-0012). ADNI is funded by the National Institute on Aging, the National Institute of Biomedical Imaging and Bioengineering, and through generous contributions from the following: AbbVie, Alzheimer’s Association; Alzheimer’s Drug Discovery Foundation; Araclon Biotech; BioClinica, Inc.; Biogen; Bristol-Myers Squibb Company; CereSpir, Inc.; Cogstate; Eisai Inc.; Elan Pharmaceuticals, Inc.; Eli Lilly and Company; EuroImmun; F. Hoffmann-La Roche Ltd and its affiliated company Genentech, Inc.; Fujirebio; GE Healthcare; IXICO Ltd.; Janssen Alzheimer Immunotherapy Research and Development, LLC.; Johnson and Johnson Pharmaceutical Research and Development LLC.; Lumosity; Lundbeck; Merck and Co., Inc.; Meso Scale Diagnostics, LLC.; NeuroRx Research; Neurotrack Technologies; Novartis Pharmaceuticals Corporation; Pfizer Inc.; Piramal Imaging; Servier; Takeda Pharmaceutical Company; and Transition Therapeutics. The Canadian Institutes of Health Research is providing funds to support ADNI clinical sites in Canada. Private sector contributions are facilitated by the Foundation for the National Institutes of Health (https://www.fnih.org/). The grantee organization is the Northern California Institute for Research and Education, and the study is coordinated by the Alzheimer’s Therapeutic Research Institute at the University of Southern California. ADNI data are disseminated by the Laboratory for Neuro Imaging at the University of Southern California.
Conflicts of Interest
The authors declare that they have no conflicts of interest.
Funding
This study was financially supported by the Swedish Research Council (VR), the Swedish Research Council for Health, Working Life and Welfare (FORTE), the Swedish Foundation for Strategic Research (SSF), the Strategic Research Programme in Neuroscience at Karolinska Institutet (StratNeuro), the Åke Wiberg foundation, Hjärnfonden, Alzheimerfonden, Demensfonden, The Söderström König Foundation, Stiftelsen Olle Engkvist Byggmästare, Loo och Hans Ostermans stiftelse för medicinsk forskning, and Birgitta och Sten Westerberg. The funding sources had no role in the study design, data collection, analysis, interpretation, or the writing of the manuscript.
References
- 1. Reinert G. Comparative Factor Analytic Studies of Intelligence Throughout the Human Life-span. The West Virginia University Conference on Life-Span Developmental Psychology; Morgantown, West Virginia University 1970.
- 2. Dodge HH, Marson DC. Illuminating cognitive dedifferentiation at the end of life. Neurology. 2012; 78:1110–11. https://doi.org/10.1212/WNL.0b013e31824f80b9 [PubMed]
- 3. Balinsky B. An analysis of the mental factors of various age groups from nine to sixty. Genetic Psychology Monographs. 1941; 23:191–234.
- 4. Balsamo M, Romanelli R, Saggino A. The de-differentiation hypothesis in normal elderly persons. Percept Mot Skills. 2010; 110:85–88. https://doi.org/10.2466/PMS.110.1.85-88 [PubMed]
- 5. Rönnlund M, Sundström A, Nilsson LG. Interindividual differences in general cognitive ability from age 18 to age 65 years are extremely stable and strongly associated with working memory capacity. Intelligence. 2015; 53:59–64.
- 6. Craik FI, Bialystok E. Cognition through the lifespan: mechanisms of change. Trends Cogn Sci. 2006; 10:131–38. https://doi.org/10.1016/j.tics.2006.01.007 [PubMed]
- 7. Koen JD, Rugg MD. Neural Dedifferentiation in the Aging Brain. Trends Cogn Sci. 2019; 23:547–59. https://doi.org/10.1016/j.tics.2019.04.012 [PubMed]
- 8. Batterham PJ, Christensen H, Mackinnon AJ. Comparison of age and time-to-death in the dedifferentiation of late-life cognitive abilities. Psychol Aging. 2011; 26:844–51. https://doi.org/10.1037/a0023300 [PubMed]
- 9. Wilson RS, Segawa E, Hizel LP, Boyle PA, Bennett DA. Terminal dedifferentiation of cognitive abilities. Neurology. 2012; 78:1116–22. https://doi.org/10.1212/WNL.0b013e31824f7ff2 [PubMed]
- 10. Juan-Espinosa M, García LF, Escorial S, Rebollo I, Colom R, Abad FJ. Age dedifferentiation hypothetis: Evidence from the WAIS III. Intelligence. 2002; 30:395–408.
- 11. Christensen H. What cognitive changes can be expected with normal ageing? Aust N Z J Psychiatry. 2001; 35:768–75. https://doi.org/10.1046/j.1440-1614.2001.00966.x [PubMed]
- 12. Ekman U, Ferreira D, Muehlboeck JS, Wallert J, Rennie A, Eriksdotter M, Wahlund LO, Westman E. The MemClin project: a prospective multi memory clinics study targeting early stages of cognitive impairment. BMC Geriatr. 2020; 20:93. https://doi.org/10.1186/s12877-020-1478-3 [PubMed]
- 13. Mueller SG, Weiner MW, Thal LJ, Petersen RC, Jack C, Jagust W, Trojanowski JQ, Toga AW, Beckett L. The Alzheimer’s disease neuroimaging initiative. Neuroimaging Clin N Am. 2005; 15:869–77. https://doi.org/10.1016/j.nic.2005.09.008 [PubMed]
- 14. Bock O, Haeger M, Voelcker-Rehage C. Structure of executive functions in young and in older persons. PLoS One. 2019; 14:e0216149. https://doi.org/10.1371/journal.pone.0216149 [PubMed]
- 15. Gonzalez-Burgos L, Hernández-Cabrera JA, Westman E, Barroso J, Ferreira D. Cognitive compensatory mechanisms in normal aging: a study on verbal fluency and the contribution of other cognitive functions. Aging (Albany NY). 2019; 11:4090–106. https://doi.org/10.18632/aging.102040 [PubMed]
- 16. Stern Y. Cognitive reserve. Neuropsychologia. 2009; 47:2015–28. https://doi.org/10.1016/j.neuropsychologia.2009.03.004 [PubMed]
- 17. Gonzalez-Burgos L, Barroso J, Ferreira D. Cognitive reserve and network efficiency as compensatory mechanisms of the effect of aging on phonemic fluency. Aging (Albany NY). 2020; 12:23351–78. https://doi.org/10.18632/aging.202177 [PubMed]
- 18. Gonzalez-Burgos L, Pereira JB, Mohanty R, Barroso J, Westman E, Ferreira D. Cortical Networks Underpinning Compensation of Verbal Fluency in Normal Aging. Cereb Cortex. 2021. [Epub ahead of print]. https://doi.org/10.1093/cercor/bhab052 [PubMed]
- 19. Nelson HE. National Adult Reading Test (NART): For the Assessment of Premorbid Intelligence in Patients with Dementia: Test Manual, NFER-Nelson, Windsor, UK. 1982.
- 20. Almkvist O, Tallberg IM. Cognitive decline from estimated premorbid status predicts neurodegeneration in Alzheimer’s disease. Neuropsychology. 2009; 23:117–24. https://doi.org/10.1037/a0014074 [PubMed]
- 21. Petersen RC, Aisen PS, Beckett LA, Donohue MC, Gamst AC, Harvey DJ, Jack CR
Jr , Jagust WJ, Shaw LM, Toga AW, Trojanowski JQ, Weiner MW. Alzheimer’s Disease Neuroimaging Initiative (ADNI): clinical characterization. Neurology. 2010; 74:201–09. https://doi.org/10.1212/WNL.0b013e3181cb3e25 [PubMed] - 22. Wallert J, Westman E, Ulinder J, Annerstedt M, Terzis B, Ekman U. Differentiating Patients at the Memory Clinic With Simple Reaction Time Variables: A Predictive Modeling Approach Using Support Vector Machines and Bayesian Optimization. Front Aging Neurosci. 2018; 10:144. https://doi.org/10.3389/fnagi.2018.00144 [PubMed]
- 23. Wallert J, Ekman U, Westman E, Madison G. The worst performance rule with elderly in abnormal cognitive decline. Intelligence. 2017; 64:9–17.
- 24. Muehlboeck JS, Westman E, Simmons A. TheHiveDB image data management and analysis framework. Front Neuroinform. 2014; 7:49. https://doi.org/10.3389/fninf.2013.00049 [PubMed]
- 25. Beretta L, Santaniello A. Nearest neighbor imputation algorithms: a critical evaluation. BMC Med Inform Decis Mak. 2016 (Suppl 3); 16:74. https://doi.org/10.1186/s12911-016-0318-z [PubMed]
- 26. Jönsson P, Wohlin C, editors. An Evaluation of k-Nearest Neighbour imputation Using Likert Data. 10th International Symposium on Software Metrics; 2004: IEEEXplore.
- 27. Kowarik A, Templ M. Imputation with R package VIM. J Stat Softw. 2016; 74:1–16.
- 28. Rosenbaum PR, Rubin DB. The Central Role of the Propensity Score in Observational Studies for Causal Effects. Biometrika. 1983; 70:41–55.
- 29. Ho D, Kosuke I, King G, Stuart E. Matching as Nonparametric Preprocessing for Reducing Model Dependence in Parametric Causal Inference. Political Analysis. 2007; 15:199–236.