


Introduction
Branchial-ankle pulse wave velocity (baPWV), a promising indicator of both central and peripheral arterial stiffness [1], has been proven to be strongly associated with cardio-cerebrovascular morbidity and mortality in a recent meta-analysis of 8 studies [2]. The subclinical state of atherosclerosis could be improved with baPWV-guided lifestyle modification and therapeutic intervention [3].
Metabolic syndrome (MetS) is recognized as a cluster of risk factors for atherosclerotic cardiovascular disease (CVD), including hypertension, hyperlipidemia, hyperglycemia, and broadened waist circumference (WC) [4, 5]. It is known that baPWV increases with MetS, as well as the number of MetS components [6–8]. Obesity, which has reached an epidemic level owing to economic development in China, often coexists with MetS [9]. While no consensus has been reached on the correlation between obesity and baPWV [10, 11]. Currently, a subset of obese individuals without MetS, identified as metabolically healthy obese (MHO), have attracted extensive attention due to the controversial results regarding cardiovascular risk. Some studies demonstrated that obesity status exerted no extra influence on CVD [12, 13]. Others indicated MHO was a transient condition from metabolically healthy to unhealthy phenotypes, and obesity carried an increased risk of CVD regardless of metabolic health status [14–16]. The development of clinical CVD events usually requires a long period of time, subclinical atherosclerosis as arterial stiffness might better estimate the impact of obesity or MetS on CVD within a short period of time. Considering the above-mentioned research, the role of obesity on the association between MetS and baPWV is worth further exploration.
Therefore, we aimed to investigate the risk of incident arterial stiffness according to MHO phenotype in Chinese population using the Kailuan cohort study.
Results
Patients characteristics
In the cross-sectional analysis, out of the 37,180 enrolled participants, 10,295 (27.69%) were metabolically healthy normal weight (MH-NW), 7,171 (19.29%) were metabolically healthy overweight (MH-OW), 2,337 (6.29%) were MHO, 4,253 (11.44%) were metabolically unhealthy normal weight (MUH-NW), 8,314 (22.36%) were metabolically unhealthy overweight (MUH-OW), and 4,810 (12.94%) were metabolically unhealthy obese (MUO). The baseline characteristics of participants among the body mass index (BMI)-MetS categories were presented in Table 1. In addition to risk factors referred to MetS, the individuals in the metabolically unhealthy group were more likely to be older, male, less educated, a current smoker or alcoholic, and having slightly higher average income and salt intake. People who were overweight or obese had a larger WC than those with normal weight and this tendency was more pronounced in the metabolically unhealthy group.
Table 1. Characteristics of participants according to body mass index - metabolic health status at baseline.
| Variables | Metabolically healthy (n=19803) | Metabolically unhealthy (n=17377) | P-value | ||||||||||||||||||||||||||||||||||||||||||||||||||||||||||||||||||||||||||||||||||||||||||||||||
| Normal weight | Overweight | Obese | Normal weight | Overweight | Obese | ||||||||||||||||||||||||||||||||||||||||||||||||||||||||||||||||||||||||||||||||||||||||||||||
| n (%) | 10295 (27.69) | 7171 (19.29) | 2337 (6.29) | 4253 (11.44) | 8314 (22.36) | 4810 (12.94) | |||||||||||||||||||||||||||||||||||||||||||||||||||||||||||||||||||||||||||||||||||||||||||||
| Age, years | 52.27 ± 11.98 | 54.86 ± 11.54 | 53.94 ± 12.01 | 58.86 ± 11.74 | 59.00 ± 10.78 | 57.73 ± 11.11 | <0.001 | ||||||||||||||||||||||||||||||||||||||||||||||||||||||||||||||||||||||||||||||||||||||||||||
| Male, n (%) | 5715 (55.51) | 5230 (72.93) | 1777 (76.04) | 3097 (72.82) | 6634 (79.79) | 3874 (80.54) | <0.001 | ||||||||||||||||||||||||||||||||||||||||||||||||||||||||||||||||||||||||||||||||||||||||||||
| High school or above, n (%) | 4646 (45.17) | 2750 (38.42) | 854 (36.62) | 1311 (30.88) | 2570 (30.99) | 1525 (31.75) | <0.001 | ||||||||||||||||||||||||||||||||||||||||||||||||||||||||||||||||||||||||||||||||||||||||||||
| Average income ≥ ¥1000/month, n (%) | 5706 (59.82) | 3916 (58.62) | 1204 (54.85) | 2461 (61.42) | 4800 (61.66) | 2818 (62.25) | <0.001 | ||||||||||||||||||||||||||||||||||||||||||||||||||||||||||||||||||||||||||||||||||||||||||||
| Current smoker, n (%) | 2928 (28.46) | 2393 (33.41) | 778 (33.36) | 1573 (37.03) | 3137 (37.78) | 1759 (36.59) | <0.001 | ||||||||||||||||||||||||||||||||||||||||||||||||||||||||||||||||||||||||||||||||||||||||||||
| Current alcoholic, n (%) | 3178 (30.90) | 2701 (37.71) | 906 (38.85) | 1688 (39.74) | 3558 (42.85) | 1950 (40.57) | <0.001 | ||||||||||||||||||||||||||||||||||||||||||||||||||||||||||||||||||||||||||||||||||||||||||||
| Physical activity ≥ 3 times/week, n (%) | 1290 (12.54) | 1058 (14.78) | 317 (13.59) | 634 (14.94) | 1349 (16.26) | 683 (14.22) | <0.001 | ||||||||||||||||||||||||||||||||||||||||||||||||||||||||||||||||||||||||||||||||||||||||||||
| Salt intake ≥12 g/day, n (%) | 909 (8.84) | 723 (10.10) | 229 (9.82) | 485 (11.43) | 963 (11.61) | 661 (13.76) | <0.001 | ||||||||||||||||||||||||||||||||||||||||||||||||||||||||||||||||||||||||||||||||||||||||||||
| BMI, kg/m2 | 21.71 ± 1.45 | 25.72 ± 1.12 | 30.11 ± 2.17 | 22.30 ± 1.27 | 25.97 ± 1.13 | 30.30 ± 2.18 | <0.001 | ||||||||||||||||||||||||||||||||||||||||||||||||||||||||||||||||||||||||||||||||||||||||||||
| WC, cm | 79.49 ± 8.20 | 87.45 ± 7.74 | 93.39 ± 9.90 | 83.88 ± 8.40 | 90.13 ± 7.85 | 97.29 ± 9.44 | <0.001 | ||||||||||||||||||||||||||||||||||||||||||||||||||||||||||||||||||||||||||||||||||||||||||||
| Systolic blood pressure, mmHg | 117.33 ± 15.70 | 122.82 ± 16.16 | 94.27 ± 9.40 | 134.99 ± 17.11 | 137.01 ± 16.74 | 139.26 ± 16.58 | <0.001 | ||||||||||||||||||||||||||||||||||||||||||||||||||||||||||||||||||||||||||||||||||||||||||||
| Diastolic blood pressure, mmHg | 77.29 ± 9.47 | 80.92 ± 9.61 | 83.46 ± 10.45 | 86.28 ± 10.02 | 88.05 ± 9.89 | 90.36 ± 10.08 | <0.001 | ||||||||||||||||||||||||||||||||||||||||||||||||||||||||||||||||||||||||||||||||||||||||||||
| Fasting glucose, mmol/L | 5.05 ± 0.81 | 5.16 ± 0.91 | 5.15 ± 0.88 | 6.18 ± 1.79 | 6.35 ± 1.93 | 6.44 ± 1.97 | <0.001 | ||||||||||||||||||||||||||||||||||||||||||||||||||||||||||||||||||||||||||||||||||||||||||||
| Total cholesterol, mmol/L | 4.78 ± 1.35 | 4.87 ± 1.25 | 4.86 ± 0.86 | 5.20 ± 1.72 | 5.21 ± 1.17 | 5.19 ± 1.03 | <0.001 | ||||||||||||||||||||||||||||||||||||||||||||||||||||||||||||||||||||||||||||||||||||||||||||
| Triglycerides, mmol/L | 1.08 ± 0.62 | 1.29 ± 0.76 | 1.35 ± 0.75 | 2.04 ± 1.44 | 2.30 ± 1.50 | 2.45 ± 1.48 | <0.001 | ||||||||||||||||||||||||||||||||||||||||||||||||||||||||||||||||||||||||||||||||||||||||||||
| LDL-cholesterol, mmol/L | 2.42 ± 0.77 | 2.57 ± 0.85 | 2.60 ± 0.71 | 2.69 ± 1.44 | 2.72 ± 0.91 | 2.72 ± 1.13 | <0.001 | ||||||||||||||||||||||||||||||||||||||||||||||||||||||||||||||||||||||||||||||||||||||||||||
| HDL-cholesterol, mmol/L | 1.66 ± 0.46 | 1.57 ± 0.41 | 1.51 ± 0.38 | 1.53 ± 0.49 | 1.46 ± 0.45 | 1.41 ± 0.42 | <0.001 | ||||||||||||||||||||||||||||||||||||||||||||||||||||||||||||||||||||||||||||||||||||||||||||
| CRP, mg/L | 1.53 ± 3.65 | 2.02 ± 4.86 | 2.57 ± 5.50 | 2.19 ± 4.85 | 2.42 ± 4.18 | 3.05 ± 6.01 | <0.001 | ||||||||||||||||||||||||||||||||||||||||||||||||||||||||||||||||||||||||||||||||||||||||||||
| Hypertension, n (%) | 490 (4.76) | 619 (8.63) | 279 (11.94) | 898 (21.11) | 2319 (27.89) | 1574 (32.72) | <0.001 | ||||||||||||||||||||||||||||||||||||||||||||||||||||||||||||||||||||||||||||||||||||||||||||
| Hypertension medication, n (%) | 360 (3.50) | 443 (6.18) | 208 (8.90) | 674 (15.85) | 1763 (21.21) | 1214 (25.24) | <0.001 | ||||||||||||||||||||||||||||||||||||||||||||||||||||||||||||||||||||||||||||||||||||||||||||
| Diabetes, n (%) | 89 (0.86) | 109 (1.52) | 27 (1.16) | 367 (8.63) | 973 (11.70) | 532 (11.06) | <0.001 | ||||||||||||||||||||||||||||||||||||||||||||||||||||||||||||||||||||||||||||||||||||||||||||
| Diabetes medication, n (%) | 69 (0.67) | 82 (1.14) | 20 (0.86) | 303 (7.12) | 760 (9.14) | 418 (8.69) | <0.001 | ||||||||||||||||||||||||||||||||||||||||||||||||||||||||||||||||||||||||||||||||||||||||||||
| Dyslipidemia, n (%) | 134 (1.30) | 138 (1.92) | 39 (1.67) | 407 (9.57) | 1023 (12.30) | 7.04 (14.64) | <0.001 | ||||||||||||||||||||||||||||||||||||||||||||||||||||||||||||||||||||||||||||||||||||||||||||
| Dyslipidemia medication, n (%) | 36 (0.35) | 24 (0.33) | 14 (0.60) | 129 (3.03) | 321 (3.86) | 258 (5.36) | <0.001 | ||||||||||||||||||||||||||||||||||||||||||||||||||||||||||||||||||||||||||||||||||||||||||||
| History of MI | 36 (0.35) | 54 (0.51) | 12 (0.51) | 50 (1.18) | 115 (1.39) | 91 (1.89) | <0.001 | ||||||||||||||||||||||||||||||||||||||||||||||||||||||||||||||||||||||||||||||||||||||||||||
| History of stroke | 62 (0.60) | 56 (0.73) | 17 (0.73) | 80 (1.88) | 189 (2.28) | 84 (1.75) | <0.001 | ||||||||||||||||||||||||||||||||||||||||||||||||||||||||||||||||||||||||||||||||||||||||||||
| Values are (%) for categorical variables and mean ± SD or median (IQR) for continuous variables; BMI, body mass index; WC, waist circumstance; LDL, low-density lipoprotein; HDL, high-density lipoprotein; CRP, C-reactive protein. | |||||||||||||||||||||||||||||||||||||||||||||||||||||||||||||||||||||||||||||||||||||||||||||||||||
Cross-sectional investigation
8,182 cases of arterial stiffness were documented based on the first measurement of baPWV. Table 2 shows the odds ratios (ORs) for arterial stiffness stratified by BMI-MetS phenotypes. In the univariate analysis, the OR values were higher in other subgroups when compared with the MH-NW group, 1.35 (95% confidence interval [CI] 1.23-1.47) for MH-OW group, 1.46 (95%CI 1.29-1.65) for MHO group, 3.75 (95%CI 3.43-4.09) for MUH-NW group, 3.72 (95%CI 3.45-4.01) for MUH-OW group, and 3.08 (95%CI 2.83-3.36) for MUO group. In the multivariate analysis, similar results were obtained after adjusting for potential covariates in all three models. When taking baPWV as a continuous variable rather than dichotomous variable, significant β coefficients were obtained as well (P < 0.001, Table 3). It was notable that, in the context of metabolically healthy participants, the abnormality of baPWV increased with BMI categories. Whereas, the increasing tendency was not pronounced in metabolically unhealthy participants.
Table 2. Odds ratios and 95%CI for risk of baPWV ≥ 1800 cm/s according to the body mass index – metabolic health status.
| MH-NW | MH-OW | MHO | MUH-NW | MUH-OW | MUO | ||||||||||||||||||||||||||||||||||||||||||||||||||||||||||||||||||||||||||||||||||||||||||||||
| baPWV ≥ 1800 cm/s, n (%) | 1198 (11.64) | 1080 (15.06) | 377 (16.13) | 1405 (33.04) | 2733 (32.87) | 1389 (28.88) | |||||||||||||||||||||||||||||||||||||||||||||||||||||||||||||||||||||||||||||||||||||||||||||
| Univariate analysis | Ref. | 1.35 (1.23,1.47) | 1.46 (1.29,1.65) | 3.75 (3.43,4.09) | 3.72 (3.45,4.01) | 3.08 (2.83,3.36) | |||||||||||||||||||||||||||||||||||||||||||||||||||||||||||||||||||||||||||||||||||||||||||||
| Multivariate analysis | |||||||||||||||||||||||||||||||||||||||||||||||||||||||||||||||||||||||||||||||||||||||||||||||||||
| Model 1 | Ref. | 1.10 (1.10,1.10) | 1.28 (1.10,1.46) | 2.63 (2.38,2.90) | 2.55 (2.35,2.78) | 2.26 (2.05,2.48) | |||||||||||||||||||||||||||||||||||||||||||||||||||||||||||||||||||||||||||||||||||||||||||||
| Model 2 | Ref. | 1.10 (0.99,1.21) | 1.26 (1.09,1.44) | 2.58 (2.34,2.84) | 2.52 (2.31,2.74) | 2.24 (2.04,2.47) | |||||||||||||||||||||||||||||||||||||||||||||||||||||||||||||||||||||||||||||||||||||||||||||
| Model 3 | Ref. | 1.09 (0.99,1.20) | 1.24 (1.08,1.43) | 2.56 (2.32,2.82) | 2.50 (2.29,2.72) | 2.20 (2.00,2.43) | |||||||||||||||||||||||||||||||||||||||||||||||||||||||||||||||||||||||||||||||||||||||||||||
| Sensitivity analysis* | Ref. | 1.11 (1.00-1.22) | 1.26 (1.09-1.44) | 2.62 (2.37-2.90) | 2.53 (2.32-2.76) | 2.22 (2.01-2.45) | |||||||||||||||||||||||||||||||||||||||||||||||||||||||||||||||||||||||||||||||||||||||||||||
| Data are OR (95% CI) unless otherwise stated. | |||||||||||||||||||||||||||||||||||||||||||||||||||||||||||||||||||||||||||||||||||||||||||||||||||
| baPWV, branchial-ankle pulse wave velocity; MH-NW, metabolically healthy normal weight; MH-OW, metabolically healthy overweight; MHO, metabolically healthy obese; MUH-NW, metabolically unhealthy normal weight; MUH-OW, metabolically unhealthy overweight; MUO, metabolically unhealthy obese. | |||||||||||||||||||||||||||||||||||||||||||||||||||||||||||||||||||||||||||||||||||||||||||||||||||
| Model 1 adjusted for age and sex. | |||||||||||||||||||||||||||||||||||||||||||||||||||||||||||||||||||||||||||||||||||||||||||||||||||
| Model 2 adjusted for variates in model 1 plus educational level, average income, smoking, drinking, physical activity, sodium intake, history of myocardial infarction, and history of stroke. | |||||||||||||||||||||||||||||||||||||||||||||||||||||||||||||||||||||||||||||||||||||||||||||||||||
| Model 3 adjusted for variates in model 2 plus C-reactive protein. | |||||||||||||||||||||||||||||||||||||||||||||||||||||||||||||||||||||||||||||||||||||||||||||||||||
| *Sensitivity analysis excluded 811 participants with a history of cardiovascular disease. | |||||||||||||||||||||||||||||||||||||||||||||||||||||||||||||||||||||||||||||||||||||||||||||||||||
Table 3. Risk of baPWV according to the body mass index – metabolic health status.
| MH-NW | MH-OW | MHO | MUH-NW | MUH-OW | MUO | ||||||||||||||||||||||||||||||||||||||||||||||||||||||||||||||||||||||||||||||||||||||||||||||
| baPWV, m/s | 14.28 ± 3.25 | 15.01 ± 3.22 | 15.15 ± 3.22 | 16.97 ± 4.05 | 17.03 ± 3.81 | 16.61 ± 3.46 | |||||||||||||||||||||||||||||||||||||||||||||||||||||||||||||||||||||||||||||||||||||||||||||
| Univariate analysis | Ref. | 0.74 (0.64,0.85) | 0.88 (0.72,1.03) | 2.69 (2.57,2.83) | 2.76 (2.66,2.86) | 2.33 (2.21,2.45) | |||||||||||||||||||||||||||||||||||||||||||||||||||||||||||||||||||||||||||||||||||||||||||||
| Multivariate analysis | |||||||||||||||||||||||||||||||||||||||||||||||||||||||||||||||||||||||||||||||||||||||||||||||||||
| Model 1 | Ref. | 0.16 (0.07,0.25) | 0.39 (0.26,0.53) | 1.53 (1.43,1.65) | 1.49 (1.41,1.59) | 1.24 (1.14,1.35) | |||||||||||||||||||||||||||||||||||||||||||||||||||||||||||||||||||||||||||||||||||||||||||||
| Model 2 | Ref. | 0.16 (0.06,0.25) | 0.37 (0.24,0.51) | 1.52 (1.41,1.62) | 1.48 (1.41,1.57) | 1.23 (1.12,1.33) | |||||||||||||||||||||||||||||||||||||||||||||||||||||||||||||||||||||||||||||||||||||||||||||
| Model 3 | Ref. | 0.14 (0.05,0.24) | 0.35 (0.21,0.49) | 1.50 (1.39,1.61) | 1.46 (1.37,1.55) | 1.19 (1.09,1.30) | |||||||||||||||||||||||||||||||||||||||||||||||||||||||||||||||||||||||||||||||||||||||||||||
| Sensitivity analysis* | Ref. | 0.16 (0.06,0.25) | 0.37 (0.24,0.51) | 1.53 (1.42,1.64) | 1.47 (1.38,1.56) | 1.22 (1.11,1.33) | |||||||||||||||||||||||||||||||||||||||||||||||||||||||||||||||||||||||||||||||||||||||||||||
| Data are β - coefficients (95% CI) unless otherwise stated. | |||||||||||||||||||||||||||||||||||||||||||||||||||||||||||||||||||||||||||||||||||||||||||||||||||
| baPWV, branchial-ankle pulse wave velocity; MH-NW, metabolically healthy normal weight; MH-OW, metabolically healthy overweight; MHO, metabolically healthy obese; MUH-NW, metabolically unhealthy normal weight; MUH-OW, metabolically unhealthy overweight; MUO, metabolically unhealthy obese. | |||||||||||||||||||||||||||||||||||||||||||||||||||||||||||||||||||||||||||||||||||||||||||||||||||
| Model 1 adjusted for age and sex. | |||||||||||||||||||||||||||||||||||||||||||||||||||||||||||||||||||||||||||||||||||||||||||||||||||
| Model 2 adjusted for variates in model 1 plus educational level, average income, smoking, drinking, physical activity, sodium intake, history of myocardial infarction, and history of stroke. | |||||||||||||||||||||||||||||||||||||||||||||||||||||||||||||||||||||||||||||||||||||||||||||||||||
| Model 3 adjusted for variates in model 2 plus C-reactive protein. | |||||||||||||||||||||||||||||||||||||||||||||||||||||||||||||||||||||||||||||||||||||||||||||||||||
| *Sensitivity analysis excluded 811 participants with a history of cardiovascular disease. | |||||||||||||||||||||||||||||||||||||||||||||||||||||||||||||||||||||||||||||||||||||||||||||||||||
Longitudinal investigation
16,236 participants with follow-up measurements of baPWV were eventually included in the longitudinal study. The average increases of baPWV were 0.35 m/s, 0.42 m/s, 0.36 m/s, 0.43m/s, 0.31m/s, and 0.40 m/s in the six BMI-MetS phenotypes over the follow-up period. In comparison with MH-NW group, crude β coefficients per risk category increase were 0.27 (95%CI 0.16-0.38), 0.24 (95%CI 0.07-0.41), 0.66 (95%CI 0.52-0.80), 0.64 (95%CI 0.52-0.75), and 0.62 (95%CI 0.48-0.75), respectively. The results of multivariate analysis, in which conventional risk factors were adjusted, shown robust consistency with univariate analysis (p < 0.001, Table 4).
Table 4. Risk of change of baPWV according to the body mass index – metabolic health status.
| MH-NW (n=5036) | MH-OW (n=3244) | MHO (n=993) | MUH-NW (n=1671) | MUH-OW (n=3398) | MUO (n=1894) | ||||||||||||||||||||||||||||||||||||||||||||||||||||||||||||||||||||||||||||||||||||||||||||||
| Change of baPWV, m/s | 0.35 (-0.53,1.35) | 0.42 (-0.55,1.52) | 0.36 (-0.76,1.53) | 0.43 (-0.82,1.87) | 0.31 (-0.92,1.70) | 0.40 (-0.85,1.79) | |||||||||||||||||||||||||||||||||||||||||||||||||||||||||||||||||||||||||||||||||||||||||||||
| Univariate analysis | Ref. | 0.27 (0.16,0.38) | 0.24 (0.07,0.41) | 0.66 (0.52,0.80) | 0.64 (0.52,0.75) | 0.62 (0.48,0.75) | |||||||||||||||||||||||||||||||||||||||||||||||||||||||||||||||||||||||||||||||||||||||||||||
| Multivariate analysis | |||||||||||||||||||||||||||||||||||||||||||||||||||||||||||||||||||||||||||||||||||||||||||||||||||
| Model 1 | Ref. | 0.14 (0.04,0.25) | 0.19 (0.03,0.36) | 0.52 (0.38,0.66) | 0.46 (0.34,0.57) | 0.49 (0.36,0.62) | |||||||||||||||||||||||||||||||||||||||||||||||||||||||||||||||||||||||||||||||||||||||||||||
| Model 2 | Ref. | 0.14 (0.04,0.25) | 0.19 (0.02,0.35) | 0.52 (0.38,0.65) | 0.45 (0.35,0.57) | 0.49 (0.36,0.62) | |||||||||||||||||||||||||||||||||||||||||||||||||||||||||||||||||||||||||||||||||||||||||||||
| Model 3 | Ref. | 0.14 (0.04,0.25) | 0.18 (0.02,0.35) | 0.51 (0.38,0.65) | 0.46 (0.35,0.57) | 0.49 (0.36,0.62) | |||||||||||||||||||||||||||||||||||||||||||||||||||||||||||||||||||||||||||||||||||||||||||||
| Model 3 with IPW* | Ref. | 0.17 (0.10,0.24) | 0.23 (0.11,0.34) | 0.58 (0.43,0.72) | 0.56 (0.44,0.68) | 0.64 (0.50,0.77) | |||||||||||||||||||||||||||||||||||||||||||||||||||||||||||||||||||||||||||||||||||||||||||||
| Sensitivity analysis† | Ref. | 0.14 (0.02,0.24) | 0.18 (0.01,0.35) | 0.49 (0.35,0.63) | 0.44 (0.33,0.56) | 0.45 (0.32,0.59) | |||||||||||||||||||||||||||||||||||||||||||||||||||||||||||||||||||||||||||||||||||||||||||||
| Data are β - coefficients (95% CI) unless otherwise stated. | |||||||||||||||||||||||||||||||||||||||||||||||||||||||||||||||||||||||||||||||||||||||||||||||||||
| baPWV, branchial-ankle pulse wave velocity; MH-NW, metabolically healthy normal weight; MH-OW, metabolically healthy overweight; MHO, metabolically healthy obese; MUH-NW, metabolically unhealthy normal weight; MUH-OW, metabolically unhealthy overweight; MUO, metabolically unhealthy obese; IPW, inverse probability weighting. | |||||||||||||||||||||||||||||||||||||||||||||||||||||||||||||||||||||||||||||||||||||||||||||||||||
| Model 1 adjusted for age and sex. | |||||||||||||||||||||||||||||||||||||||||||||||||||||||||||||||||||||||||||||||||||||||||||||||||||
| Model 2 adjusted for variates in model 1 plus educational level, average income, smoking, drinking, physical activity, sodium intake, history of myocardial infarction, and history of stroke. | |||||||||||||||||||||||||||||||||||||||||||||||||||||||||||||||||||||||||||||||||||||||||||||||||||
| Model 3 adjusted for variates in model 2 plus C-reactive protein. | |||||||||||||||||||||||||||||||||||||||||||||||||||||||||||||||||||||||||||||||||||||||||||||||||||
| *Shown is the primary analysis with an odds ratio from the multivariable logistic regression model with the same strata and covariates with IPTW according to the propensity score. The analysis included all the patients with baseline baPWV. | |||||||||||||||||||||||||||||||||||||||||||||||||||||||||||||||||||||||||||||||||||||||||||||||||||
| †Sensitivity analysis excluded 275 participants with a history of cardiovascular disease. | |||||||||||||||||||||||||||||||||||||||||||||||||||||||||||||||||||||||||||||||||||||||||||||||||||
44.80% (7,273/16,236) participants of the cohort study had a normal baPWV at baseline, amongst them 1,419 cases of new occurrence arterial stiffness were identified during the 10-year follow-up period. The rate of new abnormal baPWV events increased gradually from MH-NW to MUO phenotype. After adjustment for age and sex, the growth trend remained in metabolically healthy participants, but not in metabolically unhealthy participants. Model 2 and model 3 showed consistent results with model 1. In the fully adjusted model, a 1.4-fold, 2.2-fold increased risk for the new occurrence of arterial stiffness were documented in MHO and MUO compared to MH-NW controls. The results of sensitivity analysis excluding participants with a history of CVD remained statistically significant. Additional information was given in Table 5.
Table 5. Odds ratios and 95%CI for risk of new occurrence of baPWV abnormality (baPWV≥ 1800 cm/s) according to the body mass index – metabolic health status.
| MH-NW | MH-OW | MHO | MUH-NW | MUH-OW | MUO | ||||||||||||||||||||||||||||||||||||||||||||||||||||||||||||||||||||||||||||||||||||||||||||||
| baPWV ≥ 1800 cm/s, n (%) | 257 (5.55) | 245 (8.46) | 76 (8.61) | 198 (16.43) | 414 (16.63) | 229 (15.58) | |||||||||||||||||||||||||||||||||||||||||||||||||||||||||||||||||||||||||||||||||||||||||||||
| Univariate analysis | Ref. | 1.57 (1.31,1.88) | 1.60 (1.23,2.09) | 3.34 (2.74,4.07) | 3.39 (2.88,4.00) | 3.14 (2.60,3.79) | |||||||||||||||||||||||||||||||||||||||||||||||||||||||||||||||||||||||||||||||||||||||||||||
| Multivariate analysis | |||||||||||||||||||||||||||||||||||||||||||||||||||||||||||||||||||||||||||||||||||||||||||||||||||
| Model 1 | Ref. | 1.24 (1.03,1.50) | 1.37 (1.04,1.80) | 2.34 (1.90,2.88) | 2.24 (1.88,2.66) | 2.22 (1.82,2.71) | |||||||||||||||||||||||||||||||||||||||||||||||||||||||||||||||||||||||||||||||||||||||||||||
| Model 2 | Ref. | 1.25 (1.04,1.51) | 1.27 (1.04,1.80) | 2.31 (1.87,2.84) | 2.25 (1.89,2.67) | 2.21 (1.81,2.70) | |||||||||||||||||||||||||||||||||||||||||||||||||||||||||||||||||||||||||||||||||||||||||||||
| Model 3 | Ref. | 1.25 (1.04,1.52) | 1.37 (1.03,1.80) | 2.31 (1.87,2.84) | 2.25 (1.89,2.67) | 2.21 (1.81,2.70) | |||||||||||||||||||||||||||||||||||||||||||||||||||||||||||||||||||||||||||||||||||||||||||||
| Model 3 with IPW* | Ref. | 1.25 (1.14,1.37) | 1.46 (1.27,1.66) | 2.22 (1.94,2.54) | 2.25 (2.03,2.50) | 2.35 (2.09,2.64) | |||||||||||||||||||||||||||||||||||||||||||||||||||||||||||||||||||||||||||||||||||||||||||||
| Sensitivity analysis† | Ref. | 1.22 (1.01,1.46) | 1.41 (1.08,1.84) | 2.29 (1.87,2.81) | 2.21 (1.87,2.62) | 2.12 (1.75,2.58) | |||||||||||||||||||||||||||||||||||||||||||||||||||||||||||||||||||||||||||||||||||||||||||||
| Data are OR (95% CI) unless otherwise stated. | |||||||||||||||||||||||||||||||||||||||||||||||||||||||||||||||||||||||||||||||||||||||||||||||||||
| baPWV, branchial-ankle pulse wave velocity; MH-NW, metabolically healthy normal weight; MH-OW, metabolically healthy overweight; MHO, metabolically healthy obese; MUH-NW, metabolically unhealthy normal weight; MUH-OW, metabolically unhealthy overweight; MUO, metabolically unhealthy obese; IPW, inverse probability weighting. | |||||||||||||||||||||||||||||||||||||||||||||||||||||||||||||||||||||||||||||||||||||||||||||||||||
| Model 1 adjusted for age and sex. | |||||||||||||||||||||||||||||||||||||||||||||||||||||||||||||||||||||||||||||||||||||||||||||||||||
| Model 2 adjusted for variates in model 1 plus educational level, average income, smoking, drinking, physical activity, sodium intake, history of myocardial infarction, and history of stroke. | |||||||||||||||||||||||||||||||||||||||||||||||||||||||||||||||||||||||||||||||||||||||||||||||||||
| Model 3 adjusted for variates in model 2 plus C-reactive protein. | |||||||||||||||||||||||||||||||||||||||||||||||||||||||||||||||||||||||||||||||||||||||||||||||||||
| *Shown is the primary analysis with an odds ratio from the multivariable logistic regression model with the same strata and covariates with IPTW according to the propensity score. The analysis included all the patients with baseline baPWV. | |||||||||||||||||||||||||||||||||||||||||||||||||||||||||||||||||||||||||||||||||||||||||||||||||||
| †Sensitivity analysis excluded 275 participants with a history of cardiovascular disease. | |||||||||||||||||||||||||||||||||||||||||||||||||||||||||||||||||||||||||||||||||||||||||||||||||||
Stratified analysis
Metabolic health status was an interaction factor between BMI and arterial stiffness in all study participants (P=0.0001 for cross-sectional study and P=0.0238 for longitudinal study). In metabolically health participants, BMI demonstrated a dose-dependent increase in the risk of abnormal baPWV, with adjusted ORs of 1.07 (95%CI 0.97-1.18), 1.22 (95%CI 1.06-1.41) in the overweight and obese group. By contrast, no relation was found in participants with MetS in the cross-sectional study. These results were further validated in the cohort study (Table 6).
Table 6. Odds ratio and 95%CI for risk of baPWV≥ 1800 cm/s according to the body mass index stratified by different metabolic health status.
| Normal weight | Overweight | Obese | P for interaction | ||||||||||||||||||||||||||||||||||||||||||||||||||||||||||||||||||||||||||||||||||||||||||||||||
| Baseline of baPWV ≥ 1800 cm/s, n (%) | |||||||||||||||||||||||||||||||||||||||||||||||||||||||||||||||||||||||||||||||||||||||||||||||||||
| MH | Ref. | 1.07 (0.97,1.18) | 1.22 (1.06,1.41) | 0.0001 | |||||||||||||||||||||||||||||||||||||||||||||||||||||||||||||||||||||||||||||||||||||||||||||||
| MUH | Ref. | 0.98 (0.90,1.07) | 0.86 (0.78,0.95) | ||||||||||||||||||||||||||||||||||||||||||||||||||||||||||||||||||||||||||||||||||||||||||||||||
| New occurrence of baPWV ≥ 1800 cm/s, n (%) | |||||||||||||||||||||||||||||||||||||||||||||||||||||||||||||||||||||||||||||||||||||||||||||||||||
| MH | Ref. | 1.19 (0.98,1.44) | 1.30 (1.02,1.72) | 0.0238 | |||||||||||||||||||||||||||||||||||||||||||||||||||||||||||||||||||||||||||||||||||||||||||||||
| MUH | Ref. | 0.99 (0.82,1.21) | 0.98 (0.79,1.22) | ||||||||||||||||||||||||||||||||||||||||||||||||||||||||||||||||||||||||||||||||||||||||||||||||
| Data are OR (95% CI) unless otherwise stated. | |||||||||||||||||||||||||||||||||||||||||||||||||||||||||||||||||||||||||||||||||||||||||||||||||||
| baPWV, branchial-ankle pulse wave velocity; MH, metabolically healthy; MUH, metabolically unhealthy. | |||||||||||||||||||||||||||||||||||||||||||||||||||||||||||||||||||||||||||||||||||||||||||||||||||
| Adjusted for age, sex, educational level, average income, smoking, drinking, physical activity, sodium intake, history of myocardial infarction, history of stroke, and C-reactive protein. | |||||||||||||||||||||||||||||||||||||||||||||||||||||||||||||||||||||||||||||||||||||||||||||||||||
Discussion
This study assessed the cross-sectional and longitudinal associations between BMI-MetS phenotypes and baPWV (either as a continuous or dichotomous variable). We found that metabolic health status and BMI categories contributed to the progression of arterial stiffness synchronously, and MHO was an intermediate stage between metabolically healthy and unhealthy status, instead of a benign phenotype. Moreover, BMI categories were correlated with abnormal baPWV in metabolically healthy participants. While the relationship disappeared in metabolically unhealthy participants, for whom MetS itself was the dominant risk factor for arterial stiffness.
The prevalence of MHO in the Chinese population varied from 4.2% to 11.4% due to the heterogeneous definition [16, 17]. In our study, the prevalence of MHO was 6.29% in the general population and 32.7% in obese subjects. Previous studies focused on the relationship between MHO and the risk of CVD. According to the research results, MetS and its components (hypertension, glucose intolerance, and dyslipidemia) are all documented independent risk factors for baPWV [7]. However, the impact of obesity on baPWV showed inconsistent results. A cross-sectional study observed a positive correlation between central obesity and arterial stiffness in China [6]. Lin L et al. demonstrated that transient MHO conferred an increased risk of abnormal baPWV [18]. Several studies reported that obese individuals had youthful arteries with lower PWV [19, 20]. By contrast, some studies found an irrelevant association between them [21, 22]. Obesity often coexists with other risk factors and accelerates arterial stiffness through its associated metabolic abnormalities. Although MetS is served as a risk enhancer, it is difficult to predict CVD risk quantitatively due to the mediating role of obesity. To take the contribution of obesity and other cardiometabolic risk factors separately, we thus used a modified harmonized IDF-MetS definition and subdivided it by the degree of obesity. The present study indicated that obesity did interact with metabolic status and BMI was positively associated with baPWV only in metabolically healthy participants.
It is noteworthy that BMI cannot fully reflect body composition and adiposity distribution. Those with excess visceral fat exhibited a greater risk of CVD than those with subcutaneous fat. WC is a more reliable index capable of differentiating between overall adiposity and abdominal adiposity among the same BMI range [23]. In our study, a significant positive correlation between WC and BMI categories was observed, which could partially offset the inadequacies of BMI. Beyond that, the issue of obesity paradox has aroused great concern. Although obesity contributes to the development of CVD, the long-term prognosis of obese individuals is often better due to their superior cardiorespiratory fitness against acute stress [24]. In terms of pathophysiological mechanisms, there was no paradoxical association between obesity and subclinical CVD as adipose tissue could impair vascular function through specific hormones and proinflammatory cytokines [25].
The strength of this study is its combined cross-sectional and longitudinal aspects. Nonetheless, there are still some limitations. First, the harmless feature of metabolically healthy phenotype was hung in doubt given the definition of MetS. There were 75.9% of MHO participants having one metabolic risk factor in our study. which could exert an additional effect on baPWV apart from obesity. Secondly, accumulated evidence indicated that MHO was not only an intermediate-stage, but also a transit condition from metabolically healthy to unhealthy status [14, 15]. Because of the relatively short follow-up time, the conversion of MHO status was not included in our statistics. Further study is needed to provide insight into the dynamic relationship between metabolically healthy obese phenotype and arterial stiffness.
In conclusion, both metabolic health status and BMI categories contribute to the progression of arterial stiffness, while BMI is positively associated with arterial stiffness only in metabolically healthy participants due to its fully mediating role through associated metabolic risk factors. Moreover, MHO is an intermediate stage between metabolically healthy and unhealthy status rather than a benign status, which highlights the need for active weight reduction and risk factor management.
Materials and Methods
Ethics
The study was conducted in accordance with guidelines from the Helsinki Declaration and was approved by the Ethics Committees of both Kailuan General Hospital and Beijing Tiantan Hospital. All participants or their legal representatives provided written informed consent (Trial registration: ChiCTR-TNRC-11001489).
Study population
The Kailuan study is an ongoing prospective cohort study, details about the design and methods of this study have been published in detail previously [26]. From March 1, 2010, to January 31, 2020, 38,482 participants underwent both the baPWV measurement and questionnaire survey in the Kailuan cohort study. Among them, 31 participants without complete baPWV values and 559 participants without complete data regarded to BMI or MetS were excluded. Additionally, 712 individuals with a BMI below 18.5 kg/m2 were excluded. A total of 37,180 participants with at least one-time measurement of baPWV were included in the cross-sectional analysis. 16,236 participants, with repeated measurement of baPWV during a median follow-ups period of 2.8 years, were further included in the longitudinal study (Figure 1). Baseline characteristics between follow-up and lost-to-follow-up participants were shown in Supplementary Table 1.
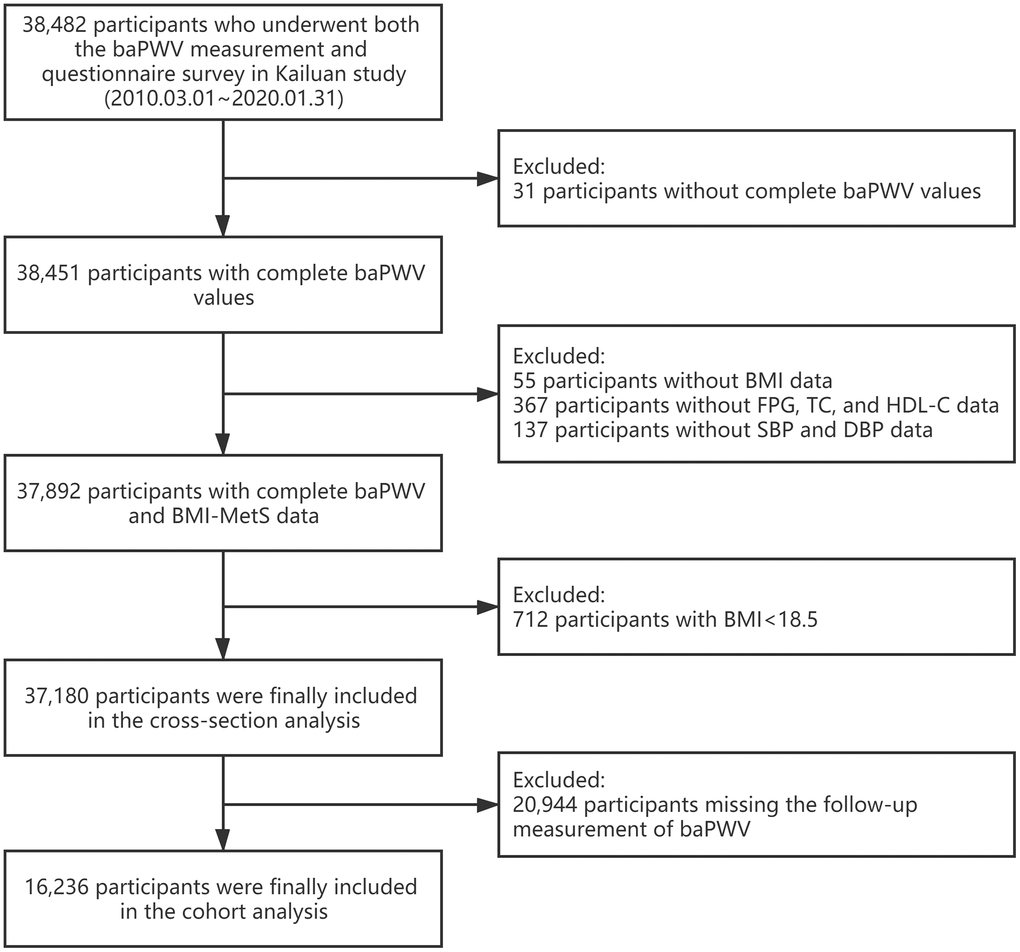
Figure 1. Flow chart for selection of study participants. baPWV, branchial-ankle pulse wave velocity; BMI, body mass index; FBG, fasting blood glucose; TC, total cholesterol; HDL-C, high-density lipoprotein cholesterol; SBP, systolic blood pressure; DBP, diastolic blood pressure; MetS, metabolic syndrome.
Definitions of obesity, metabolic syndrome, and metabolically healthy obese phenotype
BMI was calculated as weight divided by the square of height (kg/m2). According to the Working Group on Obesity in China, BMI was categorized as normal weight (18.5≤BMI<24.0 kg/m2), overweight (24.0≤BMI<28.0 kg/m2), and obesity (BMI≥28.0 kg/m2) [27]. MetS was defined as having 2 or more abnormalities of the following components based on the modified harmonized International Diabetes Federation (IDF) criteria [5], (1) systolic blood pressure (BP) ≥ 130 mmHg, diastolic BP ≥ 85 mmHg, use of antihypertension medication, or self-reported history of hypertension; (2) fasting blood glucose ≥ 5.6 mmol/L (100 mg/dL), current use of anti-diabetic medication, or self-reported history of diabetes; (3) triglycerides ≥ 1.7 mmol/L (150 mg/dL) or current use of lipid-lowering medication; (4) high-density lipoprotein cholesterol < 1.0 mmol/L (40 mg/dL) for men and < 1.3 mmol/L (50 mg/dL) for women. WC was not included in the definition of MetS, due to its collinearity with BMI [28].
Combing the BMI categories and metabolic health status together, participants were then divided into six groups: MH-NW, MH-OW, MHO, MUH-NW, MUH-OW, and MUO.
Measurement of baPWV
Bilateral baPWV was evaluated by utilizing an automatic arteriosclerosis detection device (BP-203RPE III; Omron Healthcare Co., Kyoto, Japan). Information of the participants was recorded prior to the measurement, including age, sex, height, and weight. Before the examination, participants should stay away from cigarettes, caffeinated or alcoholic beverages for at least 3 h and have a minimum resting time of 5 min in a supine position. Cuffs were attached to both the upper arms and ankles with certain strain. The lower border of the branchial cuff was tied 2-3 cm above the cubital fossa transverse, and the lower border of the ankle cuff was tied 1-2 cm above the medial malleolus. The cardiechema collecting device was placed at the left border of the sternum, with electrodes clipping to both waists for electrocardiography acquisition. The measurement of baPWV was repeated twice by trained nurses, and the second value was recorded. The maximum value of left- and right-side baPWV was used in further analysis. BaPWV ≥1800 cm/s was considered as arterial stiffness [29]. Moreover, the second measurement of baPWV was performed during the two-year interval follow-ups. The change of baPWV was calculated as re-examined baPWV subtracting baseline baPWV, and the new occurrence of baPWV abnormality was defined as normal baPWV at baseline but abnormal baPWV at follow-up.
Other baseline measurements
Data on demographic characteristics as age, sex, education level, average income, smoking status, drinking status, physical activity, salt intake, past medical history (including hypertension, diabetes, dyslipidemia, myocardial infarction, stroke), and current medication were self-reported on a questionnaire at baseline. WC and BP were measured on admission. Fasting glucose, total cholesterol, triglycerides, low-density lipoprotein, high-density lipoprotein, and C-reactive protein were analyzed by an auto-analyzer (Hitachi 747; Hitachi, Tokyo, Japan) at the central laboratory of the Kailuan hospital.
Statistical analysis
Continuous variables were expressed as mean ± standard deviation (SD) or median (interquartile range, IQR), categorical variables were presented as count (percentage). The ANOVA or nonparametric Kruskal-Wallis test was used to compare group differences for continuous variables, and χ2 test was used for categories variables.
Linear and logistic regression analyses were used to assess the association between BMI-metabolic status phenotypes and baseline baPWV in mono-factor and multi-factor models. To verify the causality of obesity status or metabolic syndrome on baPWV, indicated as the change of baPWV or the new occurrence of arterial stiffness, we further performed linear and logistic regression models in participants of the longitudinal study with β coefficients and ORs calculated. Multiple regression models were run as follows. Model 1 was adjusted for age and sex. Model 2 was adjusted for variates in model 1 plus educational level, average income, smoking, drinking, physical activity, sodium intake, history of myocardial infarction, and history of stroke. Model 3 was further adjusted for C-reactive protein. Inverse probability weighting (IPW) was used to minimize selection bias. Weights were based on results from a model of follow-up status, estimated using logistic regression with being followed up or not as the dependent variables and atherogenic risk factors as independent variables. We used the multivariate logistic regression analyses, before and after IPW, to assess whether BMI-MetS phenotypes were associated with higher odds of the change or new occurrence of baPWV abnormality. Sensitivity analyses excluding participants with a history of CVD in both cross-sectional and longitudinal analyses were conducted. Additionally, stratified analysis was performed to assess the cross-sectional as well as the longitudinal association between BMI and metabolic health status. All statistical analyses were performed using SAS software, version 9.4 (SAS Institute, Cary, NC, USA), and a 2-sided value of P<0.05 was considered statistically significant.
Supplementary Materials
Author Contributions
Anxin Wang and Yu Wang performed the experiments, interpreted the results of statistical analysis, and drafted the manuscript. Yingting Zuo, Xue Tian, Shuohua Chen, Yihan Ma, and Xu Han conducted the statistical analysis and interpreted the data. Shouling Wu revising the manuscript for intellectual content. Shouling Wu and Xingquan Zhao had full access to all of the data and take responsibility for the integrity of the data and the accuracy of the data analysis.
Acknowledgments
We gratefully appreciate all the participants and staff for their contributions.
Conflicts of Interest
The authors declare that they have no conflicts of interest.
Funding
The Kailuan study was supported by grants from Beijing Municipal Administration of Hospitals Incubating Program (PX2020021), Beijing Excellent Talents Training Program (2018000021469G234), Young Elite Scientists Sponsorship Program by CAST (2018QNRC001), and National Key R&D Program of China (2017YFC1310902).
References
- 1. Meyer ML, Tanaka H, Palta P, Patel MD, Camplain R, Couper D, Cheng S, Al Qunaibet A, Poon AK, Heiss G. Repeatability of Central and Peripheral Pulse Wave Velocity Measures: The Atherosclerosis Risk in Communities (ARIC) Study. Am J Hypertens. 2016; 29:470–75. https://doi.org/10.1093/ajh/hpv127 [PubMed]
- 2. Ohkuma T, Ninomiya T, Tomiyama H, Kario K, Hoshide S, Kita Y, Inoguchi T, Maeda Y, Kohara K, Tabara Y, Nakamura M, Ohkubo T, Watada H, et al, and Collaborative Group for J-BAVEL (Japan Brachial-Ankle Pulse Wave Velocity Individual Participant Data Meta-Analysis of Prospective Studies)*. Brachial-Ankle Pulse Wave Velocity and the Risk Prediction of Cardiovascular Disease: An Individual Participant Data Meta-Analysis. Hypertension. 2017; 69:1045–52. https://doi.org/10.1161/HYPERTENSIONAHA.117.09097 [PubMed]
- 3. Munakata M. Brachial-ankle pulse wave velocity in the measurement of arterial stiffness: recent evidence and clinical applications. Curr Hypertens Rev. 2014; 10:49–57. https://doi.org/10.2174/157340211001141111160957 [PubMed]
- 4. Alberti KG, Zimmet P, Shaw J. Metabolic syndrome--a new world-wide definition. A Consensus Statement from the International Diabetes Federation. Diabet Med. 2006; 23:469–80. https://doi.org/10.1111/j.1464-5491.2006.01858.x [PubMed]
- 5. Alberti KG, Eckel RH, Grundy SM, Zimmet PZ, Cleeman JI, Donato KA, Fruchart JC, James WP, Loria CM, Smith SC
Jr , and International Diabetes Federation Task Force on Epidemiology and Prevention, and Hational Heart, Lung, and Blood Institute, and American Heart Association, and World Heart Federation, and International Atherosclerosis Society, and International Association for the Study of Obesity. Harmonizing the metabolic syndrome: a joint interim statement of the International Diabetes Federation Task Force on Epidemiology and Prevention; National Heart, Lung, and Blood Institute; American Heart Association; World Heart Federation; International Atherosclerosis Society; and International Association for the Study of Obesity. Circulation. 2009; 120:1640–45. https://doi.org/10.1161/CIRCULATIONAHA.109.192644 [PubMed] - 6. Chen L, Zhu W, Mai L, Fang L, Ying K. The association of metabolic syndrome and its components with brachial-ankle pulse wave velocity in south China. Atherosclerosis. 2015; 240:345–50. https://doi.org/10.1016/j.atherosclerosis.2015.03.031 [PubMed]
- 7. Wang A, Su Z, Liu X, Yang Y, Chen S, Wang S, Luo Y, Guo X, Zhao X, Wu S. Brachial-ankle pulse wave velocity and metabolic syndrome in general population: the APAC study. BMC Cardiovasc Disord. 2016; 16:228. https://doi.org/10.1186/s12872-016-0409-x [PubMed]
- 8. Gomez-Sanchez L, Garcia-Ortiz L, Patino-Alonso MC, Recio-Rodriguez JI, Fernando R, Marti R, Agudo-Conde C, Rodriguez-Sanchez E, Maderuelo-Fernandez JA, Ramos R, Gomez-Marcos MA, and MARK Group. Association of metabolic syndrome and its components with arterial stiffness in Caucasian subjects of the MARK study: a cross-sectional trial. Cardiovasc Diabetol. 2016; 15:148. https://doi.org/10.1186/s12933-016-0465-7 [PubMed]
- 9. Hu L, Huang X, You C, Li J, Hong K, Li P, Wu Y, Wu Q, Wang Z, Gao R, Bao H, Cheng X. Prevalence of overweight, obesity, abdominal obesity and obesity-related risk factors in southern China. PLoS One. 2017; 12:e0183934. https://doi.org/10.1371/journal.pone.0183934 [PubMed]
- 10. Mallat S, Jurjus A, Bou Assi T, Jurjus A, Shams A, El Sayegh S, Berbari A. Markers of arterial stiffness in a sample of Lebanese subjects with Grade I essential hypertension. SAGE Open Med. 2017; 5:2050312117712886. https://doi.org/10.1177/2050312117712886 [PubMed]
- 11. Gomez-Sanchez L, Garcia-Ortiz L, Patino-Alonso MC, Recio-Rodriguez JI, Rigo F, Martí R, Agudo-Conde C, Rodriguez-Sanchez E, Maderuelo-Fernandez JA, Ramos R, Gomez-Marcos MA, and MARK Group. Adiposity measures and arterial stiffness in primary care: the MARK prospective observational study. BMJ Open. 2017; 7:e016422. https://doi.org/10.1136/bmjopen-2017-016422 [PubMed]
- 12. Guo F, Garvey WT. Cardiometabolic disease risk in metabolically healthy and unhealthy obesity: Stability of metabolic health status in adults. Obesity (Silver Spring). 2016; 24:516–25. https://doi.org/10.1002/oby.21344 [PubMed]
- 13. Li Z, Guo X, Liu Y, Zhang N, Chang Y, Chen Y, Sun Y, Abraham MR. Metabolism rather than obesity is associated with ischemic stroke: a cross-sectional study in rural Northeastern China. Springerplus. 2016; 5:1419. https://doi.org/10.1186/s40064-016-3088-2 [PubMed]
- 14. Eckel N, Li Y, Kuxhaus O, Stefan N, Hu FB, Schulze MB. Transition from metabolic healthy to unhealthy phenotypes and association with cardiovascular disease risk across BMI categories in 90 257 women (the Nurses’ Health Study): 30 year follow-up from a prospective cohort study. Lancet Diabetes Endocrinol. 2018; 6:714–24. https://doi.org/10.1016/S2213-8587(18)30137-2 [PubMed]
- 15. Kouvari M, Panagiotakos DB, Yannakoulia M, Georgousopoulou E, Critselis E, Chrysohoou C, Tousoulis D, Pitsavos C, and ATTICA Study Investigators. Transition from metabolically benign to metabolically unhealthy obesity and 10-year cardiovascular disease incidence: The ATTICA cohort study. Metabolism. 2019; 93:18–24. https://doi.org/10.1016/j.metabol.2019.01.003 [PubMed]
- 16. Li H, He D, Zheng D, Amsalu E, Wang A, Tao L, Guo J, Li X, Wang W, Guo X. Metabolically healthy obese phenotype and risk of cardiovascular disease: Results from the China Health and Retirement Longitudinal Study. Arch Gerontol Geriatr. 2019; 82:1–7. https://doi.org/10.1016/j.archger.2019.01.004 [PubMed]
- 17. Liu C, Wang C, Guan S, Liu H, Wu X, Zhang Z, Gu X, Zhang Y, Zhao Y, Tse LA, Fang X. The Prevalence of Metabolically Healthy and Unhealthy Obesity according to Different Criteria. Obes Facts. 2019; 12:78–90. https://doi.org/10.1159/000495852 [PubMed]
- 18. Lin L, Zhang J, Jiang L, Du R, Hu C, Lu J, Wang T, Li M, Zhao Z, Xu Y, Xu M, Bi Y, Ning G, et al. Transition of metabolic phenotypes and risk of subclinical atherosclerosis according to BMI: a prospective study. Diabetologia. 2020; 63:1312–23. https://doi.org/10.1007/s00125-020-05116-5 [PubMed]
- 19. Won KB, Chang HJ, Niinuma H, Niwa K, Jeon K, Cho IJ, Shim CY, Hong GR, Chung N. Inverse association between central obesity and arterial stiffness in Korean subjects with metabolic syndrome: a cross-sectional cohort study. Diabetol Metab Syndr. 2015; 7:3. https://doi.org/10.1186/1758-5996-7-3 [PubMed]
- 20. Holroyd EW, Sirker A, Kwok CS, Kontopantelis E, Ludman PF, De Belder MA, Butler R, Cotton J, Zaman A, Mamas MA, and British Cardiovascular Intervention Society and National Institute of Cardiovascular Outcomes Research. The Relationship of Body Mass Index to Percutaneous Coronary Intervention Outcomes: Does the Obesity Paradox Exist in Contemporary Percutaneous Coronary Intervention Cohorts? Insights From the British Cardiovascular Intervention Society Registry. JACC Cardiovasc Interv. 2017; 10:1283–92. https://doi.org/10.1016/j.jcin.2017.03.013 [PubMed]
- 21. Yuan Y, Mu JJ, Chu C, Zheng WL, Wang Y, Hu JW, Ma Q, Yan Y, Liao YY, Chen C. Effect of metabolically healthy obesity on the development of arterial stiffness: a prospective cohort study. Nutr Metab (Lond). 2020; 17:50. https://doi.org/10.1186/s12986-020-00474-8 [PubMed]
- 22. Lee HJ, Kim HL, Chung J, Lim WH, Seo JB, Kim SH, Zo JH, Kim MA. Interaction of Metabolic Health and Obesity on Subclinical Target Organ Damage. Metab Syndr Relat Disord. 2018; 16:46–53. https://doi.org/10.1089/met.2017.0078 [PubMed]
- 23. Jayedi A, Soltani S, Zargar MS, Khan TA, Shab-Bidar S. Central fatness and risk of all cause mortality: systematic review and dose-response meta-analysis of 72 prospective cohort studies. BMJ. 2020; 370:m3324. https://doi.org/10.1136/bmj.m3324 [PubMed]
- 24. Elagizi A, Kachur S, Lavie CJ, Carbone S, Pandey A, Ortega FB, Milani RV. An Overview and Update on Obesity and the Obesity Paradox in Cardiovascular Diseases. Prog Cardiovasc Dis. 2018; 61:142–50. https://doi.org/10.1016/j.pcad.2018.07.003 [PubMed]
- 25. Duque AP, Rodrigues Junior LF, Mediano MF, Tibiriça E, De Lorenzo A. Emerging concepts in metabolically healthy obesity. Am J Cardiovasc Dis. 2020; 10:48–61. [PubMed]
- 26. Wang A, Wu J, Zhou Y, Guo X, Luo Y, Wu S, Zhao X. Measures of adiposity and risk of stroke in China: a result from the Kailuan study. PLoS One. 2013; 8:e61665. https://doi.org/10.1371/journal.pone.0061665 [PubMed]
- 27. Chen C, Lu FC, and Department of Disease Control Ministry of Health, PR China. The guidelines for prevention and control of overweight and obesity in Chinese adults. Biomed Environ Sci. 2004; 17:1–36. [PubMed]
- 28. Hinnouho GM, Czernichow S, Dugravot A, Batty GD, Kivimaki M, Singh-Manoux A. Metabolically healthy obesity and risk of mortality: does the definition of metabolic health matter? Diabetes Care. 2013; 36:2294–300. https://doi.org/10.2337/dc12-1654 [PubMed]
- 29. Takashima N, Turin TC, Matsui K, Rumana N, Nakamura Y, Kadota A, Saito Y, Sugihara H, Morita Y, Ichikawa M, Hirose K, Kawakani K, Hamajima N, et al. The relationship of brachial-ankle pulse wave velocity to future cardiovascular disease events in the general Japanese population: the Takashima Study. J Hum Hypertens. 2014; 28:323–27. https://doi.org/10.1038/jhh.2013.103 [PubMed]