


Introduction
The morbidity rate of rheumatoid arthritis (RA), a leading cause of work disability, ranges from 0.32% to 0.36% in China. The highest morbidity of 0.5% has been reported in northeast China [1]. RA lesions are categorized into two major types—synovitis and pannus [2]. Synovitis refers to the inflammation of the synovial membrane lining a joint, whereas pannus involves the formation of irreversible pathological lesions in extra-articular joints and synovial tissue proliferation that can worsen the prognosis of RA. In addition, pannus RA increases the risk of cardiovascular disease (CVD) and other diseases such as stroke.
Elevated inflammatory levels and lipid abnormalities in RA patients are independent risk factors for atherosclerosis, stroke, and other CVD [3–6]. In addition, the risk of stroke among RA patients is associated with elevated levels of erythrocyte sedimentation rate (ESR), high-density lipoprotein (HDL) cholesterol [7], total cholesterol (TC), triglycerides (TG), anti-cyclic citrullinated peptide (anti-CCP) antibodies [8], low-density lipoprotein (LDL) cholesterol, and C-reactive protein (CRP) [8–11]. Although these quantitative descriptors are routinely detected in RA patients clinically and reported in electronic medical records (EMRs), clinicians lack the ability to interpret them and often ignore their clinical significance. Because most chronic diseases are a cumulative effect of several weak risk factors, statistically combining their effects could help to more robustly predict the risk and change the clinical management and decision-making process. Several risk prediction tools are increasingly being used in clinical medicine [12–14], such as the Framingham risk score (FRS) [15, 16], to determine clinical guidelines. The FRS tool for predicting cardiovascular events includes risk factors such as age, systolic blood pressure (SBP), diabetes mellitus, cigarette smoking, prior CVD, atrial fibrillation (AF), left ventricular hypertrophy (LVH), and the use of hypotensive medications. It is widely applicable (with calibration) to culturally diverse populations in Europe, the Mediterranean region, and Asia [17]. Similar effective coronary heart disease (CHD) risk prediction algorithms have been developed by other investigators worldwide [18–20].
We have previously reported that elevated ESR, LDL levels, and CRP levels ≥230 mg/L were independent risk factors for RA patients in developing stroke [21]. In addition, we developed and validated a nomogram to predict CHD in RA patients in northern China [22]. Numerous studies have reported a higher risk of stroke in RA patients compared with the general population. Here, we developed and validated a nomogram incorporating serum lipids and inflammatory markers for individual risk prediction of stroke in RA patients and compared its diagnostic and prognostic ability with that of FRS.
Results
Baseline demographics and clinical characteristics
The study included 218 RA with stroke patients and 1,136 RA patients in the primary cohort. The validation cohort comprised 95 RA with stroke patients and 486 RA patients. The clinical characteristics of patients are listed in Table 1. The baseline clinical data were similar between primary and validation cohorts. As shown in Table 2, univariate LR analysis of RA patients developing stroke indicated that the stratification of sex, age, SBP, CRP, ESR, TC, LDL and the history of hypertension, diabetes, AF, CVD, and CHD, were significantly different between RA with stroke and RA groups (P < 0.05) in the primary cohort.
Table 1. Participants’ characteristics in primary and validation cohorts.
| Variables | Cohort No. (%) | χ² | P-value | ||||||||||||||||||||||||||||||||||||||||||||||||||||||||||||||||||||||||||||||||||||||||||||||||
| Primary cohort (1,354) | Validation cohort (581) | ||||||||||||||||||||||||||||||||||||||||||||||||||||||||||||||||||||||||||||||||||||||||||||||||||
| RA with stroke | 218 (16.10) | 95 (16.35) | 0.019 | 0.891 | |||||||||||||||||||||||||||||||||||||||||||||||||||||||||||||||||||||||||||||||||||||||||||||||
| Sex, female | 1021 (75.41) | 428 (73.67) | 0.655 | 0.419 | |||||||||||||||||||||||||||||||||||||||||||||||||||||||||||||||||||||||||||||||||||||||||||||||
| Age, year | |||||||||||||||||||||||||||||||||||||||||||||||||||||||||||||||||||||||||||||||||||||||||||||||||||
| 18–65 | 757 (55.91) | 308 (53.01) | 1.386 | 0.500 | |||||||||||||||||||||||||||||||||||||||||||||||||||||||||||||||||||||||||||||||||||||||||||||||
| 66–79 | 426 (31.46) | 194 (33.39) | |||||||||||||||||||||||||||||||||||||||||||||||||||||||||||||||||||||||||||||||||||||||||||||||||
| ≥80 | 171 (12.63) | 79 (13.60) | |||||||||||||||||||||||||||||||||||||||||||||||||||||||||||||||||||||||||||||||||||||||||||||||||
| SBP, mm Hg | |||||||||||||||||||||||||||||||||||||||||||||||||||||||||||||||||||||||||||||||||||||||||||||||||||
| <120 | 422 (31.17) | 194 (33.39) | 7.511 | 0.111 | |||||||||||||||||||||||||||||||||||||||||||||||||||||||||||||||||||||||||||||||||||||||||||||||
| 120–139 | 592 (43.72) | 240 (41.31) | |||||||||||||||||||||||||||||||||||||||||||||||||||||||||||||||||||||||||||||||||||||||||||||||||
| 140–159 | 287 (21.20) | 114 (19.62) | |||||||||||||||||||||||||||||||||||||||||||||||||||||||||||||||||||||||||||||||||||||||||||||||||
| 160–179 | 46 (3.40) | 24 (4.13) | |||||||||||||||||||||||||||||||||||||||||||||||||||||||||||||||||||||||||||||||||||||||||||||||||
| ≥180 | 7 (0.52) | 9 (1.55) | |||||||||||||||||||||||||||||||||||||||||||||||||||||||||||||||||||||||||||||||||||||||||||||||||
| Smoking | 176 (13.00) | 84 (14.46) | 0.744 | 0.388 | |||||||||||||||||||||||||||||||||||||||||||||||||||||||||||||||||||||||||||||||||||||||||||||||
| Diabetes | 190 (14.03) | 97 (16.70) | 2.282 | 0.131 | |||||||||||||||||||||||||||||||||||||||||||||||||||||||||||||||||||||||||||||||||||||||||||||||
| CHD | 208 (15.36) | 104 (17.90) | 1.937 | 0.164 | |||||||||||||||||||||||||||||||||||||||||||||||||||||||||||||||||||||||||||||||||||||||||||||||
| AF | 40 (2.95) | 17 (2.93) | 0.001 | 0.973 | |||||||||||||||||||||||||||||||||||||||||||||||||||||||||||||||||||||||||||||||||||||||||||||||
| LVH* | 1 (0.07) | 1 (0.17) | - | 0.510 | |||||||||||||||||||||||||||||||||||||||||||||||||||||||||||||||||||||||||||||||||||||||||||||||
| CVD | 436 (32.20) | 198 (34.08) | 0.651 | 0.420 | |||||||||||||||||||||||||||||||||||||||||||||||||||||||||||||||||||||||||||||||||||||||||||||||
| Hypertension | 240 (17.73) | 153 (26.33) | 18.615 | <0.001 | |||||||||||||||||||||||||||||||||||||||||||||||||||||||||||||||||||||||||||||||||||||||||||||||
| Bio-med | 22 (1.62) | 12 (2.07) | 0.457 | 0.499 | |||||||||||||||||||||||||||||||||||||||||||||||||||||||||||||||||||||||||||||||||||||||||||||||
| CCP+ | 827 (61.08) | 337 (58.00) | 1.604 | 0.205 | |||||||||||||||||||||||||||||||||||||||||||||||||||||||||||||||||||||||||||||||||||||||||||||||
| RF+ | 908 (67.06) | 381 (65.58) | 0.403 | 0.526 | |||||||||||||||||||||||||||||||||||||||||||||||||||||||||||||||||||||||||||||||||||||||||||||||
| CRP, mg/L | |||||||||||||||||||||||||||||||||||||||||||||||||||||||||||||||||||||||||||||||||||||||||||||||||||
| <10 | 319 (23.56) | 157 (27.02) | 3.769 | 0.152 | |||||||||||||||||||||||||||||||||||||||||||||||||||||||||||||||||||||||||||||||||||||||||||||||
| ≥9.06nd<64.32 | 670 (49.48) | 287 (49.40) | |||||||||||||||||||||||||||||||||||||||||||||||||||||||||||||||||||||||||||||||||||||||||||||||||
| ≥64.32 | 365 (26.96) | 137 (23.58) | |||||||||||||||||||||||||||||||||||||||||||||||||||||||||||||||||||||||||||||||||||||||||||||||||
| ESR, mm/H | |||||||||||||||||||||||||||||||||||||||||||||||||||||||||||||||||||||||||||||||||||||||||||||||||||
| <29 | 351 (25.92) | 137 (23.58) | 2.368 | 0.306 | |||||||||||||||||||||||||||||||||||||||||||||||||||||||||||||||||||||||||||||||||||||||||||||||
| ≥29nd<84.80 | 662 (48.89) | 280 (48.19) | |||||||||||||||||||||||||||||||||||||||||||||||||||||||||||||||||||||||||||||||||||||||||||||||||
| ≥84.8 | 341 (25.18) | 164 (28.23) | |||||||||||||||||||||||||||||||||||||||||||||||||||||||||||||||||||||||||||||||||||||||||||||||||
| C3, g/L | |||||||||||||||||||||||||||||||||||||||||||||||||||||||||||||||||||||||||||||||||||||||||||||||||||
| <0.95 | 345 (25.48) | 155 (26.68) | 0.890 | 0.641 | |||||||||||||||||||||||||||||||||||||||||||||||||||||||||||||||||||||||||||||||||||||||||||||||
| ≥0.95nd<1.34 | 673 (49.7) | 293 (50.43) | |||||||||||||||||||||||||||||||||||||||||||||||||||||||||||||||||||||||||||||||||||||||||||||||||
| ≥1.34 | 336 (24.82) | 133 (22.89) | |||||||||||||||||||||||||||||||||||||||||||||||||||||||||||||||||||||||||||||||||||||||||||||||||
| C4, g/L | |||||||||||||||||||||||||||||||||||||||||||||||||||||||||||||||||||||||||||||||||||||||||||||||||||
| <0.18 | 378 (27.92) | 146 (25.13) | 5.450 | 0.066 | |||||||||||||||||||||||||||||||||||||||||||||||||||||||||||||||||||||||||||||||||||||||||||||||
| ≥0.18nd<0.28 | 656 (48.45) | 315 (54.22) | |||||||||||||||||||||||||||||||||||||||||||||||||||||||||||||||||||||||||||||||||||||||||||||||||
| ≥0.28 | 320 (23.63) | 120 (20.65) | |||||||||||||||||||||||||||||||||||||||||||||||||||||||||||||||||||||||||||||||||||||||||||||||||
| FBG, mmol/L | |||||||||||||||||||||||||||||||||||||||||||||||||||||||||||||||||||||||||||||||||||||||||||||||||||
| <4.84 | 336 (24.82) | 154 (26.51) | 2.052 | 0.358 | |||||||||||||||||||||||||||||||||||||||||||||||||||||||||||||||||||||||||||||||||||||||||||||||
| ≥4.84nd<6.33 | 670 (49.48) | 295 (50.77) | |||||||||||||||||||||||||||||||||||||||||||||||||||||||||||||||||||||||||||||||||||||||||||||||||
| ≥6.33 | 348 (25.70) | 132 (22.72) | |||||||||||||||||||||||||||||||||||||||||||||||||||||||||||||||||||||||||||||||||||||||||||||||||
| TC, mmol/L | |||||||||||||||||||||||||||||||||||||||||||||||||||||||||||||||||||||||||||||||||||||||||||||||||||
| <5.2 | 1131 (83.53) | 479 (82.44) | 6.259 | 0.044 | |||||||||||||||||||||||||||||||||||||||||||||||||||||||||||||||||||||||||||||||||||||||||||||||
| ≥5.2nd<66.2 | 163 (12.04) | 61 (10.50) | |||||||||||||||||||||||||||||||||||||||||||||||||||||||||||||||||||||||||||||||||||||||||||||||||
| ≥6.2 | 60 (4.43) | 41 (7.06) | |||||||||||||||||||||||||||||||||||||||||||||||||||||||||||||||||||||||||||||||||||||||||||||||||
| LDL, mmol/L | |||||||||||||||||||||||||||||||||||||||||||||||||||||||||||||||||||||||||||||||||||||||||||||||||||
| <3.4 | 1106 (81.68) | 463 (79.69) | 6.278 | 0.043 | |||||||||||||||||||||||||||||||||||||||||||||||||||||||||||||||||||||||||||||||||||||||||||||||
| ≥3.4nd<4.1 | 182 (13.44) | 73 (12.56) | |||||||||||||||||||||||||||||||||||||||||||||||||||||||||||||||||||||||||||||||||||||||||||||||||
| ≥4.1 | 66 (4.87) | 45 (7.75) | |||||||||||||||||||||||||||||||||||||||||||||||||||||||||||||||||||||||||||||||||||||||||||||||||
| HDL, mmol/L | |||||||||||||||||||||||||||||||||||||||||||||||||||||||||||||||||||||||||||||||||||||||||||||||||||
| ≥1.55 | 125 (9.23) | 46 (7.92) | 4.119 | 0.128 | |||||||||||||||||||||||||||||||||||||||||||||||||||||||||||||||||||||||||||||||||||||||||||||||
| ≥1.04nd<1.55 | 570 (42.10) | 273 (46.99) | |||||||||||||||||||||||||||||||||||||||||||||||||||||||||||||||||||||||||||||||||||||||||||||||||
| <1.04 | 659 (48.67) | 262 (45.09) | |||||||||||||||||||||||||||||||||||||||||||||||||||||||||||||||||||||||||||||||||||||||||||||||||
| TG, mmol/L | |||||||||||||||||||||||||||||||||||||||||||||||||||||||||||||||||||||||||||||||||||||||||||||||||||
| <1.7 | 1,113 (82.20) | 460 (79.17) | 2.697 | 0.260 | |||||||||||||||||||||||||||||||||||||||||||||||||||||||||||||||||||||||||||||||||||||||||||||||
| ≥1.7nd<2.3 | 139 (10.27) | 73 (12.56) | |||||||||||||||||||||||||||||||||||||||||||||||||||||||||||||||||||||||||||||||||||||||||||||||||
| ≥2.3 | 102 (7.53) | 48 (8.26) | |||||||||||||||||||||||||||||||||||||||||||||||||||||||||||||||||||||||||||||||||||||||||||||||||
| Data are represented as numbers and proportions. Statistics were calculated using the chi-square test. *Statistics were calculated by Fisher’s exact test. Abbreviations: RA: rheumatoid arthritis; SBP: systolic blood pressure; CHD: coronary heart disease; AF: atrial fibrillation; LVH: left ventricular hypertrophy; CVD: cardiovascular disease; Bio-med: biologic disease-modifying anti-rheumatic drugs; CCP+: positive anti-cyclic citrullinated peptide antibody; RF+: positive rheumatoid factor; CRP: C-reactive protein; ESR: erythrocyte sedimentation rate; C3: complement 3; C4: complement 4; FBG: fasting blood glucose; TC: total cholesterol; LDL: low-density lipoprotein; HDL: high-density lipoprotein; TG: triglycerides. | |||||||||||||||||||||||||||||||||||||||||||||||||||||||||||||||||||||||||||||||||||||||||||||||||||
Table 2. Univariate logistic regression analysis of RA patients developing stroke in the primary cohort.
| Variables | RA (1,136) | RA with stroke (218) | OR (95% CI) | P-value | |||||||||||||||||||||||||||||||||||||||||||||||||||||||||||||||||||||||||||||||||||||||||||||||
| Sex, female vs. male | 873 (76.85) | 148 (67.89) | 0.64 (0.46–0.88) | 0.005 | |||||||||||||||||||||||||||||||||||||||||||||||||||||||||||||||||||||||||||||||||||||||||||||||
| Age, year | <0.001 | ||||||||||||||||||||||||||||||||||||||||||||||||||||||||||||||||||||||||||||||||||||||||||||||||||
| 66–79 vs. 18–65 | 336 (29.58) | 90 (41.28) | 2.90 (2.05–4.10) | ||||||||||||||||||||||||||||||||||||||||||||||||||||||||||||||||||||||||||||||||||||||||||||||||
| ≥80 vs. 18–65 | 107 (9.42) | 64 (29.36) | 6.48 (4.33–9.68) | ||||||||||||||||||||||||||||||||||||||||||||||||||||||||||||||||||||||||||||||||||||||||||||||||
| SBP, mmHg | <0.001 | ||||||||||||||||||||||||||||||||||||||||||||||||||||||||||||||||||||||||||||||||||||||||||||||||||
| 120–139 vs.<120 | 503 (44.28) | 89 (40.83) | 1.45 (0.99–2.12) | ||||||||||||||||||||||||||||||||||||||||||||||||||||||||||||||||||||||||||||||||||||||||||||||||
| 140–159 vs.<120 | 224 (19.72) | 63 (28.90) | 2.30 (1.52–3.48) | ||||||||||||||||||||||||||||||||||||||||||||||||||||||||||||||||||||||||||||||||||||||||||||||||
| 160–179 vs.<120 | 29 (2.55) | 17 (7.80) | 4.79 (2.45–9.39) | ||||||||||||||||||||||||||||||||||||||||||||||||||||||||||||||||||||||||||||||||||||||||||||||||
| ≥180 vs.<120 | 4 (0.35) | 3 (1.38) | 6.13 (1.33–28.25) | ||||||||||||||||||||||||||||||||||||||||||||||||||||||||||||||||||||||||||||||||||||||||||||||||
| Smoking | 145 (12.76) | 31 (14.22) | 1.13 (0.75–1.72) | 0.558 | |||||||||||||||||||||||||||||||||||||||||||||||||||||||||||||||||||||||||||||||||||||||||||||||
| Diabetes | 142 (12.50) | 48 (22.02) | 1.98 (1.37–2.85) | <0.001 | |||||||||||||||||||||||||||||||||||||||||||||||||||||||||||||||||||||||||||||||||||||||||||||||
| CVD* | 218 (19.19) | 218 (100) | – | <0.001 | |||||||||||||||||||||||||||||||||||||||||||||||||||||||||||||||||||||||||||||||||||||||||||||||
| CHD | 130 (11.44) | 78 (35.78) | 4.31 (3.09–6.01) | <0.001 | |||||||||||||||||||||||||||||||||||||||||||||||||||||||||||||||||||||||||||||||||||||||||||||||
| AF | 22 (1.94) | 18 (8.26) | 4.56 (2.40–8.65) | <0.001 | |||||||||||||||||||||||||||||||||||||||||||||||||||||||||||||||||||||||||||||||||||||||||||||||
| LVH* | 0 (0) | 1 (0.46) | - | 0.161 | |||||||||||||||||||||||||||||||||||||||||||||||||||||||||||||||||||||||||||||||||||||||||||||||
| Hypertension | 164 (14.44) | 76 (34.86) | 3.17 (2.29–4.39) | <0.001 | |||||||||||||||||||||||||||||||||||||||||||||||||||||||||||||||||||||||||||||||||||||||||||||||
| Bio-med | 21 (1.85) | 1 (0.46) | 0.25 (0.03–1.83) | 0.236 | |||||||||||||||||||||||||||||||||||||||||||||||||||||||||||||||||||||||||||||||||||||||||||||||
| CCP+ | 698 (61.44) | 129 (59.17) | 0.91 (0.68–1.22) | 0.529 | |||||||||||||||||||||||||||||||||||||||||||||||||||||||||||||||||||||||||||||||||||||||||||||||
| RF+ | 766 (67.43) | 142 (65.14) | 0.90 (0.67–1.24) | 0.510 | |||||||||||||||||||||||||||||||||||||||||||||||||||||||||||||||||||||||||||||||||||||||||||||||
| CRP, mg/L | 0.007 | ||||||||||||||||||||||||||||||||||||||||||||||||||||||||||||||||||||||||||||||||||||||||||||||||||
| ≥9.06 and <64.32 vs. <10 | 570 (50.18) | 100 (45.87) | 1.19 (0.81, 1.76) | ||||||||||||||||||||||||||||||||||||||||||||||||||||||||||||||||||||||||||||||||||||||||||||||||
| ≥64.32 vs. <10 | 288 (25.35) | 77 (35.32) | 1.81 (1.20–2.74) | ||||||||||||||||||||||||||||||||||||||||||||||||||||||||||||||||||||||||||||||||||||||||||||||||
| ESR, mm/H | 0.037 | ||||||||||||||||||||||||||||||||||||||||||||||||||||||||||||||||||||||||||||||||||||||||||||||||||
| ≥29 and <84.80 vs. <29 | 553 (48.68) | 109 (50) | 0.58 (0.38–0.88) | ||||||||||||||||||||||||||||||||||||||||||||||||||||||||||||||||||||||||||||||||||||||||||||||||
| ≥84.8 vs. <29 | 275 (24.21) | 66 (30.28) | 0.82 (0.59–1.15) | ||||||||||||||||||||||||||||||||||||||||||||||||||||||||||||||||||||||||||||||||||||||||||||||||
| C3, g/L | 0.516 | ||||||||||||||||||||||||||||||||||||||||||||||||||||||||||||||||||||||||||||||||||||||||||||||||||
| ≥0.95 and <1.34 vs. <0.95 | 567 (49.91) | 106 (48.62) | 0.85 (0.61–1.20) | ||||||||||||||||||||||||||||||||||||||||||||||||||||||||||||||||||||||||||||||||||||||||||||||||
| ≥1.34 vs. <0.95 | 286 (25.18) | 50 (22.94) | 0.80 (0.53–1.20) | ||||||||||||||||||||||||||||||||||||||||||||||||||||||||||||||||||||||||||||||||||||||||||||||||
| C4, g/L | 0.786 | ||||||||||||||||||||||||||||||||||||||||||||||||||||||||||||||||||||||||||||||||||||||||||||||||||
| ≥0.18 and <0.28 vs. <0.18 | 550 (48.42) | 106 (48.62) | 0.95 (0.67–1.33) | ||||||||||||||||||||||||||||||||||||||||||||||||||||||||||||||||||||||||||||||||||||||||||||||||
| ≥0.28 vs. <0.18 | 272 (23.94) | 48 (22.02) | 0.87 (0.58–1.30) | ||||||||||||||||||||||||||||||||||||||||||||||||||||||||||||||||||||||||||||||||||||||||||||||||
| FBG, mmol/L | 0.652 | ||||||||||||||||||||||||||||||||||||||||||||||||||||||||||||||||||||||||||||||||||||||||||||||||||
| ≥4.84 and <6.33 vs. <4.84 | 556 (48.94) | 114 (52.29) | 1.12 (0.78–1.60) | ||||||||||||||||||||||||||||||||||||||||||||||||||||||||||||||||||||||||||||||||||||||||||||||||
| ≥6.33 vs. <4.84 | 296 (26.06) | 52 (23.85) | 0.96 (0.63–1.46) | ||||||||||||||||||||||||||||||||||||||||||||||||||||||||||||||||||||||||||||||||||||||||||||||||
| TC, mmol/L | 0.038 | ||||||||||||||||||||||||||||||||||||||||||||||||||||||||||||||||||||||||||||||||||||||||||||||||||
| ≥5.2 and <66.2 vs. <5.2 | 143 (12.59) | 20 (9.17) | 0.73 (0.45–1.20) | ||||||||||||||||||||||||||||||||||||||||||||||||||||||||||||||||||||||||||||||||||||||||||||||||
| ≥6.2 vs. <5.2 | 44 (3.87) | 16 (7.34) | 1.90 (1.05–3.43) | ||||||||||||||||||||||||||||||||||||||||||||||||||||||||||||||||||||||||||||||||||||||||||||||||
| LDL, mmol/L | 0.004 | ||||||||||||||||||||||||||||||||||||||||||||||||||||||||||||||||||||||||||||||||||||||||||||||||||
| ≥3.4 and<4.1 vs. <3.4 | 138 (12.15) | 44 (20.18) | 1.87 (1.28–2.73) | ||||||||||||||||||||||||||||||||||||||||||||||||||||||||||||||||||||||||||||||||||||||||||||||||
| ≥4.1 vs. <3.4 | 53 (4.67) | 13 (5.96) | 1.44 (0.77–2.70) | ||||||||||||||||||||||||||||||||||||||||||||||||||||||||||||||||||||||||||||||||||||||||||||||||
| HDL, mmol/L | 0.774 | ||||||||||||||||||||||||||||||||||||||||||||||||||||||||||||||||||||||||||||||||||||||||||||||||||
| ≥1.04 and <1.55 vs. ≥1.55 | 483 (42.52) | 87 (39.91) | 0.89 (0.53–1.50) | ||||||||||||||||||||||||||||||||||||||||||||||||||||||||||||||||||||||||||||||||||||||||||||||||
| <1.04 vs. ≥1.55 | 549 (48.33) | 110 (50.46) | 0.99 (0.60–1.66) | ||||||||||||||||||||||||||||||||||||||||||||||||||||||||||||||||||||||||||||||||||||||||||||||||
| TG, mmol/L | 0.186 | ||||||||||||||||||||||||||||||||||||||||||||||||||||||||||||||||||||||||||||||||||||||||||||||||||
| ≥1.7 and <2.3 vs. <1.7 | 114 (10.04) | 25 (11.47) | 1.11 (0.70–1.77) | ||||||||||||||||||||||||||||||||||||||||||||||||||||||||||||||||||||||||||||||||||||||||||||||||
| ≥2.3 vs. <1.7 | 92 (8.10) | 10 (4.59) | 0.55 (0.28–1.08) | ||||||||||||||||||||||||||||||||||||||||||||||||||||||||||||||||||||||||||||||||||||||||||||||||
| Data are represented as numbers and proportions. Statistics were conducted using univariate logistic regression. Abbreviations: RA: rheumatoid arthritis; OR (95% CI), odds ratio, 95% confidence interval; SBP: systolic blood pressure; CHD: coronary heart disease; AF: atrial fibrillation; LVH: left ventricular hypertrophy; CVD: cardiovascular disease; Bio-med: biologic disease-modifying anti-rheumatic drugs; CCP+: positive anti-cyclic citrullinated peptide antibody; RF+: positive rheumatoid factor; CRP: C-reactive protein; ESR: erythrocyte sedimentation rate; C3: complement 3; C4: complement 4; FBG: fasting blood glucose; TC: total cholesterol; LDL: low-density lipoprotein; HDL: high-density lipoprotein; TG: triglycerides. | |||||||||||||||||||||||||||||||||||||||||||||||||||||||||||||||||||||||||||||||||||||||||||||||||||
Development of an individualized prediction model
All variables in this analysis are listed in Table 2. These were carefully selected to ensure parsimony and practicality of the final model (noted in the Methods section). We finally identified the following 10 variables with the strongest association with stroke risk: sex, age, SBP, CRP, ESR, TC, LDL, and history of hypertension, diabetes, AF, and CHD. Based on the final complex model of multivariate analysis shown in Figure 1, several variables were independently associated with stroke among RA patients, such as sex (0.63 [0.45–0.91]), AF (2.27 [1.08–4.68]), CHD (2.49 [1.70–3.64]), hypertension (2.08 [1.44–3.00]), SBP stratification (for 140–159 vs.<120, 1.64 [1.04–2.61]; for 160–179 vs. <120, 2.44 [1.13–5.20]), CRP stratification (for ≥64.32 vs. <9.06, 1.67 [1.05–2.68]), ESR stratification (for ≥84.8 vs. <29, 1.64 [1.03–2.62]), TC stratification (for ≥6.2 vs.<5.2, 0.35 [0.17–0.70], LDL stratification (for 3.4–4.1 vs.<3.4, 4.45 [2.35–8.68]; for ≥4.1 vs.<3.4, 4.22 [1.66–10.69]). The final simple model of multivariate analysis is shown in Figure 1. A comprehensive analysis of vital indicators of machine learning models, shown in Figure 2 and Supplementary Table 1, reveals that the effect of the LR model on nomogram was better compared with other machine learning models. In addition, the LR algorithm effectively predicted the current data, simultaneously indicating the better efficiency of the complex model than the simple model. Finally, the complex model was used to create the nomogram by incorporating the above independent predictors (Figure 3). The nomogram revealed the score of influencing factors, the personal total cumulative score, and the predicted risk value of the individual outcome event for RA patients.
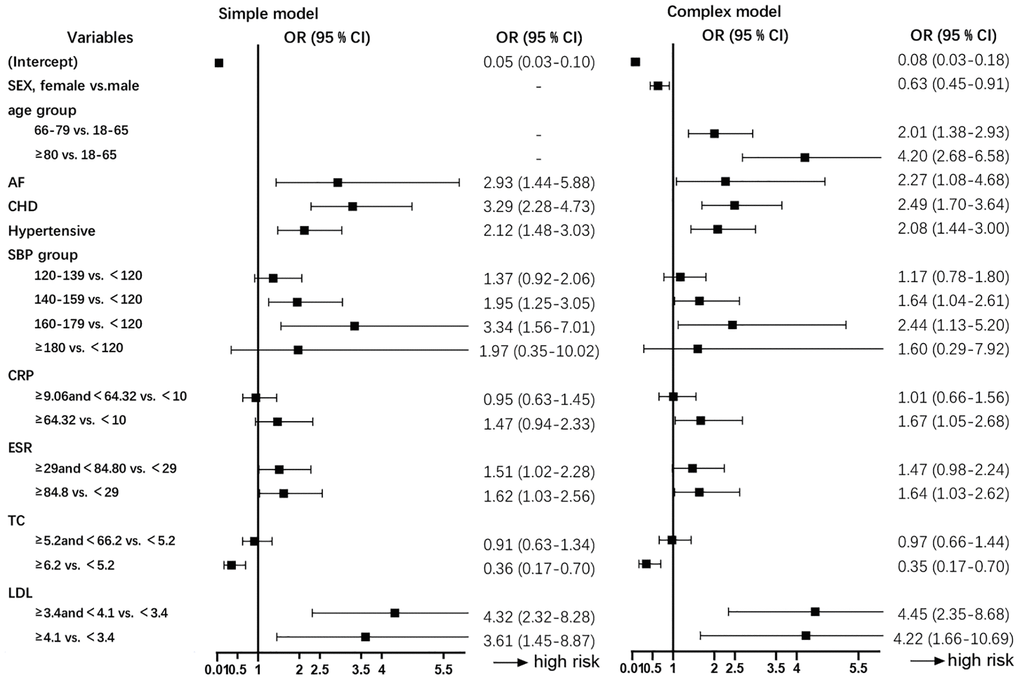
Figure 1. Multivariate logistic regression analysis of data from RA patients developing stroke in the primary cohort (N = 1,354). Abbreviations: SBP: systolic blood pressure; CHD: coronary heart disease; AF: atrial fibrillation; CRP: C-reactive protein; ESR: erythrocyte sedimentation rate; TC: total cholesterol; LDL: low-density lipoprotein; OR (95% CI): odds ratio, 95% confidence interval.
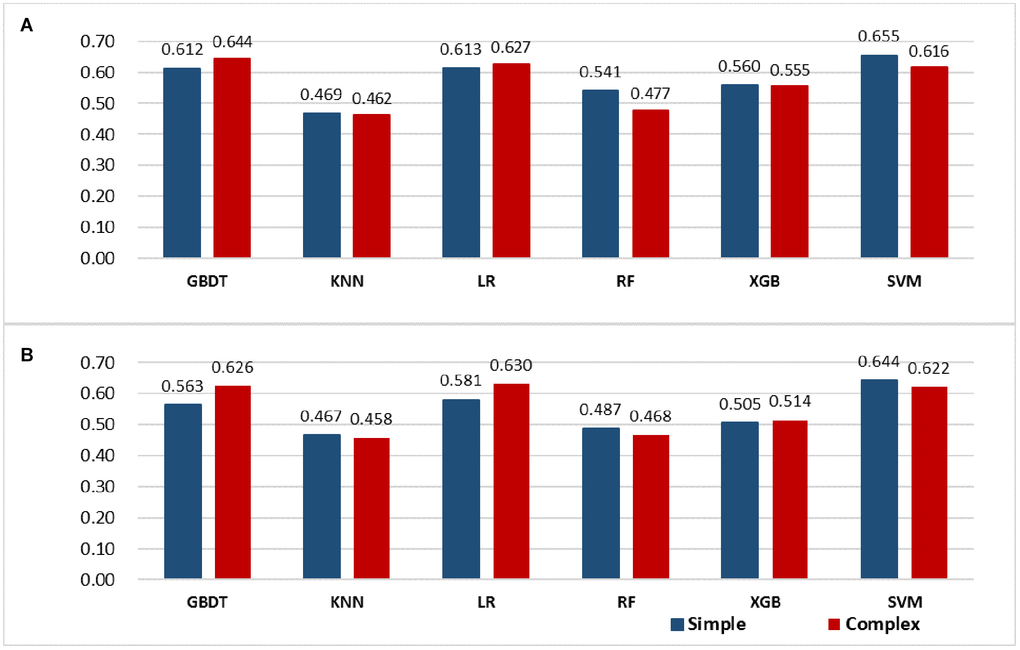
Figure 2. Model evaluation (F1-score) results based on the number of features across six models. (A) primary cohort, N = 1,354 patients; (B) validation cohort, N = 581 patients). Abbreviations: GBDT: gradient boosting decision tree; KNN: k-nearest neighbors; LR: logistic regression; RF: random forest; XGB: XGBoost; SVM: Support Vector Machine.
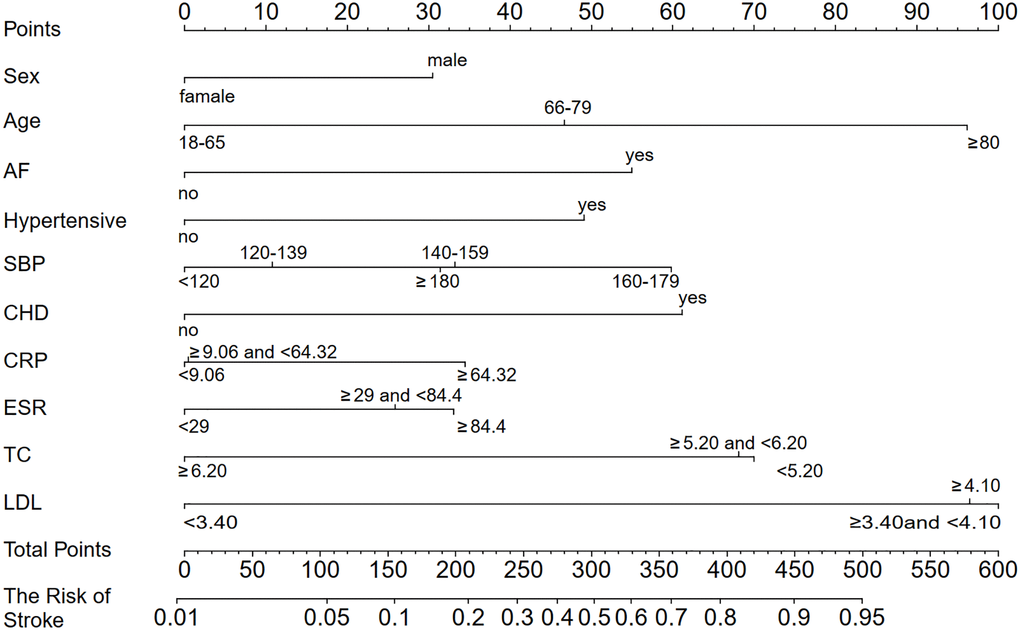
Figure 3. A developed stroke nomogram in the primary cohort (N = 1,354). Abbreviations: SBP: systolic blood pressure; CHD: coronary heart disease; AF: atrial fibrillation; CRP: C-reactive protein; ESR: erythrocyte sedimentation rate; TC: total cholesterol; LDL: low-density lipoprotein. For example, a 70-year-old (47 points), male (30 points) RA patient with an AF (55 points) and CHD (62 points) history of 60 mm/H ESR (27 points), and 5 mmol/L TC (65 points) arrived at a total point value of 286, with a probability of 46% of developing a stroke.
Assessing the performance and internal validation of stroke nomogram
Figure 4 shows a good agreement between the predicted risk and observed outcomes in the primary and validation cohorts (slope = 1, intercept = 0 with simple and complex models). Further, we comprehensively assessed and compared the performance of developed models with the Framingham risk model (Table 3). The Hosmer–Lemeshow test showed no substantial deviation from perfect fit in simple versus complex model in the primary cohort (P = 0.385 vs. 0.097), revealing a good agreement in the probability of stroke between the predicted risk and observed outcomes in the primary cohort. The area under the receiver operating characteristic curve (AUC), used to measure the discrimination performance of models, showed that the complex model (AUC, 95% CI: 0.784 [0.750–0.818], P < 0.001) had a better diagnostic ability than the simple model (AUC, 95% CI: 0.747 [0.711–0.784], P < 0.001), P = 0.0016 and was different compared with the Framingham risk model (AUC, 95% CI: 0.808 [0.778–0.893], P < 0.001), P = 0.0631 in predicting the development of stroke in RA patients. In addition, the net reclassification indexes (NRI) and integrated discrimination indexes (IDI) were calculated based on comparing with the Framingham risk model, both simple and complex models correctly reclassified the subjects in predicting the stroke risk (NRI: 11.59 [2.90, 20.29], 20.30 [12.54, 28.05]. IDI:1.71 [–0.77, 4.18], 5.65 [3.41, 7.88] separately for simple and complex models vs. the Framingham risk model).
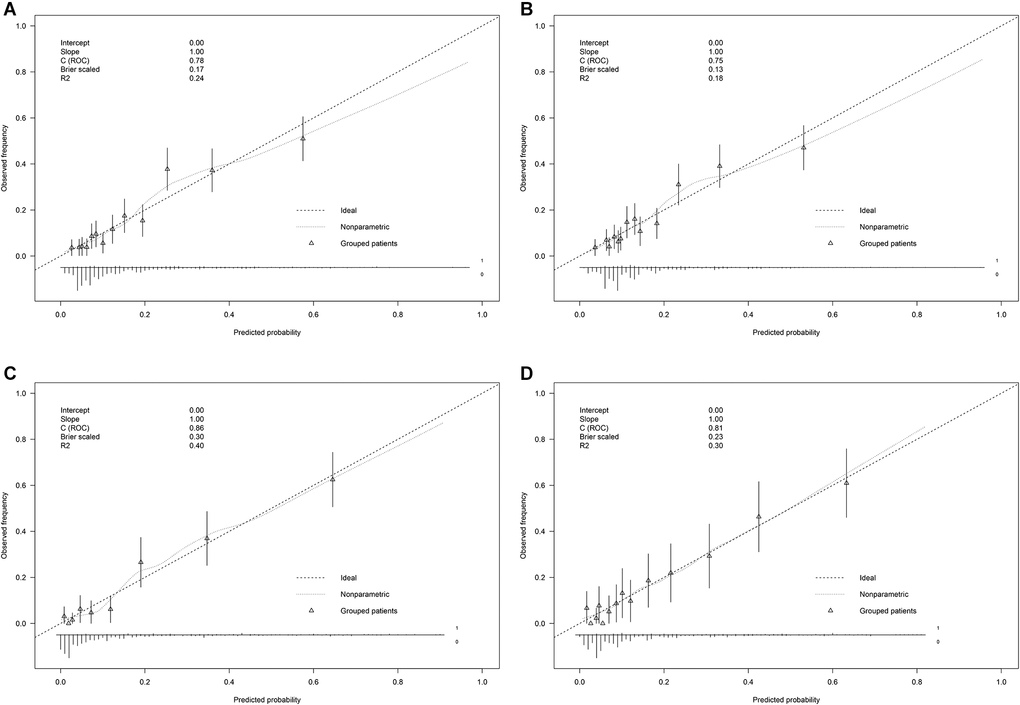
Figure 4. Calibration curves of (A) complex model in the primary cohort (N = 1,354), (B) simple model in the primary cohort (N = 1,354), (C) complex model in the validation cohort (N = 581), and (D) simple model in the validation cohort (N = 581). Calibration curves depicted the calibration of each model in an agreement between the predicted risks of stroke and observed outcomes of stroke. The y-axis represents the actual stroke. The x-axis represents the predicted stroke risk. The diagonal gray line represents the perfect prediction by an ideal model. The dotted line represents the performance of the nonparametric nomogram, of which a closer fit to the diagonal gray line represents a better prediction.
Table 3. Performance and internal validation of stroke nomogram.
| Framingham risk model | Simple model | Complex model | |||||||||||||||||||||||||||||||||||||||||||||||||||||||||||||||||||||||||||||||||||||||||||||||||
| Hosmer–Lemeshow test | |||||||||||||||||||||||||||||||||||||||||||||||||||||||||||||||||||||||||||||||||||||||||||||||||||
| χ² | NA | 8.517 | 13.456 | ||||||||||||||||||||||||||||||||||||||||||||||||||||||||||||||||||||||||||||||||||||||||||||||||
| P | NA | 0.385 | 0.097 | ||||||||||||||||||||||||||||||||||||||||||||||||||||||||||||||||||||||||||||||||||||||||||||||||
| AUC (95% CI) | 0.808 (0.778, 0.839)*& | 0.747 (0.711, 0.784)*# | 0.784 (0.750, 0.818)#& | ||||||||||||||||||||||||||||||||||||||||||||||||||||||||||||||||||||||||||||||||||||||||||||||||
| NRI (95% CI) | ref. | 11.59 (2.90, 20.29) | 20.30 (12.54, 28.05) | ||||||||||||||||||||||||||||||||||||||||||||||||||||||||||||||||||||||||||||||||||||||||||||||||
| IDI (95% CI) | ref. | 1.71 (−0.77, 4.18) | 5.65 (3.41, 7.88) | ||||||||||||||||||||||||||||||||||||||||||||||||||||||||||||||||||||||||||||||||||||||||||||||||
| *P = 0.0013, significant associations between Framingham risk and simple models; #P = 0.0016, significant associations between complex and simple models; &P = 0.0631, significant associations between complex and Framingham risk models. Abbreviations: AUC: area under the receiver operating characteristic curve; NRI: net reclassification index; IDI: integrated discrimination improvement; NA: not available; ref.: reference level. | |||||||||||||||||||||||||||||||||||||||||||||||||||||||||||||||||||||||||||||||||||||||||||||||||||
Clinical use of risk nomogram
The decision curve analysis (DCA) of the risk nomogram in the primary cohort (Supplementary Figure 2) indicated that when the risk threshold of stroke in RA patients was about 15%, intervention treatment was beneficial compared to either treat-all-patients or treat-none scheme. When the threshold value ranged from 15% to 55%, the net benefit was comparable based on the risk nomogram, suggesting that the performance of the complex model (blue line) was higher than that of the simple model (red line) in predicting the risk of stroke in RA patients.
Discussion
We used the EMR data from hospitalized patients in northern China to develop and validate a nomogram for predicting stroke risk in RA patients. The risk nomogram incorporated several factors, including sex, age, SBP, CRP, ESR, TC, LDL, and the history of hypertension, AF, and CHD.
Prediction models use multiple predictors to estimate the absolute probability or risk of disease outcomes in an individual within a specific time interval [23, 24]. Recently, certain study groups have used prediction models to create multi-markers for clinical decision-making. For example, Huang et al. reported a radiomics nomogram that incorporated the radiomics signature, computed tomography (CT)-reported lymph node status, and clinical risk factors to preoperatively predict lymph node metastasis in patients with colorectal cancer [13]. The FRS to predict stroke risk was calculated using patients’ 10-year data by Cox proportional hazards regression model [25], whereas we assessed and used real-world data. We evaluated six machine learning models and observed that the LR algorithm performed well, with better generalization, high accuracy and precision, good recall, and reduced balance error. Similar to multivariable analyses used in recent studies that incorporated individual markers into marker panels, our model connected multiple individual features by incorporating serum lipids and inflammatory markers. Furthermore, our model demonstrated adequate discrimination in a primary cohort, which was subsequently improved in the validation cohort. Our prediction model showed good calibration, with a high Hosmer–Lemeshow goodness-of-fit. Although the AUC analysis did not reveal a difference between complex and Framingham risk models, it showed that 20.30% [12.54, 28.05] of patients were correctly reclassified by the complex model than the Framingham risk model with 5.65% [3.41, 7.88] of IDI. DCA assessment is performed to evaluate model effectiveness and which alternative models should be used [26]. We used DCA to address the heterogeneity across different institutions in clinical data collection and subsequently to select the best model. When the risk threshold of stroke in RA patients was >15%, the net benefit of complex and simple models was superior to either treat-all-patients or treat-none scheme, being best for the complex model when the threshold probability was 15% to 55%. Altogether, these results showed that the easy-to-use nomogram effectively predicted the risk of stroke among RA patients, with strong clinical value for decision making for RA patients.
Several studies have reported that numerous demographic and clinical characteristics, including increased lipid metabolism levels, high inflammatory levels, and other traditional CVD risk factors, affect the risk of RA patients developing stroke [27–29]. However, these studies were conducted in Caucasians, lacking data from Asians. In addition, their results were inconsistent. For instance, Zhang et al. [27] hypothesized that RA-related systemic inflammation determined cardiovascular risk and a complex relationship between LDL and cardiovascular risk. Similarly, certain studies suggested the “lipid paradox” of LDL [7, 30], and others [9, 31] suggested that TC, LDL, and TG levels were specifically used to predict the risk of stroke in RA than in the general population. Our results emphasized the effects of serum TC and LDL levels in predicting the development of stroke among RA patients, simultaneously considering the traditional risk factors (hypertension, AF, and CHD history) reported in previous studies on FRS [16, 25, 32]. For this particular RA population, our findings underscored the contribution of systemic inflammation to stroke development in RA patients, with CRP and ESR inflammatory factors as independent risk factors for stroke in RA patients, also confirmed previously [4, 33]. Because multiple factors contribute to stroke development in RA patients, a cumulative effect of several weak risk factors could more reliably predict the risk than a single risk factor. Thus, we developed a nomogram that incorporated several independent risk predictors.
Our study had several limitations. First, the data used were obtained from a single center. The results need to be externally validated by other centers as well. Therefore, we computed the C-index for the prediction nomogram via bootstrapping validation and assessing the NRI of a bootstrap resample with 1,000 individuals for multiple validations. Second, our study was completely based on clinical data; additional biomarkers could further improve the diagnostic accuracy of the model. Third, with recent studies reporting an association between RA and stroke, it is unclear if a model based on traditional risk factors, serum lipids, and inflammatory markers could effectively predict outcomes. Well-designed randomized clinical trials or cohorts are required to further compare the predictive ability of our model with FRS for stroke in RA patients. Clinical prediction models can guide the professionals in decision-making, thereby improving patient outcomes and cost-effectiveness of care. In addition, prediction models objectively estimate the risks for both individuals (patients) and healthcare providers, thus assisting in subjective interpretations and intuitions, and building guidelines [34, 35].
In conclusion, we developed an effective nomogram that incorporates the traditional risk factors, serum lipids, and inflammatory markers to predict stroke in RA patients. We believe our study will provide a theoretical basis for improving the prognosis of RA patients and preventing the onset of stroke.
Materials and Methods
Patient selection
A total of 8,389 RA patients, with 9.04% (758) prevalence of stroke, were selected from the inpatient Department of Rheumatology and Immunology of the First Affiliated Hospital of China Medical University from January 2011 to December 2018. According to the inclusion and exclusion criteria, 313 RA with stroke patients and 1,827 RA patients were selected (Supplementary Figure 1), aged 18 years or older. EMRs were classified and coded using the International Classification of Diseases Tenth Revision (ICD-10) of the Beijing clinical version (RA: M05.x~06.x; stroke [ischemic and hemorrhagic]: I60 I60.1–I60.0 I61 I61.0–I61.9 I69.0 I69.1 I63 I63.0–I63.9 I69.3). The study conformed to the principles outlined in the Declaration of Helsinki and was approved by the ethics committee of the Medical Science Research Institute of the First Affiliated Hospital, China Medical University (approval number: AF-SOP-07-1.0-01). All patients provided written informed consent for the use of their data.
The study criteria included the American College of Rheumatology (ACR) 1987/2010 [36] for RA and the cardiac vascular disease (CVD) criteria adopted at the Fourth Academic Conference by the Chinese Neuroscience Society in 1995 [37] for stroke. In the RA with stroke cohort, patients who met the following inclusion criteria were enrolled: 1) patients who conformed to the above stroke and RA diagnostic criteria; 2) if the timing of stroke was later than that of RA in the EMR, we believed that the patient had developed stroke after being diagnosed with RA; 3) patients had undergone laboratory tests (serum inflammatory, antibody, complement, lipid-assays) at least once when visited the hospital the first time; and 4) patients were older than 18 years. The RA cohort (without stroke) included patients who met the following inclusion criteria: 1) those who conformed to the above RA diagnostic criteria; 2) patients had undergone laboratory tests (serum inflammatory, antibody, complement, lipid assays) at least once when they first visited the hospital; and 3) patients were older than 18 years. The following exclusion criteria were applied to both cohorts: 1) patients who still suffered from other connective tissue diseases, including systemic lupus erythematosus, scleroderma, dry syndrome, and vasculitis; and 2) RA patients with coexisting ankylosing spondylitis and gout arthritis. Finally, we randomly selected 70% of the RA with stroke and RA patients as the primary cohort; the remaining patients comprised the validation cohort [38].
Data collection
All data were filtered from EMR, and primarily included personal information, such as age, gender, height, and weight; metabolic indices (serum TC, TG, LDL, and HDL); fasting blood glucose (FBG); serologic profiles including CRP, ESR, rheumatoid factor (RF), complement3 (C3), complement4 (C4), and anti-cyclic citrullinated peptide (anti-CCP) antibodies, and CHD, AF, LVH, and CVD history records. In addition, we included the medication history, i.e., hypertension and biologic disease-modifying anti-rheumatic drugs (Bio-med). All laboratory tests were performed using overnight fasting venous blood samples and conducted using clinical standard operating procedures (SOP) for inspection items. In addition, when results of multiple laboratory tests at different time points were summarized, the first laboratory test results were selected at first admission for RA with stroke cohort and the RA cohort.
Statistical analysis
All reported significant levels were set at 0.05 with a two-sided test. The categorical data are expressed as percentages by cohort. Certain continuous predictors (i.e., age, SBP, and CRP) were categorized using consensus approaches, guidelines, or previously published studies. In addition, the absence of certain features in clinical medical records was inevitable and accounted for less than 20%; we used multiple imputations to account for the missing data in SPSS 23.0. Chi-square test or Fisher’s exact test was used to compare the differences in participants’ characteristics between primary and validation cohorts. The univariable association between RA with stroke group and RA group of the primary cohort was assessed using univariate LR analysis. Based on this and clinical importance, scientific knowledge, and predictors identified previously [39], we developed and validated the model for predicting the risk of developing stroke in RA patients. The study report was built according Transparent Reporting of a multivariable prediction model for Individual Prognosis Or Diagnosis (TRIPOD) checklist for development and validation of the prediction model (https://www.equator-network.org/reporting-guidelines/tripod-statement/), shown as Supplementary Figure 3.
Developing the model between the RA with stroke group and RA group in the primary cohort
The LR algorithm was used to develop an unadjusted simple model and a complex model adjusted by sex and age. We considered the disparity between male and female morbidity in RA patients and the aging of stroke patients. Further, we built the risk nomogram using multivariable LR analysis to provide the clinicians with a quantitative tool to predict the individual probability of stroke. All analyses were conducted using the R software version 3.6.2 (packages primarily including rms, Hmisc, dca. R packages; https://www.r-project.org).
Comparing multiple machine learning algorithms in primary and validation cohorts
Machine learning algorithms were used based on scikit-learn, an open-source machine learning library, using Bayesian optimization to implement algorithm optimization, and cross-validation method (N-folds = 5) to complete algorithm evaluation during optimization. We used six different machine algorithms running for three 30-min sessions, including LR, Support Vector Machine (SVM), random forest (RF), XGBoost (XGB), gradient boosting decision tree (GBDT), and k-nearest neighbors (KNN), to compare algorithms and evaluate simple and complex models in primary and validation cohorts, respectively. The cohorts were compared by evaluation metrics as follows: 1) accuracy: the proportion of patients who were predicted as their actual status; 2) precision: the proportion of patients who actually had the disease and were predicted out of patients who were predicted as having the disease; 3) recall: the proportion of patients who were predicted as having disease out of all patients who actually had the disease, corresponding to sensitivity; 4) F1-score: the harmonic mean of precision and recall. F1 = 2Precision × recall/(precision + recall); and 5) balance error (ber): combining bias and variance to reflect the accuracy of the model.
Comparing and validating the performance of developed models
The performance of the nomogram of the model was assessed by discrimination and calibration curves. Calibration curves, the accuracy of point estimates of the LR function, and the Hosmer–Lemeshow test were used to assess if the model calibrated perfectly. The discrimination of the nomogram was evaluated using C-index. The predictive accuracy for individual outcomes (discriminating ability) was equivalent to the AUC and was compared between the Framingham risk model and our prediction models. The models were internally validated using the validation cohort. The LR formula formed in the primary cohort was applied to all patients of the validation cohort. The NRI indicated the proportion of patients correctly reclassified by the new model compared with an existing or standard model, whereas IDI indicated the change in the difference in average predicted probabilities between RA with stroke and RA groups in the new and existing models [40]. Further, NRI and IDI between the Framingham risk model and our prediction models were assessed as having low risk (0–20%), medium risk (20%–59%), and high risk (60%–100%).
Clinical use
DCA was assessed in the primary cohort to evaluate the clinical usefulness of the nomogram by quantifying the net benefits at different threshold probabilities. These results were used to identify the predictive models with the best discriminative abilities [41]. In addition, net benefit was defined as the proportion of true positives minus the proportion of false positives, weighted by the relative harm of false-positive and false-negative results [42]. Simple and complex models were used to predict risk stratification of 1,000 individuals using bootstrapping and assessing clinical impact with decision curves.
Author Contributions
FRX analyzed and interpreted the data and drafted the manuscript. LYF designed the study. FRX, TTW, HNL, BWY, and BQB collected the data. CLZ provided technical support for RealMedSci. LYF interpreted the results and critically revised the manuscript for intellectual content and approved the final version of the manuscript. All authors have read and approved the final manuscript. FRX and LYF are the study guarantors.
Acknowledgments
We thank Yidu Cloud (Beijing) Technology Ltd. for assisting in data extraction and processing, we would also like to thank Neusoft for supporting in data analysis and evaluation by leveraging their RealMedSci, an automatic medical analysis platform.
Conflicts of Interest
The authors declare no conflicts of interest related to this study.
Funding
This work was supported by a grant from the Program of the National Natural Science Foundation of China (81673246).
References
- 1. Zhanguo Li F. rheumatoid arthritis. 1 ed: People's Medical Publishing House. 2009.
- 2. Junbo Ge YX. Internal Medicine. 8 ed: People's Medical Publishing House. 2013.
- 3. Wiseman SJ, Ralston SH, Wardlaw JM. Cerebrovascular Disease in Rheumatic Diseases: A Systematic Review and Meta-Analysis. Stroke. 2016; 47:943–50. https://doi.org/10.1161/STROKEAHA.115.012052 [PubMed]
- 4. Mackey RH, Kuller LH, Deane KD, Walitt BT, Chang YF, Holers VM, Robinson WH, Tracy RP, Hlatky MA, Eaton CB, Liu S, Freiberg MS, Talabi MB, et al. Rheumatoid Arthritis, Anti-Cyclic Citrullinated Peptide Positivity, and Cardiovascular Disease Risk in the Women's Health Initiative. Arthritis Rheumatol. 2015; 67:2311–22. https://doi.org/10.1002/art.39198 [PubMed]
- 5. Liou TH, Huang SW, Lin JW, Chang YS, Wu CW, Lin HW. Risk of stroke in patients with rheumatism: a nationwide longitudinal population-based study. Sci Rep. 2014; 4:5110. https://doi.org/10.1038/srep05110 [PubMed]
- 6. Navarro-Millán I, Yang S, DuVall SL, Chen L, Baddley J, Cannon GW, Delzell ES, Zhang J, Safford MM, Patkar NM, Mikuls TR, Singh JA, Curtis JR. Association of hyperlipidaemia, inflammation and serological status and coronary heart disease among patients with rheumatoid arthritis: data from the National Veterans Health Administration. Ann Rheum Dis. 2016; 75:341–47. https://doi.org/10.1136/annrheumdis-2013-204987 [PubMed]
- 7. Dursunoğlu D, Evrengül H, Polat B, Tanriverdi H, Cobankara V, Kaftan A, Kiliç M. Lp(a) lipoprotein and lipids in patients with rheumatoid arthritis: serum levels and relationship to inflammation. Rheumatol Int. 2005; 25:241–45. https://doi.org/10.1007/s00296-004-0438-0 [PubMed]
- 8. Lindhardsen J, Gislason GH, Ahlehoff O, Madsen OR, Hansen PR. Increased risk of stroke and atrial fibrillation in rheumatoid arthritis - a nationwide cohort study. Eur Heart J. 2010; 31:156.
- 9. Semb AG, Kvien TK, Aastveit AH, Jungner I, Pedersen TR, Walldius G, Holme I. Lipids, myocardial infarction and ischaemic stroke in patients with rheumatoid arthritis in the Apolipoprotein-related Mortality RISk (AMORIS) Study. Ann Rheum Dis. 2010; 69:1996–2001. https://doi.org/10.1136/ard.2009.126128 [PubMed]
- 10. Pope JE, Choy EH. C-reactive protein and implications in rheumatoid arthritis and associated comorbidities. Semin Arthritis Rheum. 2021; 51:219–29. https://doi.org/10.1016/j.semarthrit.2020.11.005 [PubMed]
- 11. Goodson NJ, Symmons DP, Scott DG, Bunn D, Lunt M, Silman AJ. Baseline levels of C-reactive protein and prediction of death from cardiovascular disease in patients with inflammatory polyarthritis: a ten-year followup study of a primary care-based inception cohort. Arthritis Rheum. 2005; 52:2293–99. https://doi.org/10.1002/art.21204 [PubMed]
- 12. Wang C, Yang Y, Pan Y, Liao X, Huo X, Miao Z, Wang Y, Wang Y. Validation of the Simplified Stroke-Thrombolytic Predictive Instrument to Predict Functional Outcomes in Chinese Patients. Stroke. 2018; 49:2773–76. https://doi.org/10.1161/STROKEAHA.118.022269 [PubMed]
- 13. Huang YQ, Liang CH, He L, Tian J, Liang CS, Chen X, Ma ZL, Liu ZY. Development and Validation of a Radiomics Nomogram for Preoperative Prediction of Lymph Node Metastasis in Colorectal Cancer. J Clin Oncol. 2016; 34:2157–64. https://doi.org/10.1200/JCO.2015.65.9128 [PubMed]
- 14. Kim HY, Jang EJ, Park B, Kim TY, Shin SA, Ha YC, Jang S. Development of a Korean Fracture Risk Score (KFRS) for Predicting Osteoporotic Fracture Risk: Analysis of Data from the Korean National Health Insurance Service. PLoS One. 2016; 11:e0158918. https://doi.org/10.1371/journal.pone.0158918 [PubMed]
- 15. Cook NR, Paynter NP, Eaton CB, Manson JE, Martin LW, Robinson JG, Rossouw JE, Wassertheil-Smoller S, Ridker PM. Comparison of the Framingham and Reynolds Risk scores for global cardiovascular risk prediction in the multiethnic Women's Health Initiative. Circulation. 2012; 125:1748–56. https://doi.org/10.1161/CIRCULATIONAHA.111.075929 [PubMed]
- 16. Lin Y, Wei X, Cai A, Yang X, Zhou Y, Yu D. Framingham Risk Score for the prediction of coronary artery disease in patients with chronic rheumatic heart disease. Diagnosis (Berl). 2014; 1:233–38. https://doi.org/10.1515/dx-2014-0010 [PubMed]
- 17. D'Agostino RB
Sr , Vasan RS, Pencina MJ, Wolf PA, Cobain M, Massaro JM, Kannel WB. General cardiovascular risk profile for use in primary care: the Framingham Heart Study. Circulation. 2008; 117:743–53. https://doi.org/10.1161/CIRCULATIONAHA.107.699579 [PubMed] - 18. Assmann G, Cullen P, Schulte H. Simple scoring scheme for calculating the risk of acute coronary events based on the 10-year follow-up of the prospective cardiovascular Münster (PROCAM) study. Circulation. 2002; 105:310–15. https://doi.org/10.1161/hc0302.102575 [PubMed]
- 19. Zhang XF, Attia J, D'Este C, Yu XH, Wu XG. A risk score predicted coronary heart disease and stroke in a Chinese cohort. J Clin Epidemiol. 2005; 58:951–58. https://doi.org/10.1016/j.jclinepi.2005.01.013 [PubMed]
- 20. Ferrario M, Chiodini P, Chambless LE, Cesana G, Vanuzzo D, Panico S, Sega R, Pilotto L, Palmieri L, Giampaoli S, and CUORE Project Research Group. Prediction of coronary events in a low incidence population. Assessing accuracy of the CUORE Cohort Study prediction equation. Int J Epidemiol. 2005; 34:413–21. https://doi.org/10.1093/ije/dyh405 [PubMed]
- 21. Xin F, Fu L, Liu H, Xu Y, Wei T, Chen M. Exploring metabolic and inflammatory abnormalities in rheumatoid arthritis patients developing stroke disease: a case-control study using electronic medical record data in northern China. Clin Rheumatol. 2019; 38:1401–11. https://doi.org/10.1007/s10067-019-04440-5 [PubMed]
- 22. Wei T, Yang B, Liu H, Xin F, Fu L. Development and validation of a nomogram to predict coronary heart disease in patients with rheumatoid arthritis in northern China. Aging (Albany NY). 2020; 12:3190–204. https://doi.org/10.18632/aging.102823 [PubMed]
- 23. Ranstam J, Cook JA, Collins GS. Clinical prediction models. Br J Surg. 2016; 103:1886. https://doi.org/10.1002/bjs.10242 [PubMed]
- 24. Hadi MA, Closs SJ. Applications of mixed-methods methodology in clinical pharmacy research. Int J Clin Pharm. 2016; 38:635–40. https://doi.org/10.1007/s11096-015-0231-z [PubMed]
- 25. D'Agostino RB, Wolf PA, Belanger AJ, Kannel WB. Stroke risk profile: adjustment for antihypertensive medication. The Framingham Study. Stroke. 1994; 25:40–43. https://doi.org/10.1161/01.str.25.1.40 [PubMed]
- 26. Hunink MGP, Siegel J. Decision-Making in Health and Medicine: Integrating Evidence and Values. New York: Cambridge University Press. 2001.
- 27. Zhang J, Chen L, Delzell E, Muntner P, Hillegass WB, Safford MM, Millan IY, Crowson CS, Curtis JR. The association between inflammatory markers, serum lipids and the risk of cardiovascular events in patients with rheumatoid arthritis. Ann Rheum Dis. 2014; 73:1301–08. https://doi.org/10.1136/annrheumdis-2013-204715 [PubMed]
- 28. Dessein PH, Joffe BI, Stanwix AE. Inflammation, insulin resistance, and aberrant lipid metabolism as cardiovascular risk factors in rheumatoid arthritis. J Rheumatol. 2003; 30:1403–05. [PubMed]
- 29. Baghdadi LR, Woodman RJ, Shanahan EM, Mangoni AA. The impact of traditional cardiovascular risk factors on cardiovascular outcomes in patients with rheumatoid arthritis: a systematic review and meta-analysis. PLoS One. 2015; 10:e0117952. https://doi.org/10.1371/journal.pone.0117952 [PubMed]
- 30. Myasoedova E, Crowson CS, Kremers HM, Roger VL, Fitz-Gibbon PD, Therneau TM, Gabriel SE. Lipid paradox in rheumatoid arthritis: the impact of serum lipid measures and systemic inflammation on the risk of cardiovascular disease. Ann Rheum Dis. 2011; 70:482–87. https://doi.org/10.1136/ard.2010.135871 [PubMed]
- 31. Dhillon N, Liang K. Prevention of stroke in rheumatoid arthritis. Curr Treat Options Neurol. 2015; 17:356. https://doi.org/10.1007/s11940-015-0356-3 [PubMed]
- 32. O'Leary DH, Polak JF, Kronmal RA, Manolio TA, Burke GL, Wolfson SK
Jr , and Cardiovascular Health Study Collaborative Research Group. Carotid-artery intima and media thickness as a risk factor for myocardial infarction and stroke in older adults. N Engl J Med. 1999; 340:14–22. https://doi.org/10.1056/NEJM199901073400103 [PubMed] - 33. van Leuven SI, Franssen R, Kastelein JJ, Levi M, Stroes ES, Tak PP. Systemic inflammation as a risk factor for atherothrombosis. Rheumatology (Oxford). 2008; 47:3–7. https://doi.org/10.1093/rheumatology/kem202 [PubMed]
- 34. Moons KG, Royston P, Vergouwe Y, Grobbee DE, Altman DG. Prognosis and prognostic research: what, why, and how? BMJ. 2009; 338:b375. https://doi.org/10.1136/bmj.b375 [PubMed]
- 35. McGinn TG, Guyatt GH, Wyer PC, Naylor CD, Stiell IG, Richardson WS, and Evidence-Based Medicine Working Group. Users' guides to the medical literature: XXII: how to use articles about clinical decision rules. JAMA. 2000; 284:79–84. https://doi.org/10.1001/jama.284.1.79 [PubMed]
- 36. Arnett FC, Edworthy SM, Bloch DA, McShane DJ, Fries JF, Cooper NS, Healey LA, Kaplan SR, Liang MH, Luthra HS, Medsger TA, Mitchell DM, Neustadt DH, et al. The American Rheumatism Association 1987 revised criteria for the classification of rheumatoid arthritis. Arthritis Rheum. 1988; 31:315–24. https://doi.org/10.1002/art.1780310302 [PubMed]
- 37. Association CN. Diagnosis of various cerebrovascular diseases(1995). Journal of clinical and experimental medicine. 2013; 12:1.
- 38. Lei Z, Li J, Wu D, Xia Y, Wang Q, Si A, Wang K, Wan X, Lau WY, Wu M, Shen F. Nomogram for Preoperative Estimation of Microvascular Invasion Risk in Hepatitis B Virus-Related Hepatocellular Carcinoma Within the Milan Criteria. JAMA Surg. 2016; 151:356–63. https://doi.org/10.1001/jamasurg.2015.4257 [PubMed]
- 39. Kim Y, Margonis GA, Prescott JD, Tran TB, Postlewait LM, Maithel SK, Wang TS, Evans DB, Hatzaras I, Shenoy R, Phay JE, Keplinger K, Fields RC, et al. Nomograms to Predict Recurrence-Free and Overall Survival After Curative Resection of Adrenocortical Carcinoma. JAMA Surg. 2016; 151:365–73. https://doi.org/10.1001/jamasurg.2015.4516 [PubMed]
- 40. Lund JL, Kuo TM, Brookhart MA, Meyer AM, Dalton AF, Kistler CE, Wheeler SB, Lewis CL. Development and validation of a 5-year mortality prediction model using regularized regression and Medicare data. Pharmacoepidemiol Drug Saf. 2019; 28:584–92. https://doi.org/10.1002/pds.4769 [PubMed]
- 41. Vickers AJ, Elkin EB. Decision curve analysis: a novel method for evaluating prediction models. Med Decis Making. 2006; 26:565–74. https://doi.org/10.1177/0272989X06295361 [PubMed]
- 42. Collins GS, Reitsma JB, Altman DG, Moons KG. Transparent reporting of a multivariable prediction model for individual prognosis or diagnosis (TRIPOD): the TRIPOD statement. BMJ. 2015; 350:g7594. https://doi.org/10.1136/bmj.g7594 [PubMed]