


Introduction
Colorectal cancer (CRC) is one of the most alarming malignant tumors or cancers in the world, and its morbidity and mortality have always been key issues of concern, globally. According to the 2018 GLOBOCAN global cancer data, more than 1.8 million people were diagnosed with CRC in 2018, while the number of the deaths related to CRC was 881,000, ranking third in terms of global morbidity and second in mortality [1]. The American Cancer Society evaluated newly occurred cancer cases and deaths in the United States in 2020 and showed that the incidence and mortality of CRC ranked third in malignant tumors, in both men and women [2]. In China, the incidence and mortality of CRC are on the rise [3]. Histologically, CRC can be classified as adenocarcinoma, adenosquamous carcinoma and undifferentiated carcinoma. Colon adenocarcinoma (COAD) is the most common histological subtype. [4] In recent years, the incidence and mortality of COAD have shown a significant upward trend, especially in Western developed countries and Asian developing countries [5, 6]. At present, the treatment of colon adenocarcinoma is comprehensive, including radiotherapy, chemotherapy and surgery, but the five-year survival rate of COAD is still not ideal [7]. Clinical predictors such as TNM (tumor-node-metastasis) stage, sex, and age represent conventional methods for evaluating prognosis, but these methods cannot accurately predict the survival of patients. Although serum microRNA has been used to evaluate early COAD, its diagnostic advantages are not very competitive compared with other non-invasive tests [8]. Colonoscopy is the gold standard for the diagnosis of COAD, but it has not been widely used due to its high cost and invasiveness [9, 10]. Serum carcinoembryonic antigen (CEA) is an important tumor marker for COAD diagnosis and postoperative monitoring, but in some clinical trials, the positive rate of serum CEA in patients is less than 50% [11, 12]. Therefore, it is of great value to identify and screen out accurate and practical biomarkers related to COAD diagnosis and prognosis.
Human intestinal intraepithelial lymphocytes (IELs), which are T cell receptor αβ+ CD8+ T cells located between epithelial cells (EC), may be involved in the innate immune response against colon cancer. They can detect or kill the stunted or malignant ECs [13]. NKG2D (natural killer group 2, member D) is a C-type lectin-like activation receptor expressed in NK cells and various T cell subsets including CD8+ cytotoxic T cells. [14] These molecules can identify the major histocompatibility complex (MHC) class I polypeptide-related sequence (MIC) A/B protein and unique long 16 (UL16)-binding protein (ULBP) on EC, collectively known as NKG2D ligands (NKG2DL) [15–18]. MICA/B has the same α1, α2, and α3 domains as MHC class I, and the α3 domain is an Ig-like domain [19]. The unique long 16 (UL16)-binding protein (ULBP) family, also known as retinoic acid early transcript (RAET), is a cell membrane protein family expressed on transformed and stressed cells [20, 21]. In humans, the ULBP family contains 6 functional members, including GPI anchored proteins [ULBP1 (RAET1I), ULBP2 (RAET1H), ULBP3 (RAET1N), ULBP6 (RAET1L)] and transmembrane proteins [ULBP4 (RAET1E), ULBP5 (RAET1G)] [22, 23]. Interestingly, ULBPs only have α1 and α2 domains [20]. Studies of cancer models in vivo strongly suggest that the activated immune receptor NKG2D is involved in the anti-cancer immune response [24, 25]. The NKG2DLs expressed on tumor cells and bound to the NKG2D receptor can activate NK cells to kill tumor cells. Additionally, when combined with the NKG2D receptor on T cells, they can provide costimulatory signals [16]. Some previous studies reported the decrease of NKG2D-positive NK cells in colorectal cancer (CC), gastric cancer (GC) and pancreatic cancer (PC) were associated with a poor prognosis [26]. NKG2DLs were rarely expressed in normal healthy tissues, but found in a variety of different cancer-derived cell lines and primary cancers [27]. However, to our knowledge, the relationship between the NKG2DL family genes and COAD has not been studied. Therefore, our study aimed to explore and discover the potential clinical values of NKG2DL family genes in COAD, particularly in its diagnostic and prognostic values.
Results
Public database information mining
We downloaded the mRNA expression of the NKG2DL genes from a total of 456 patients diagnosed with COAD, including 480 tumor tissue samples and 41 adjacent normal tissue samples from the TCGA database. We excluded those patients with repetitive information and a survival time of 0, and we obtained 438 tumor samples and 41 adjacent tissue samples. We integrated the gene expression data with the corresponding clinical parameters downloaded from the TCGA database. The results are shown in Supplementary Table 1. In the RFS cohort, in addition to age and tumor location, other clinical parameters were associated with COAD RFS (all P < 0.05). As for the OS cohort, the majority of clinical parameters were associated with COAD OS (except for age, sex and tumor location, all P < 0.05). Finally, to validate the prognostic value of NKG2DL genes, we downloaded the prognostic information of 586 CC patients related to the expression of the NKG2DL family genes (with the exception of ULBP5 (RAET1G) and ULBP6 (RAET1L)) from the GEO database, we excluded those cases without survival information, leaving 580 cases of OS and 575 cases of RFS (Supplementary Table 2). In the RFS cohort, TNM stage, chemotherapy adjuvant, Kirsten rat sarcoma viral oncogene (KRAS) mutation and Cartes d'Identité des Tumeurs (CIT) molecular subtype were related to CC RFS (P < 0.05); in the OS cohort, age, TNM stage, KRAS mutation and CIT molecular subtype were related to CC OS (P < 0.05).
Bioinformatics analysis
The GO and KEGG analyses suggested that NKG2DL genes might be involved in the process of natural killer cell mediated cytotoxicity (Supplementary Figure 1A). The GO analysis by BiNGO in Cytoscape found a similar result in natural killer cell activity (Supplementary Figure 1B–1D). The natural killer cell-mediated cytotoxicity pathway diagram showed that the NKG2DL genes were mainly involved in the regulation of the MAPK signaling pathway (Supplementary Figure 2). As for the association of NKG2DL genes, our Pearson’s correlation analysis showed that MICA and MICB, ULBP2 and ULBP3, ULBP2 and RAET1L, ULBP3 and RAET1L, RAET1E and RAET1G, RAET1G and RAET1L had a specific relationship with each other (Supplementary Figure 1E). Finally, an investigation of the interaction networks of NKG2DL genes showed that MIC genes and NKG2DL members had solid homology and co-expression relationships (Supplementary Figure 1F–1G).
Expression levels of NKG2DL genes in normal colon tissues and COAD tumor tissues
The expression of NKG2DL genes in normal human colon tissues was collected from the GTEx database (Supplementary Figure 3). The expression data of NKG2DL genes in tumor tissues from COAD patients and normal tissues were downloaded from the GEPIA website and showed that the MICA gene was lowly expressed in COAD tumor tissues, while MICB, ULBP1, ULBP2, ULBP3, RAET1E, RAET1G, and RAET1L were highly expressed in COAD tumor tissues (Supplementary Figure 4).
Differential gene expression and diagnostic ROC curve analysis based on the TCGA cohort
The results of differential expression analysis of NKG2DL genes in COAD showed that ULBP1, ULBP2, ULBP3 and RAET1L had significant differential expression in COAD (all log2 fold change ≥ 2.0) (Figure 1A). This analysis suggested that all NKG2DL genes were highly and significantly expressed in tumor tissues, but their expression levels in adjacent normal tissues were low (Figure 1B). The diagnostic ROC curve analyses suggested that ULBP1, ULBP2, ULBP3, RAET1G and RAET1L had diagnostic value in COAD (AUC > 0.7), among them ULBP1 [AUC (95% CI) = 0.961 (0.945-0.9780)], ULBP2 [AUC (95% CI) = 0.986 (0.977–0.995)], ULBP3 [AUC (95% CI) = 0.955 (0.932–0.9780) and RAET1L [AUC (95% CI) = 0.944 (0.906–0.983)] had higher diagnostic values (AUC > 0.9) (Figure 1C–1J).

Figure 1. The differential expression and diagnostic ROC curves of NKG2DL genes in COAD. (A, B) The differential expression of NKG2DL genes in COAD: (A) Differential expression in the Edger and DESeq; (B) Expression distribution in TCGA; (C–J) The diagnostic ROC curves of NKG2DL genes in distinguish COAD tumor tissues and adjacent normal tissues in TCGA cohort: ROC curves of MICA (C); MICB (D); ULBP1 (E); ULBP2 (F); ULBP3 (G); RAET1E (H); RAET1G (I); RAET1L (J). Notes: COAD: colon adenocarcinoma; NKG2DL, Natural Killer Group 2 MemberD Ligand; ULBP: unique long 16 (UL16)-binding protein; MIC: Human Major Histocompatibility Complex (MHC) class I polypeptide-related sequence; TCGA: The Cancer Genome Atlas; NS: not significant; ROC: receiver operating characteristic; AUC: area under the curve; CI: confidence interval. * P<0.05; *** P<0.001; **** P<0.0001.
Survival analysis
First, based on the TCGA cohort, we performed prognostic survival analysis of the NKG2DL genes in COAD, the multivariate analyses showed that the high expression of ULBP2 [adjusted P = 0.007, HR (95% CI) = 2.490 (1.349–6.405)] and RAET1E [adjusted P = 0.009, HR (95% CI) = 0.236 (0.157–0.764)] were correlated with the prognosis of COAD RFS. At the same time, the ULBP2 gene was involved in the COAD OS [adjusted P = 0.025, HR (95% CI) = 1.765 (1.074–2.901)], and the low regulation of ULBP2 had a favorable prognosis of COAD OS (Figure 2, Supplementary Table 3). In addition, the GSE40967 cohort based on the GEO database was used to validate the prognostic values of NKG2DL, the results suggested that the expression of the ULBP2 gene [adjusted P = 0.036, HR (95% CI) = 1.423 (1.024–1.979)] was related to the RFS of CC; meanwhile, the expression of the MICB gene (adjusted P = 0.037, HR (95% CI) = 0.722 (0.532)–0.980)] and ULBP2 gene [adjusted P = 0.005, HR (95% CI) = 1.563 (1.146–2.130)] were related to the OS of CC (Supplementary Figure 5, Supplementary Table 4). The cohort comparison between two databases found that ULBP2 gene was related to the RFS and OS of COAD and CC.
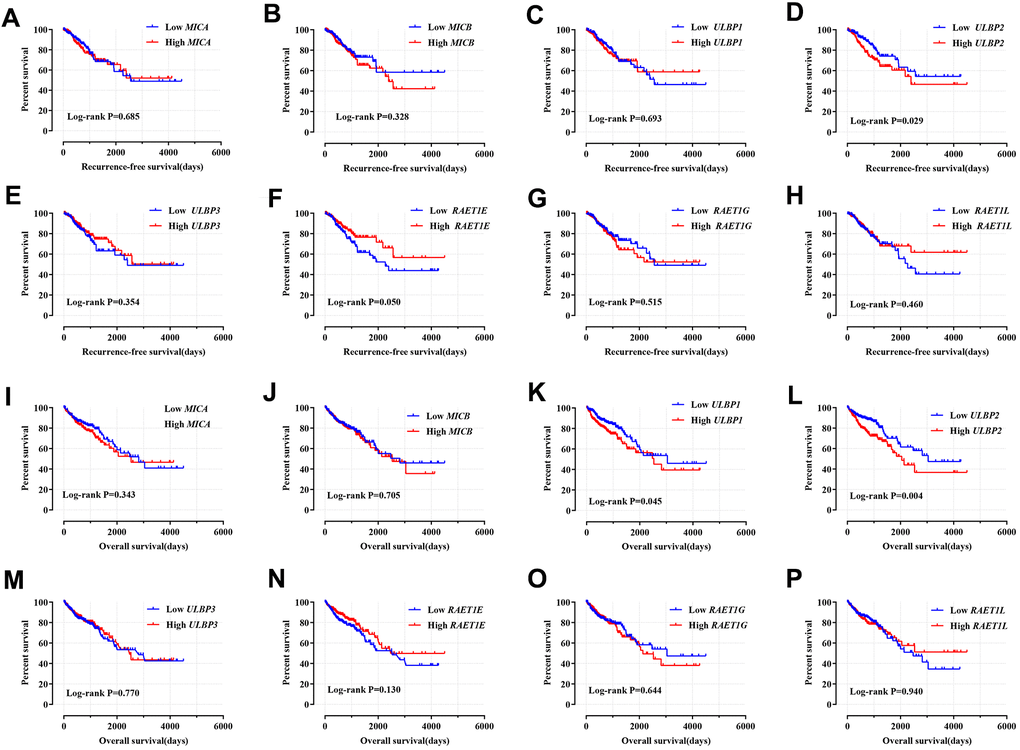
Figure 2. Kaplan–Meier survival curves for NKG2DL genes in COAD of TCGA cohort. Notes: RFS stratified by MICA (A); MICB (B); ULBP1 (C); ULBP2 (D); ULBP3 (E); RAET1E (F); RAET1G (G); RAET1L (H). OS stratified by MICA (I); MICB (J); ULBP1 (K); ULBP2 (L); ULBP3 (M); RAET1E (N); RAET1G (O); RAET1L (P). COAD: colon adenocarcinoma; NKG2DL, Natural Killer Group 2 Member D Ligand; ULBP: unique long 16 (UL16)-binding protein; MIC: Human Major Histocompatibility Complex (MHC) class I polypeptide-related sequence; TCGA: The Cancer Genome Atlas; RFS, recurrence-free survival; OS, overall survival.
Comprehensive prognosis survival analysis
We performed a comprehensive analysis of the prognostic value of ULBP2 in RFS and OS of COAD and CC. Nomogram results showed that the ULBP2 gene had a certain contribution to the RFS and OS of COAD and CC (Supplementary Figure 6). However, it was also found that the TNM stage contributed the most to the risk score. Next, we investigated the association of the TNM stage with ULBP2 gene which we downloaded from the GEPIA website, and the result indicated that the TNM stage had no connection with ULBP2 (P > 0.05) (Supplementary Figure 7). Finally, we constructed a prognostic risk model of ULBP2 gene for COAD and CC. The higher the expression of the ULBP2 gene, the higher the prognostic risk score and the greater the mortality rate. In the TCGA cohort, the low-risk model group had better prognostic value for RFS and OS (log-rank P = 0.029 and log-rank P = 0.004), the 1-, 2-, 3-, 4, and 5- year survival ROC curves showed that the AUC values were about 0.5–0.6 (Figure 3A–3F). In the GEO cohort, it was found that the high-risk model group had a worse prognosis for RFS and OS (Log-rank P = 0.029 and log-rank P = 0.004), the 1-, 2-, 3-, 4, and 5- year survival ROC curves showed that the AUC values were about 0.5–0.6 (Figure 3G–3L).
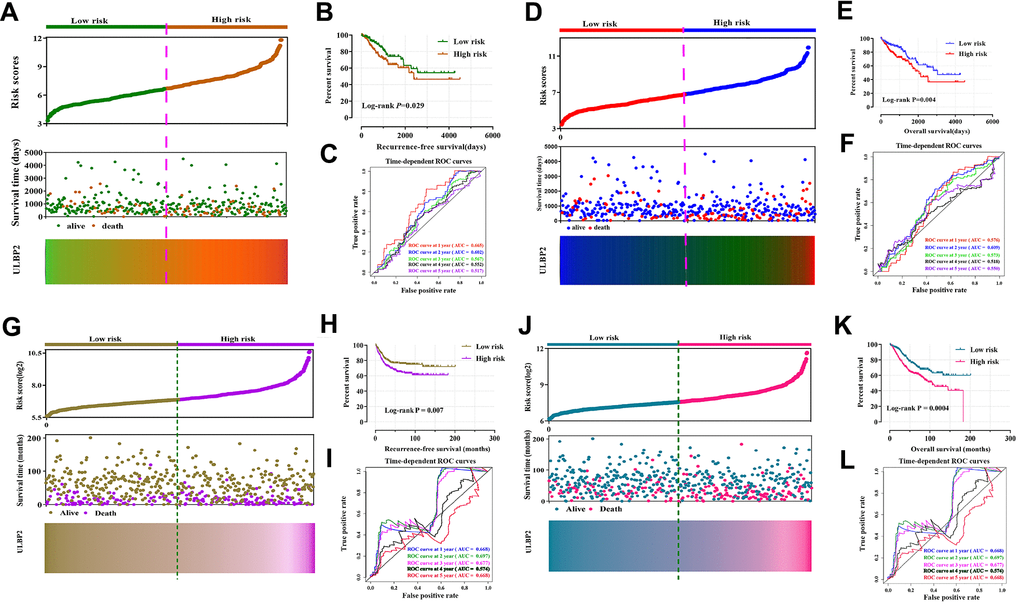
Figure 3. Prognostic risk score model and time-dependent ROC curve of ULBP2 gene in COAD and CC RFS and OS based on TCGA cohort and GSE40967 cohort. (A, D) Risk score model plot including risk score ranking, survival status, and heatmaps in COAD in COAD RFS and OS; (B, E) Kaplan–Meier curves for low- and high-risk groups in COAD RFS and OS; (C, F) ROC curves for 1-, 2-, 3-, 4-, and 5-year survival rates from the risk score model in CC RFS and OS; (G and J) Risk score model plot including risk score ranking, survival status, and heatmaps in CC in CC RFS and OS; (H, K) Kaplan–Meier curves for low- and high-risk groups in CC RFS and OS; (I, L) ROC curves for 1-, 2-, 3-, 4-, and 5-year survival rates from the risk score model in CC RFS and OS. Notes: COAD: colon adenocarcinoma; CC: colon cancer; ULBP: unique long 16 (UL16)-binding protein; ROC, receiver operating characteristic; RFS, recurrence-free survival; OS, overall survival.
Verification of ULBP2 expression in COAD tumor tissues and adjacent normal tissues
RT-qPCR of ULBP2 expression of COAD in the Guangxi cohort
We used RT-qPCR technology to detect the relative expression of the ULBP2 gene in COAD tumor tissues and adjacent normal tissues, and the results indicated that the relative expression was significantly higher in COAD tumor tissues (0.23233246±0.48443959501) than in adjacent normal tissues (0.02814684 ± 0.037491460) (P = 0.012; Figure 4A, 4B). Besides, we performed the diagnostic ROC curve to evaluate the diagnostic value of the ULBP2 gene in COAD. The results suggested that the ULBP2 gene had a higher diagnostic value in COAD (P < 0.0001, AUC = 0.921, 95% CI = 0.863–0.980; Figure 4C).
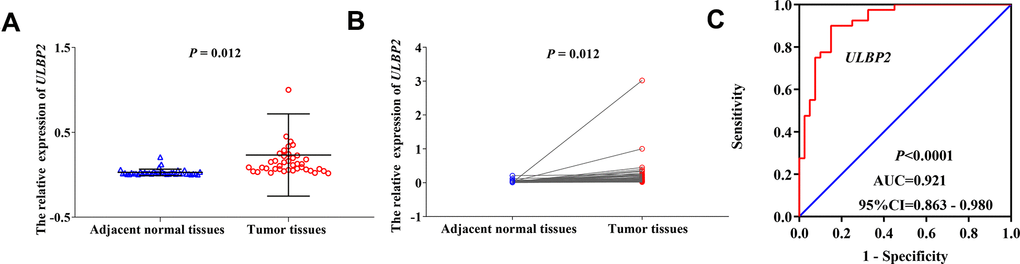
Figure 4. The relative expression and diagnostic ROC curve of ULBP2 gene in COAD tumor tissues and adjacent normal tissues. Notes: (A, B) The relative expression of ULBP2 gene; (C) diagnostic ROC curve. Notes: COAD: colon adenocarcinoma; ULBP: unique long 16 (UL16)-binding protein; AUC: area under the curve; CI: confidence interval.
IHC of ULBP2 expressions of COAD in Guangxi cohort
The IHC results showed that ULBP2 was mainly expressed in the cytoplasm. ULBP2 protein expression was seen in 79 of 161 (49.1%) COAD patient tumor samples, while ULBP2 was only seen in 3 of 34 (8.8%) adjacent normal tissues (Figure 5A–5D).
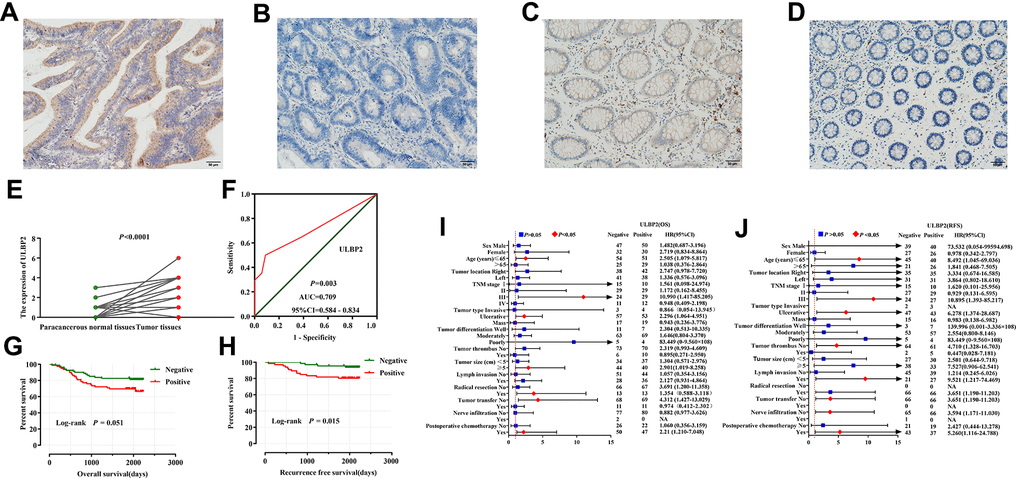
Figure 5. Immunohistochemical staining analyses of ULBP2 expression in COAD tumor tissues and adjacent normal tissues. (A–D) ULBP2 staining results were observed in the cytoplasm of colon cells; (A) Positive staining of COAD tumor tissues; (B) Negative staining of COAD tumor tissues; (C) Positive staining of adjacent normal colon tissues; (D) Negative staining of adjacent normal tissues; (E, F) Diagnostic analysis of ULBP2 expression in COAD: (E) Scatter plot; (F) Diagnostic ROC curve; survival analysis of ULBP2 expression in COAD: (G, H) Kaplan–Meier survival curve of ULBP2 protein expression in COAD OS and RFS; (I, J) Stratified analysis of ULBP2 expression in different clinical parameter layers in COAD patients: (A) OS; (B) RFS. Notes: COAD, colon adenocarcinoma; ULBP: unique long 16 (UL16)-binding protein; ROC, receiver operating characteristic; AUC: area under the curve; CI: confidence interval; OS, overall survival; RFS, recurrence-free survival. Magnification, 200×.
The differential expression analysis showed that the IHC score of ULBP2 protein in COAD tumor tissues was significantly higher than in adjacent normal tissues (P < 0.0001), and the diagnostic ROC curve analysis suggested that the IHC score of ULBP2 protein has a certain diagnostic value in COAD [P = 0.003, AUC [95% CI =0.709 (0.584–0.834)] (Figure 5E, 5F).
Our prognostic survival curves showed that patients with negative expression of ULBP2 protein in COAD had a better OS and RFS (Figure 5G, 5H), and the results of Multivariate COX regression analysis showed that ULBP2 protein expression was related to COAD OS [adjusted P=0.047, HR (95% CI) =2.009 (1.009–4.001)], while ULBP2 protein expression was related to COAD RFS [adjusted P=0.032, HR (95% CI) =9.521 (1.217–74.469)] (Supplementary Table 5).
The stratified analysis results showed that young (≤ 65 years), TNM stage III, ulcerative COAD, tumor diameter (≥ 5cm), non-radical surgical resection, no tumor metastasis, and postoperative adjuvant chemotherapy patients with positive ULBP2 protein expression increased COAD patients risk of death and the OS was shorter; while young (≤ 65 years), TNM stage III, ulcerative COAD, tumor thrombosis, non-radical treatment surgical resection, no tumor metastasis and postoperative adjuvant chemotherapy patients with negative expression of ULBP2 protein decreased the risk of death in COAD patients, and the RFS was longer (Figure 5I, 5J).
Discussion
In the colonic intestinal epithelium, the immune system affects the occurrence and development of tumors. Clinical data suggest that immune surveillance plays an important role in inhibiting and killing tumor cells in a variety of human cancers, including colon cancer [28]. In several immune mechanisms, the NKG2D receptor-ligand system might play a leading role in protecting the host from cancer [29]. Research on cancer models in vivo showed strongly that the activated immune receptor NKG2D participated in the anti-cancer immune response [24, 30, 31]. It has been reported that deficiency of NKG2D could increase the incidence of malignancies in mice [32]. NKG2DL genes bound to the NKG2D receptor can activate NKG2D to support the cytotoxic activity of NK cells and T cells against tumor cells [33]. Tumor cells regulate the expression of NKG2DLs at the transcription, translation and post-translational levels, thereby evading the recognition of NK cells. Many previous studies have found that changes in NKG2DL gene expression could be related to the diagnosis and prognosis of cancer [16]. Therefore, this study aimed to investigate the diagnostic and prognostic values of NKG2DL genes in COAD.
In our study, we collected the expression mass spectra of NKG2DL family genes in human colon normal tissues from the GTEx database. It was seen that MICB, ULBP1, ULBP2, ULBP3, RAET1E, RAET1G, and RAET1L (except MICA) were expressed at relatively low levels in normal colon tissues. On the other hand, when we integrated the gene expression levels of the NKG2DL family collected from the GEPIA website and the TCGA database in COAD patient tumor tissues and normal tissues, the results also found that the expression levels of MICB, ULBP1, ULBP2, ULBP3, RAET1E, RAET1G and RAET1L (except MICA) were consistent. In our study, the MICA gene was highly expressed in the tumor tissues of COAD patients, which is consistent with some previous results [34–38].
It has been reported that genetic and epigenetic alterations could be involved in the tumorigenesis and development process of cancers (such as colon cancer) and that these modifications and alterations could expose tumor cells to the immune system [39–41]. Our differential expression analysis results showed that ULBP1, ULBP2, ULBP3, and RAET1L had significant differential expression in COAD tumor and adjacent normal tissues. We then performed a diagnostic ROC curve analysis of the NKG2DL family genes and found that ULBP1, ULBP2, ULBP3 and RAET1L had high diagnostic values in COAD. A study by McGilvray et al. [42] on NKG2D ligands expression in a total of 462 primary colorectal tumors found that the majority of colorectal tumors expressed the NKG2D ligands. Kamei et al. [43] investigated the expression levels of ULBP genes and NKG2D in 98 patients who received surgery, human gastric cancer cell lines (MKN-74 cells) and gastric cancer tissues from 2004 to 2008, and they found high expression of ULBP1 and ULBP2/5/6 on the MKN-74 cells surface, and that the ULBP1 expression was positive in 70/98 cases. The same result was found in cholangiocarcinoma [44]. Kruijf et al. [45] studied 677 breast cancer patients from 1985 to 1994 to verify the expression of NKG2D ligands (NKG2DL) using immunohistochemical staining and they found that NKG2DL was frequently expressed by tumors (ULBP1, 90% of the cases; ULBP2, 99%; ULBP3, 100%; ULBP4, 26%; ULBP5, 90%).
The comprehensive analysis of prognostic values and diagnostic values of COAD based on the TCGA and GEO cohorts suggested that the ULBP2 might be an independent diagnosis and prognosis indicator (both of RFS and OS) in COAD. Additionally, in our study, we verified the ULBP2 expression in cells and tissues, and we also analyzed the diagnostic and prognostic values of ULBP2 in COAD. Our results found that ULBP2 expression in COAD tumor tissues was higher than in adjacent normal tissues. The survival analysis results suggested that the positive expression of ULBP2 indicated a poor prognosis of COAD. The diagnostic and prognostic values of ULBP2 in cancer were reported in a lot of previous studies. From the perspective of immunohistochemistry, Chang et al. [46] investigated the expression of ULBP2 in pancreatic cancer (PC) and ULBP2 serum levels in 154 early-stage PC patients and 142 healthy participants by means of an immunoassay. They found that ULBP2 was expressed more highly in PC tissues than in adjacent normal tissues and that the diagnostic ROC curve had a diagnostic value in PC (AUC = 0.862). A similar result was reported in the Zhou et al. [47] study, in which the AUC was 0.923. Li et al. [48] used immunohistochemical staining to examine the expression of the ULBP2 in tissues from 82 cases of ovarian cancer and 6 cases of tissues from patients without ovarian cancer. Their results showed that ULBP2 was expressed in 82.9% (68/82) of the cases, but not expressed in any of the normal ovarian tissues. They also analyzed the prognosis of ovarian cancer patients. The Kaplan-Meier curve and log-rank test suggested that the overall (75 ± 12 months) and progression-free (53 ± 11 months) survival of patients with high expression of ULBP2 was significantly worse than that of those with low expression of ULBP2 (112 ± 8 months, 107 ± 9 months, respectively), P < 0.05. In terms of immunohistochemical staining, Tsukagoshi et al. [44] analyzed 82 cases of extrahepatic cholangiocarcinoma (EHCC) tissues to test the expression of NKG2D ligands, and they found that high expression of ULBP2 was related overall and disease-free survival. Paschen et al. [41] used immunohistochemistry to examine the expression of ULBP2 in melanoma tissues and soluble molecules in sera from > 200 melanoma patients. They discovered that ULBP2 was highly expressed in melanoma tissues and that the high concentration of sULBP2 was significantly associated with disease progression, tumor load and reduction in overall survival. The prognostic value of ULBP2 was also reported in B-cell chronic lymphocytic leukemia (CLL), and the expression in 98 patients with CLL and 48 healthy participants as the control group was analyzed by means of ELISA. It was found that the sULBP2 was highly expressed in CLL patients (sULBP2 > 105 pg/mL) and associated with poor treatment-free survival (TFS) [49]. Besides, the prognostic value of ULBP2 was also found in ovarian cancer and breast cancer [21, 45]. Gao et al. [50] downloaded and analyzed the prognostic value of lncRNA, miRNA and mRNA genes in colon cancer patients from the TCGA database and found that ULBP2 is highly expressed in CC and the high expression of ULBP2 in CC indicated a poor prognosis for CC [51]. When Wang et al. collected and analyzed the mRNA datasets (DEmRNAs) related to COAD from the TCGA database they found that ULBP2 was highly expressed in COAD tumor tissues, and the low level of ULBP2 predicted a better prognosis in COAD OS. Similarly, Demirkol et al. [52] found that ULBP2 combined with the SEMA5A gene could be used as a prognostic and therapeutic indicator of CC from the dataset downloaded from the GEO database. Li et al. [53] explored and analyzed the prognostic indicators of CC from the GEO database and TCGA database and found that the upregulation of the ULBP2 gene was related to the shorter OS of CC patients. Rothe et al. [54] designed a fusion protein composed of human ULBP2 and a single chain derived from an antibody targeting tumor carcinoembryonic antigen (CEA) that could redirect NK cells to malignant cells by binding to tumor cells and NK cells, and triggered NK cell-mediated target cell killing in vitro.
However, our present study was certainly not without shortcomings and deficiencies. First, the clinical parameters we downloaded from the public website were not perfect (such as CA-199). Additionally, the sample size of our validation cohort was not large enough, and the number of cell validations was not large enough, which might affect our research results. Therefore, in the future, further in vivo and in vitro experiments should be performed for related investigations.
In conclusion, in this study, comprehensive analyses were conducted to determine the potential value of NKG2DL family genes in COAD. The mRNA expression levels of ULBP1, ULBP2, ULBP3, and RAET1L might be potential diagnostic biomarkers in COAD. The comprehensive univariate and multivariate analyses suggested that ULBP2 had prognostic value in COAD OS and RFS. We verified the prognostic value of ULBP2 from the CC-related GSE40967 dataset of the GEO database, and the results also suggested that ULBP2 had a prognostic value for the OS and RFS of CC patients. Therefore, ULBP2 might be an independent diagnostic and prognostic molecular biomarker of COAD. Finally, the verification study of the ULBP2 expression found that ULBP2 expression was relatively high in COAD tissues. We investigated the diagnostic and prognostic values of ULBP2 in COAD and found that ULBP2 had a certain diagnostic and prognostic value in COAD. Nonetheless, these still need prospective validation.
Materials and Methods
Public database information mining
The expression information for the NKG2DL family genes and clinical parameters corresponding to COAD patients was downloaded from The Cancer Genome Atlas (TCGA) database (https://tcga-data.nci.nih.gov/, obtained on December 10, 2019) [55, 56]. Additionally, to further complete the patient's clinical parameters, we also obtained consistent clinical parameters from the database of University of California, Santa Cruz Xena browser (UCSC Xena: http://xena.ucsc.edu/, obtained on December 10, 2019) [57, 58], which shares data with the TCGA database. Finally, to validate the prognostic value of the NKG2DL genes, we downloaded the GSE40967 dataset of NKG2DL gene expression and corresponding clinical parameters of colon cancer (CC)-related information from the Gene Expression Omnibus database (GEO, https://www.ncbi.nlm.nih.gov/geo/query/acc.cgi?acc=GSE40967, obtained on December 10, 2019) [59].
Bioinformatics analysis
To analyze the bio-enrichment function and metabolic pathways of the NKG2DL family genes, we downloaded the gene ontology (GO) term analysis and the Kyoto Encyclopedia of Genes and Genomes (KEGG) pathway analysis from the Database for Annotation, Visualization, and Integrated Discovery (DAVID) (https://david.ncifcrf.gov/; version 6.8; obtained on December 16, 2019) [60, 61]. We also investigated the GO enrichment function through the Biological Networks Gene Ontology (BiNGO) by means of Cytoscape_version 3.6.1 [62] and obtained related pathway information by downloading the database from KEGG (http://www.kegg.jp/, obtained on December 16, 2019) [63, 64]. Pearson’s correlation analyses of the NKG2DL genes were implemented using the co-expression matrix via the R platform. Finally, the potential correlation of NKG2DLs at the gene and protein levels were investigated using the public network tools of Gene Multiple Association Network Integration Algorithm (GeneMANIA, http://www.genemania.org/, obtained on December 19, 2019) [65] and Search Tool for the Retrieval of Interacting Genes (STRING, https://string-db.org/, obtained on December 19, 2019) [66, 67].
Expression levels of NKG2DL genes in the normal colon tissues and COAD tumor tissues
To obtain the expression levels of NKG2DL genes in normal colon tissues and COAD tumor tissues, we acquired the related expression information from Genotype-Tissue Expression (GTEx) portal (https://gtexportal.org/home, obtained on December 19, 2019) [68] and Gene Expression Profiling Interactive Analysis (GEPIA; http://gepia.cancer-pku.cn/index.html; obtained on December 19, 2019) [69] respectively.
Differential gene expression and diagnostic ROC curve analysis based on the TCGA cohort
The DESeq and edgeR [70, 71] datasets, downloaded from the TCGA database using the R platform, were used to investigate the differential expression of NKG2DLs in COAD through the expression of mRNAs between COAD tumor tissues and adjacent normal tissues. We considered the false discovery rate (FDR) to be < 0.05 and | log2 fold change (FC)| ≥ 2.0 was regarded as a significantly differential expression. Then, we analyzed their differential expressions and generated diagnostic ROC curves to compare COAD tumor tissues and adjacent normal tissues.
Survival analysis
We analyzed the prognostic values of NKG2DL genes of COAD patients based on the TCGA cohort and also validated the prognostic values of NKG2DL genes in CC patients from the GSE40967 cohort. The clinical information of COAD and CC patients was integrated with the expression levels of NKG2DL family genes and we established univariate and multivariate survival models to investigate the prognostic values of NKG2DL genes in COAD and CC according to the grouping of the median expression.
Comprehensive prognosis analysis of NKG2DL genes
The nomogram was performed using the R platform to analyze the contribution of prognostic clinical parameters (including prognostic genes) in COAD and CC. The greater the contribution, the higher the score, and the worse the prognosis. Besides, we investigated the correlation of prognostic genes to the TNM stage by downloading the data from the website of GEPIA. Finally, we established a prognostic risk model based on the prognostic risk score, which was the result of multiplying the expression level of the prognostic genes by the contribution coefficient (β). The relevant formula was as follows: risk score = expression of gene 1 × β of gene 1 + expression of gene 2 × β 2 of gene 2 + …+ expression of gene n × β n of gene n. [72, 73] Based on the grouping of the median expression, a univariate survival analysis was conducted to evaluate the relevant survival in COAD and CC, while the time-dependent survival ROC was performed using the survivalROC package in the R platform [74].
Verification of ULBP2 expression levels in COAD tumor tissue and adjacent normal tissue samples
Patient tissue samples
The COAD tissue samples and tissue wax blocks used in this study were all obtained by surgical resection at the Colorectal and Anal Surgery Department of the First Affiliated Hospital of Guangxi Medical University. The inclusion criteria included: (1) no age and sex restrictions, (2) resection of colon adenocarcinoma tumor, and (3) pathological diagnosis of COAD. The exclusion criteria included: (1) complicated by other known tumors, (2) receiving preoperative radiotherapy and chemotherapy, (3) refusing to provide written informed consent, and iv) tumor tissue too small to obtain specimens. All subjects gave their informed consent for inclusion before they participated in the study. The study was conducted in accordance with the Declaration of Helsinki, and the protocol was approved by the Ethics Committee of the First Affiliated Hospital of Guangxi Medical University. [Ethics no.: 2020(K-Y-E-050)].
Reverse transcription–quantitative polymerase chain reaction (RT-qPCR) of ULBP2 expressions of COAD in Guangxi cohort
After surgical removal, the tissue was quickly stored in a -80° C refrigerator. The following PCR primers were utilized: ULBP2, forward 5'- GAAAAGTGGGAGAATGACAAGG-3' and reverse 5'-GTCCTCAAGCCATCCTATACAG-3'; GAPDH, forward 5'-GTCAGCCGCATCTTCTTT-3' and reverse 5'-CGCCCAATACGACCAAAT-3'. ULBP2 gene expression was normalized to GAPDH expression. TRIzol® reagent was used (No. 15596026, Invitrogen) to extract total RNA from cells, followed by reverse transcription using a PrimeScriptTM RT reagent Kit with gDNA Eraser (Perfect Real Time, Takara Biomedical Technology (Beijing) Co., Ltd.) to obtain cDNA. Finally, we performed qPCR according to the guide of the Applied Biosystems QuantsudioTM Real-Time PCR System (Q6) (Applied Biosystems, Thermo Fisher Scientific, USA). The PCR program was composed of 1 cycle at 95° C for 10 min; 40 cycles at 95° C for 15 s, 60° C for 1 min and 95° C for 30 s; 1 cycle at 95° C for 15 s, 60° C for 1 min, 95° C for 30 sec, 60° C for 15 s. The relative expression of ULBP2 was determined using the method of 2 - ∆∆ Cq [75–77].
Immunohistochemistry (IHC) of ULBP2 expression in COAD from the Guangxi cohort
The tissues were fixed in formalin, dehydrated, and embedded in paraffin to make wax blocks, and then sliced to a thickness of 3-4μm. To perform IHC, the tissues were deparaffinized and dehydrated. EDTA antigen retrieval was performed under high pressure for 2.5 minutes, 3% H2O2 was used to block the endogenous reaction for 5 min. Next, the ULBP2 primary antibody (No.12143-RP02, Sino Biological, Beijing, China) was incubated at 4° C overnight, and the HRP secondary antibody (No. KIT-5020, MXB Biotechnologies, Fuzhou, China) was incubated for 1 h at 25° C. Finally, a DAB kit (No. DAB-0031, MXB Biotechnologies, Fuzhou, China) was incubated for 5 min, followed by counter-staining with hematoxylin for 5 min. The scoring criteria for IHC were as follows: percentage of positive cells, 0 (0%), 1 (1–25%), 2 (26–50%), 3 (51–75%), and 4 (76– 100%); staining intensity, 0 (negative), 1 (weak), 2 (moderate) and 3 (strong). The product of the two scores was the immunohistochemical staining score [78, 79].
Statistical analysis
All measurement data are expressed as mean ± standard deviation (x ± s). The analysis of the paired design used the paired t-test, the analysis of two random samples used the unpaired t-test, the comparison of means between multiple groups used single-factor variance (one-way ANOVA) analysis and the pairwise comparison of multiple samples means between samples used the SNK-q test. The log-rank test was done by the univariate Kaplan-Meier survival analysis, and univariate and multivariate survival analyses were examined on the level of the 95% confidence intervals (CIs) and hazard ratios (HRs). P < 0.05 was considered to be statistically different. Most of the statistical analyses were conducted using SPSS 20.0. Pearson correlation analysis, nomogram and survivalROC package were obtained using the R platform.
Supplementary Materials
Author Contributions
RGT wrote the manuscript. RGT, GYZ, GJL and GF made substantial contributions to the conception, design and intellectual content of the studies. RGT, WS, ZLC, LXW, WXK, LC, YL, XHL, and GYZ made key contributions to analysis and interpretation of data. All authors read and approved the final manuscript.
Acknowledgments
The present study was supported by the National Key Clinical Specialty Programs (General Surgery and Oncology) and the Key Laboratory of Early Prevention and Treatment for Regional High-Incidence-Tumor (Guangxi Medical University), Ministry of Education, China, to whom the authors would like to extend hearty thanks. Gratitude also goes to the contributors of TCGA (https://cancergenome.nih.gov/), UCSC Xena (http://xena.ucsc.edu/), and GEO (https://www.ncbi.nlm.nih.gov/geo/query/acc.cgi?acc=GSE4096) for sharing the COAD dataset on open access.
Conflicts of Interest
The authors declare that they have no conflicts of interest.
Funding
This work was sponsored in part by The Project to Improve the Basic Research Ability of Young and Middle-aged Teachers in Universities (2020KY12026), Innovation Project of Guangxi Graduate Education (YCBZ2020048), and Self-financing Scientific Research Project of Guangxi Zhuang Autonomous Region Health Commission, China (Z20180959). 2020KY12026, YCBZ2020048 and Z20180959 play roles in the analysis, interpretation of data, and writing of the manuscript.
References
- 1. Bray F, Ferlay J, Soerjomataram I, Siegel RL, Torre LA, Jemal A. Global cancer statistics 2018: GLOBOCAN estimates of incidence and mortality worldwide for 36 cancers in 185 countries. CA Cancer J Clin. 2018; 68:394–424. https://doi.org/10.3322/caac.21492 [PubMed]
- 2. Siegel RL, Miller KD, Jemal A. Cancer statistics, 2020. CA Cancer J Clin. 2020; 70:7–30. https://doi.org/10.3322/caac.21590 [PubMed]
- 3. Chen W, Zheng R, Baade PD, Zhang S, Zeng H, Bray F, Jemal A, Yu XQ, He J. Cancer statistics in China, 2015. CA Cancer J Clin. 2016; 66:115–32. https://doi.org/10.3322/caac.21338 [PubMed]
- 4. Zhang Z, Qian W, Wang S, Ji D, Wang Q, Li J, Peng W, Gu J, Hu T, Ji B, Zhang Y, Wang S, Sun Y. Analysis of lncRNA-associated ceRNA network reveals potential lncRNA biomarkers in human colon adenocarcinoma. Cell Physiol Biochem. 2018; 49:1778–91. https://doi.org/10.1159/000493623 [PubMed]
- 5. Thrumurthy SG, Thrumurthy SS, Gilbert CE, Ross P, Haji A. Colorectal adenocarcinoma: risks, prevention and diagnosis. BMJ. 2016; 354:i3590. https://doi.org/10.1136/bmj.i3590 [PubMed]
- 6. Jiang H, Du J, Gu J, Jin L, Pu Y, Fei B. A 65-gene signature for prognostic prediction in colon adenocarcinoma. Int J Mol Med. 2018; 41:2021–27. https://doi.org/10.3892/ijmm.2018.3401 [PubMed]
- 7. Yang Y, Li XJ, Li P, Guo XT. MicroRNA-145 regulates the proliferation, migration and invasion of human primary colon adenocarcinoma cells by targeting MAPK1. Int J Mol Med. 2018; 42:3171–80. https://doi.org/10.3892/ijmm.2018.3904 [PubMed]
- 8. Chen Y, Liu Y, Zhou Y, You H. Molecular mechanism of LKB1 in the invasion and metastasis of colorectal cancer. Oncol Rep. 2019; 41:1035–44. https://doi.org/10.3892/or.2018.6877 [PubMed]
- 9. Kozman MA, Fisher OM, Rebolledo BJ, Parikh R, Valle SJ, Arrowaili A, Alzahrani N, Liauw W, Morris DL. CEA to peritoneal carcinomatosis index (PCI) ratio is prognostic in patients with colorectal cancer peritoneal carcinomatosis undergoing cytoreduction surgery and intraperitoneal chemotherapy: a retrospective cohort study. J Surg Oncol. 2018; 117:725–36. https://doi.org/10.1002/jso.24911 [PubMed]
- 10. Chen T, Yu L, Li B, Zhang F, Wang Y, Wang X, Liu S, Yang C, Qi H, Yu M, Meng S, Chen T. Elevated preoperative carcinoembryonic antigen and vascular endothelial growth factor predict shorter survival in patients with sigmoid colon carcinoma. Clin Lab. 2017; 63:445–51. https://doi.org/10.7754/Clin.Lab.2016.160720 [PubMed]
- 11. Huang EY, Chang JC, Chen HH, Hsu CY, Hsu HC, Wu KL. Carcinoembryonic antigen as a marker of radioresistance in colorectal cancer: a potential role of macrophages. BMC Cancer. 2018; 18:321. https://doi.org/10.1186/s12885-018-4254-4 [PubMed]
- 12. Shinkins B, Nicholson BD, Primrose J, Perera R, James T, Pugh S, Mant D. The diagnostic accuracy of a single CEA blood test in detecting colorectal cancer recurrence: results from the FACS trial. PLoS One. 2017; 12:e0171810. https://doi.org/10.1371/journal.pone.0171810 [PubMed]
- 13. Ebert EC, Groh V. Dissection of spontaneous cytotoxicity by human intestinal intraepithelial lymphocytes: MIC on colon cancer triggers NKG2D-mediated lysis through fas ligand. Immunology. 2008; 124:33–41. https://doi.org/10.1111/j.1365-2567.2007.02656.x [PubMed]
- 14. Raulet DH. Roles of the NKG2D immunoreceptor and its ligands. Nat Rev Immunol. 2003; 3:781–90. https://doi.org/10.1038/nri1199 [PubMed]
- 15. González S, Groh V, Spies T. Immunobiology of human NKG2D and its ligands. Curr Top Microbiol Immunol. 2006; 298:121–38. https://doi.org/10.1007/3-540-27743-9_6 [PubMed]
- 16. Duan S, Guo W, Xu Z, He Y, Liang C, Mo Y, Wang Y, Xiong F, Guo C, Li Y, Li X, Li G, Zeng Z, et al. Natural killer group 2D receptor and its ligands in cancer immune escape. Mol Cancer. 2019; 18:29. https://doi.org/10.1186/s12943-019-0956-8 [PubMed]
- 17. Obeidy P, Sharland AF. NKG2D and its ligands. Int J Biochem Cell Biol. 2009; 41:2364–67. https://doi.org/10.1016/j.biocel.2009.07.005 [PubMed]
- 18. Bauer S, Groh V, Wu J, Steinle A, Phillips JH, Lanier LL, Spies T. Activation of NK cells and T cells by NKG2D, a receptor for stress-inducible MICA. Science. 1999; 285:727–29. https://doi.org/10.1126/science.285.5428.727 [PubMed]
- 19. Carapito R, Bahram S. Genetics, genomics, and evolutionary biology of NKG2D ligands. Immunol Rev. 2015; 267:88–116. https://doi.org/10.1111/imr.12328 [PubMed]
- 20. Cosman D, Müllberg J, Sutherland CL, Chin W, Armitage R, Fanslow W, Kubin M, Chalupny NJ. ULBPs, novel MHC class I-related molecules, bind to CMV glycoprotein UL16 and stimulate NK cytotoxicity through the NKG2D receptor. Immunity. 2001; 14:123–33. https://doi.org/10.1016/s1074-7613(01)00095-4 [PubMed]
- 21. McGilvray RW, Eagle RA, Rolland P, Jafferji I, Trowsdale J, Durrant LG. ULBP2 and RAET1E NKG2D ligands are independent predictors of poor prognosis in ovarian cancer patients. Int J Cancer. 2010; 127:1412–20. https://doi.org/10.1002/ijc.25156 [PubMed]
- 22. Zingoni A, Molfetta R, Fionda C, Soriani A, Paolini R, Cippitelli M, Cerboni C, Santoni A. NKG2D and its ligands: ”one for all, all for one“. Front Immunol. 2018; 9:476. https://doi.org/10.3389/fimmu.2018.00476 [PubMed]
- 23. Nanbakhsh A, Pochon C, Mallavialle A, Amsellem S, Bourhis JH, Chouaib S. c-Myc regulates expression of NKG2D ligands ULBP1/2/3 in AML and modulates their susceptibility to NK-mediated lysis. Blood. 2014; 123:3585–95. https://doi.org/10.1182/blood-2013-11-536219 [PubMed]
- 24. Diefenbach A, Jensen ER, Jamieson AM, Raulet DH. Rae1 and H60 ligands of the NKG2D receptor stimulate tumour immunity. Nature. 2001; 413:165–71. https://doi.org/10.1038/35093109 [PubMed]
- 25. Cerwenka A, Baron JL, Lanier LL. Ectopic expression of retinoic acid early inducible-1 gene (RAE-1) permits natural killer cell-mediated rejection of a MHC class I-bearing tumor in vivo. Proc Natl Acad Sci USA. 2001; 98:11521–26. https://doi.org/10.1073/pnas.201238598 [PubMed]
- 26. Peng YP, Zhu Y, Zhang JJ, Xu ZK, Qian ZY, Dai CC, Jiang KR, Wu JL, Gao WT, Li Q, Du Q, Miao Y. Comprehensive analysis of the percentage of surface receptors and cytotoxic granules positive natural killer cells in patients with pancreatic cancer, gastric cancer, and colorectal cancer. J Transl Med. 2013; 11:262. https://doi.org/10.1186/1479-5876-11-262 [PubMed]
- 27. Sheppard S, Ferry A, Guedes J, Guerra N. The paradoxical role of NKG2D in cancer immunity. Front Immunol. 2018; 9:1808. https://doi.org/10.3389/fimmu.2018.01808 [PubMed]
- 28. Wang YA, Li XL, Mo YZ, Fan CM, Tang L, Xiong F, Guo C, Xiang B, Zhou M, Ma J, Huang X, Wu X, Li Y, et al. Effects of tumor metabolic microenvironment on regulatory T cells. Mol Cancer. 2018; 17:168. https://doi.org/10.1186/s12943-018-0913-y [PubMed]
- 29. Hedlund M, Nagaeva O, Kargl D, Baranov V, Mincheva-Nilsson L. Thermal- and oxidative stress causes enhanced release of NKG2D ligand-bearing immunosuppressive exosomes in leukemia/lymphoma T and B cells. PLoS One. 2011; 6:e16899. https://doi.org/10.1371/journal.pone.0016899 [PubMed]
- 30. Unni AM, Bondar T, Medzhitov R. Intrinsic sensor of oncogenic transformation induces a signal for innate immunosurveillance. Proc Natl Acad Sci USA. 2008; 105:1686–91. https://doi.org/10.1073/pnas.0701675105 [PubMed]
- 31. Smyth MJ, Swann J, Cretney E, Zerafa N, Yokoyama WM, Hayakawa Y. NKG2D function protects the host from tumor initiation. J Exp Med. 2005; 202:583–88. https://doi.org/10.1084/jem.20050994 [PubMed]
- 32. Guerra N, Tan YX, Joncker NT, Choy A, Gallardo F, Xiong N, Knoblaugh S, Cado D, Greenberg NM, Raulet DH. NKG2D-deficient mice are defective in tumor surveillance in models of spontaneous Malignancy. Immunity. 2008; 28:571–80. https://doi.org/10.1016/j.immuni.2008.02.016 [PubMed]
- 33. Pende D, Rivera P, Marcenaro S, Chang CC, Biassoni R, Conte R, Kubin M, Cosman D, Ferrone S, Moretta L, Moretta A. Major histocompatibility complex class I-related chain A and UL16-binding protein expression on tumor cell lines of different histotypes: analysis of tumor susceptibility to NKG2D-dependent natural killer cell cytotoxicity. Cancer Res. 2002; 62:6178–86. [PubMed]
- 34. Watson NF, Spendlove I, Madjd Z, McGilvray R, Green AR, Ellis IO, Scholefield JH, Durrant LG. Expression of the stress-related MHC class I chain-related protein MICA is an indicator of good prognosis in colorectal cancer patients. Int J Cancer. 2006; 118:1445–52. https://doi.org/10.1002/ijc.21510 [PubMed]
- 35. Tang S, Fu H, Xu Q, Zhou Y. miR-20a regulates sensitivity of colorectal cancer cells to NK cells by targeting MICA. Biosci Rep. 2019; 39:BSR20180695. https://doi.org/10.1042/BSR20180695 [PubMed]
- 36. Maccalli C, Pende D, Castelli C, Mingari MC, Robbins PF, Parmiani G. NKG2D engagement of colorectal cancer-specific T cells strengthens TCR-mediated antigen stimulation and elicits TCR independent anti-tumor activity. Eur J Immunol. 2003; 33:2033–43. https://doi.org/10.1002/eji.200323909 [PubMed]
- 37. Chávez-Blanco A, De la Cruz-Hernández E, Domínguez GI, Rodríguez-Cortez O, Alatorre B, Pérez-Cárdenas E, Chacón-Salinas R, Trejo-Becerril C, Taja-Chayeb L, Trujillo JE, Contreras-Paredes A, Dueñas-González A. Upregulation of NKG2D ligands and enhanced natural killer cell cytotoxicity by hydralazine and valproate. Int J Oncol. 2011; 39:1491–99. https://doi.org/10.3892/ijo.2011.1144 [PubMed]
- 38. Doubrovina ES, Doubrovin MM, Vider E, Sisson RB, O’Reilly RJ, Dupont B, Vyas YM. Evasion from NK cell immunity by MHC class I chain-related molecules expressing colon adenocarcinoma. J Immunol. 2003; 171:6891–99. https://doi.org/10.4049/jimmunol.171.12.6891 [PubMed]
- 39. Mullany LE, Herrick JS, Wolff RK, Slattery ML. MicroRNA seed region length impact on target messenger RNA expression and survival in colorectal cancer. PLoS One. 2016; 11:e0154177. https://doi.org/10.1371/journal.pone.0154177 [PubMed]
- 40. Xing Y, Zhao Z, Zhu Y, Zhao L, Zhu A, Piao D. Comprehensive analysis of differential expression profiles of mRNAs and lncRNAs and identification of a 14-lncRNA prognostic signature for patients with colon adenocarcinoma. Oncol Rep. 2018; 39:2365–75. https://doi.org/10.3892/or.2018.6324 [PubMed]
- 41. Paschen A, Sucker A, Hill B, Moll I, Zapatka M, Nguyen XD, Sim GC, Gutmann I, Hassel J, Becker JC, Steinle A, Schadendorf D, Ugurel S. Differential clinical significance of individual NKG2D ligands in melanoma: soluble ULBP2 as an indicator of poor prognosis superior to S100B. Clin Cancer Res. 2009; 15:5208–15. https://doi.org/10.1158/1078-0432.CCR-09-0886 [PubMed]
- 42. Li Y, Wang X, Vural S, Mishra NK, Cowan KH, Guda C. Exome analysis reveals differentially mutated gene signatures of stage, grade and subtype in breast cancers. PLoS One. 2015; 10:e0119383. https://doi.org/10.1371/journal.pone.0119383 [PubMed]
- 43. Kamei R, Yoshimura K, Yoshino S, Inoue M, Asao T, Fuse M, Wada S, Kuramasu A, Furuya-Kondo T, Oga A, Iizuka N, Suzuki N, Maeda N, et al. Expression levels of UL16 binding protein 1 and natural killer group 2 member D affect overall survival in patients with gastric cancer following gastrectomy. Oncol Lett. 2018; 15:747–54. https://doi.org/10.3892/ol.2017.7354 [PubMed]
- 44. Tsukagoshi M, Wada S, Yokobori T, Altan B, Ishii N, Watanabe A, Kubo N, Saito F, Araki K, Suzuki H, Hosouchi Y, Kuwano H. Overexpression of natural killer group 2 member D ligands predicts favorable prognosis in cholangiocarcinoma. Cancer Sci. 2016; 107:116–22. https://doi.org/10.1111/cas.12853 [PubMed]
- 45. de Kruijf EM, Sajet A, van Nes JG, Putter H, Smit VT, Eagle RA, Jafferji I, Trowsdale J, Liefers GJ, van de Velde CJ, Kuppen PJ. NKG2D ligand tumor expression and association with clinical outcome in early breast cancer patients: an observational study. BMC Cancer. 2012; 12:24. https://doi.org/10.1186/1471-2407-12-24 [PubMed]
- 46. Chang YT, Wu CC, Shyr YM, Chen TC, Hwang TL, Yeh TS, Chang KP, Liu HP, Liu YL, Tsai MH, Chang YS, Yu JS. Secretome-based identification of ULBP2 as a novel serum marker for pancreatic cancer detection. PLoS One. 2011; 6:e20029. https://doi.org/10.1371/journal.pone.0020029 [PubMed]
- 47. Zhou YF, Xu LX, Huang LY, Guo F, Zhang F, He XY, Yuan YZ, Yao WY. Combined detection of serum UL16-binding protein 2 and macrophage inhibitory cytokine-1 improves early diagnosis and prognostic prediction of pancreatic cancer. Oncol Lett. 2014; 8:2096–102. https://doi.org/10.3892/ol.2014.2429 [PubMed]
- 48. Li K, Mandai M, Hamanishi J, Matsumura N, Suzuki A, Yagi H, Yamaguchi K, Baba T, Fujii S, Konishi I. Clinical significance of the NKG2D ligands, MICA/B and ULBP2 in ovarian cancer: high expression of ULBP2 is an indicator of poor prognosis. Cancer Immunol Immunother. 2009; 58:641–52. https://doi.org/10.1007/s00262-008-0585-3 [PubMed]
- 49. Nückel H, Switala M, Sellmann L, Horn PA, Dürig J, Dührsen U, Küppers R, Grosse-Wilde H, Rebmann V. The prognostic significance of soluble NKG2D ligands in B-cell chronic lymphocytic leukemia. Leukemia. 2010; 24:1152–59. https://doi.org/10.1038/leu.2010.74 [PubMed]
- 50. Wang WJ, Li HT, Yu JP, Han XP, Xu ZP, Li YM, Jiao ZY, Liu HB. A competing endogenous RNA network reveals novel potential lncRNA, miRNA, and mRNA biomarkers in the prognosis of human colon adenocarcinoma. J Surg Res. 2019; 235:22–33. https://doi.org/10.1016/j.jss.2018.09.053 [PubMed]
- 51. Gao Z, Fu P, Yu Z, Zhen F, Gu Y. Comprehensive analysis of lncRNA-miRNA- mRNA network ascertains prognostic factors in patients with colon cancer. Technol Cancer Res Treat. 2019; 18:1533033819853237. https://doi.org/10.1177/1533033819853237 [PubMed]
- 52. Demirkol S, Gomceli I, Isbilen M, Dayanc BE, Tez M, Bostanci EB, Turhan N, Akoglu M, Ozyerli E, Durdu S, Konu O, Nissan A, Gonen M, Gure AO. A combined ULBP2 and SEMA5A expression signature as a prognostic and predictive biomarker for colon cancer. J Cancer. 2017; 8:1113–22. https://doi.org/10.7150/jca.17872 [PubMed]
- 53. Li C, Shen Z, Zhou Y, Yu W. Independent prognostic genes and mechanism investigation for colon cancer. Biol Res. 2018; 51:10. https://doi.org/10.1186/s40659-018-0158-7 [PubMed]
- 54. Rothe A, Jachimowicz RD, Borchmann S, Madlener M, Keßler J, Reiners KS, Sauer M, Hansen HP, Ullrich RT, Chatterjee S, Borchmann P, Yazaki P, Koslowsky TC, et al. The bispecific immunoligand ULBP2-aCEA redirects natural killer cells to tumor cells and reveals potent anti-tumor activity against colon carcinoma. Int J Cancer. 2014; 134:2829–40. https://doi.org/10.1002/ijc.28609 [PubMed]
- 55. Hutter C, Zenklusen JC. The cancer genome atlas: creating lasting value beyond its data. Cell. 2018; 173:283–85. https://doi.org/10.1016/j.cell.2018.03.042 [PubMed]
- 56. Giordano TJ. The cancer genome atlas research network: a sight to behold. Endocr Pathol. 2014; 25:362–65. https://doi.org/10.1007/s12022-014-9345-4 [PubMed]
- 57. Casper J, Zweig AS, Villarreal C, Tyner C, Speir ML, Rosenbloom KR, Raney BJ, Lee CM, Lee BT, Karolchik D, Hinrichs AS, Haeussler M, Guruvadoo L, et al. The UCSC genome browser database: 2018 update. Nucleic Acids Res. 2018; 46:D762–69. https://doi.org/10.1093/nar/gkx1020 [PubMed]
- 58. Haeussler M, Zweig AS, Tyner C, Speir ML, Rosenbloom KR, Raney BJ, Lee CM, Lee BT, Hinrichs AS, Gonzalez JN, Gibson D, Diekhans M, Clawson H, et al. The UCSC genome browser database: 2019 update. Nucleic Acids Res. 2019; 47:D853–58. https://doi.org/10.1093/nar/gky1095 [PubMed]
- 59. Marisa L, de Reyniès A, Duval A, Selves J, Gaub MP, Vescovo L, Etienne-Grimaldi MC, Schiappa R, Guenot D, Ayadi M, Kirzin S, Chazal M, Fléjou JF, et al. Gene expression classification of colon cancer into molecular subtypes: characterization, validation, and prognostic value. PLoS Med. 2013; 10:e1001453. https://doi.org/10.1371/journal.pmed.1001453 [PubMed]
- 60. Huang DW, Sherman BT, Lempicki RA. Bioinformatics enrichment tools: paths toward the comprehensive functional analysis of large gene lists. Nucleic Acids Res. 2009; 37:1–13. https://doi.org/10.1093/nar/gkn923 [PubMed]
- 61. Dennis G
Jr , Sherman BT, Hosack DA, Yang J, Gao W, Lane HC, Lempicki RA. DAVID: database for annotation, visualization, and integrated discovery. Genome Biol. 2003; 4:P3. https://doi.org/10.1186/gb-2003-4-9-r60 [PubMed] - 62. Maere S, Heymans K, Kuiper M. BiNGO: a cytoscape plugin to assess overrepresentation of gene ontology categories in biological networks. Bioinformatics. 2005; 21:3448–49. https://doi.org/10.1093/bioinformatics/bti551 [PubMed]
- 63. Kanehisa M, Sato Y, Furumichi M, Morishima K, Tanabe M. New approach for understanding genome variations in KEGG. Nucleic Acids Res. 2019; 47:D590–95. https://doi.org/10.1093/nar/gky962 [PubMed]
- 64. Ruan GT, Zhu LC, Gong YZ, Liao XW, Wang XK, Liao C, Wang S, Yan L, Xie HL, Zhou X, Li YZ, Gao F. The diagnosis and prognosis values of WNT mRNA expression in colon adenocarcinoma. J Cell Biochem. 2020; 121:3145–61.
- 65. Mostafavi S, Ray D, Warde-Farley D, Grouios C, Morris Q. GeneMANIA: a real-time multiple association network integration algorithm for predicting gene function. Genome Biol. 2008 (Suppl 1); 9:S4. https://doi.org/10.1186/gb-2008-9-s1-s4 [PubMed]
- 66. von Mering C, Huynen M, Jaeggi D, Schmidt S, Bork P, Snel B. STRING: a database of predicted functional associations between proteins. Nucleic Acids Res. 2003; 31:258–61. https://doi.org/10.1093/nar/gkg034 [PubMed]
- 67. Szklarczyk D, Morris JH, Cook H, Kuhn M, Wyder S, Simonovic M, Santos A, Doncheva NT, Roth A, Bork P, Jensen LJ, von Mering C. The STRING database in 2017: quality-controlled protein-protein association networks, made broadly accessible. Nucleic Acids Res. 2017; 45:D362–68. https://doi.org/10.1093/nar/gkw937 [PubMed]
- 68. Ardlie KG, Deluca DS, Segre AV, Sullivan TJ, Young TR, Gelfand ET, Trowbridge CA, Maller JB, Tukiainen T, Lek M, Ward LD, Kheradpour P, Iriarte B, et al, and GTEx Consortium. Human genomics. The genotype-tissue expression (GTEx) pilot analysis: multitissue gene regulation in humans. Science. 2015; 348:648–60. https://doi.org/10.1126/science.1262110 [PubMed]
- 69. Tang Z, Li C, Kang B, Gao G, Li C, Zhang Z. GEPIA: a web server for cancer and normal gene expression profiling and interactive analyses. Nucleic Acids Res. 2017; 45:W98–102. https://doi.org/10.1093/nar/gkx247 [PubMed]
- 70. Shen L, Zhao L, Tang J, Wang Z, Bai W, Zhang F, Wang S, Li W. Key genes in stomach adenocarcinoma identified via network analysis of RNA-seq data. Pathol Oncol Res. 2017; 23:745–52. https://doi.org/10.1007/s12253-016-0178-y [PubMed]
- 71. Robinson MD, McCarthy DJ, Smyth GK. edgeR: a bioconductor package for differential expression analysis of digital gene expression data. Bioinformatics. 2010; 26:139–40. https://doi.org/10.1093/bioinformatics/btp616 [PubMed]
- 72. Liao X, Zhu G, Huang R, Yang C, Wang X, Huang K, Yu T, Han C, Su H, Peng T. Identification of potential prognostic microRNA biomarkers for predicting survival in patients with hepatocellular carcinoma. Cancer Manag Res. 2018; 10:787–803. https://doi.org/10.2147/CMAR.S161334 [PubMed]
- 73. Huang R, Liao X, Li Q. Identification and validation of potential prognostic gene biomarkers for predicting survival in patients with acute myeloid leukemia. OncoTargets Ther. 2017; 10:5243–54. https://doi.org/10.2147/OTT.S147717 [PubMed]
- 74. Heagerty PJ, Zheng Y. Survival model predictive accuracy and ROC curves. Biometrics. 2005; 61:92–105. https://doi.org/10.1111/j.0006-341X.2005.030814.x [PubMed]
- 75. Gong YZ, Ruan GT, Liao XW, Wang XK, Liao C, Wang S, Gao F. Diagnostic and prognostic values of integrin α subfamily mRNA expression in colon adenocarcinoma. Oncol Rep. 2019; 42:923–36. https://doi.org/10.3892/or.2019.7216 [PubMed]
- 76. Rong M, He R, Dang Y, Chen G. Expression and clinicopathological significance of miR-146a in hepatocellular carcinoma tissues. Ups J Med Sci. 2014; 119:19–24. https://doi.org/10.3109/03009734.2013.856970 [PubMed]
- 77. Zhu CQ, Ding K, Strumpf D, Weir BA, Meyerson M, Pennell N, Thomas RK, Naoki K, Ladd-Acosta C, Liu N, Pintilie M, Der S, Seymour L, et al. Prognostic and predictive gene signature for adjuvant chemotherapy in resected non-small-cell lung cancer. J Clin Oncol. 2010; 28:4417–24. https://doi.org/10.1200/JCO.2009.26.4325 [PubMed]
- 78. Ruan GT, Gong YZ, Liao XW, Wang S, Huang W, Wang XK, Zhu GZ, Liao C, Gao F. Diagnostic and prognostic values of C-X-C motif chemokine ligand 3 in patients with colon cancer. Oncol Rep. 2019; 42:1996–2008. https://doi.org/10.3892/or.2019.7326 [PubMed]
- 79. Zhang Y, Luo J, He R, Huang W, Li Z, Li P, Dang Y, Chen G, Li S. Expression and clinicopathological implication of DcR3 in lung cancer tissues: a tissue microarray study with 365 cases. OncoTargets Ther. 2016; 9:4959–68. https://doi.org/10.2147/OTT.S105225 [PubMed]