


Introduction
Hepatocellular carcinoma (HCC) is the sixth most frequently diagnosed and the fourth deadliest cancer worldwide [1]. Blamed on the occult early symptoms, a majority of HCC patients are diagnosed at advanced stages with metastasis [2]. Portal vein tumor thrombosis (PVTT) is a dominant form of intrahepatic vessel metastasis which occurs in 10 - 40% of HCC patients at first diagnosis [3, 4]. The formation of PVTT can induce intrahepatic metastasis, deteriorated hepatic function, poor tolerance to treatment, and a series of complications following portal hypertension [5]. The median overall survival (OS) of HCC patients with PVTT is merely 2.7 - 4.0 months if without effective treatments [6].
Characterizing molecular biomarkers between primary tumor (PT) and PVTT is necessary for the early diagnosis and treatment of HCC patients with PVTT. However, the knowledge about PVTT formation is limited so far [7, 8]. The similar transcriptional alternations between PT and PVTT implied PVTT might originate from PT by metastasis [9–11]. Contradictory, some alterations were identified between PT and paired PVTT in some HCC patients, which indicated PVTT might have different origins from PT, and high inter-patient heterogeneity exists [12, 13]. Ye et al. found osteopontin was over-expressed in metastatic HCC which could regulate invasion and metastasis of HCC cells [9]. Zhang et al. observed dysregulated genes involved with extracellular matrix (ECM)-receptor interaction might relate with the venous metastasis of HCC [14]. Wang et al. identified 20 recurrently and progressively differentially expressed genes (DEGs) from matched adjacent normal, PT, and PVTT samples. These genes participated in focal adhesion and xenobiotics metabolism, and many of them could regulate the invasion of HCC cells [13]. Besides, genomic variations [12], non-coding RNAs [10, 15], DNA methylation [16], cancer stem cells [17], along with the immune cells [18] and vascular endothelial cells [19] in the tumor microenvironment (TME) have been reported to contribute to the development of PVTT.
To learn the mechanisms of the formation of PVTT, this study investigated the DEGs between PT and PVTT tissues using the transcriptional profiles from the Gene Expression Omnibus (GEO) database. The mRNA expression, clinical relevance, prognostic significance, genetic alternations, DNA methylation, correlations with the immune infiltration, and biological functions of the DEGs in HCC were comprehensively explored applying integrated bioinformatic analyses. Our study might throw lights on the molecular mechanisms of PVTT formation and inspire novel insights for further researches and therapeutic strategies. The workflow of this study is displayed in Supplementary Figure 1.
Results
Identification of the DEGs between PT and PVTT tissues
To begin with, the DEGs were screened in each of the three GEO datasets. It turned out that 149, 50, and 463 DEGs were significantly upregulated (log2FC > 1, P < 0.05), while 4, 11, and zero DEGs were downregulated (log2FC < -1, P < 0.05) in PT compared with paired PVTT tissues in GSE69164, GSE77509, and GSE74656 datasets, respectively (Figure 1A–1C). Then, twelve upregulated DEGs, DCN, CCL21, IGJ (JCHAIN), SFRP4, MOXD1, CXCL14, STMN2, FCN3, COMP, LAMA2, CPA3, and NPY1R were found intersected among the three datasets (Figure 1D); while no overlapping downregulated DEGs was observed between GSE69164 and GSE77509 datasets (Figure 1E). The 12 DEGs that showed lower expression levels in PVTT than PT tissues might involve in the formation of PVTT, so they were further investigated in this study. The expression profiles of the 12 DEGs are shown in Figure 1F–1H and Table 1.
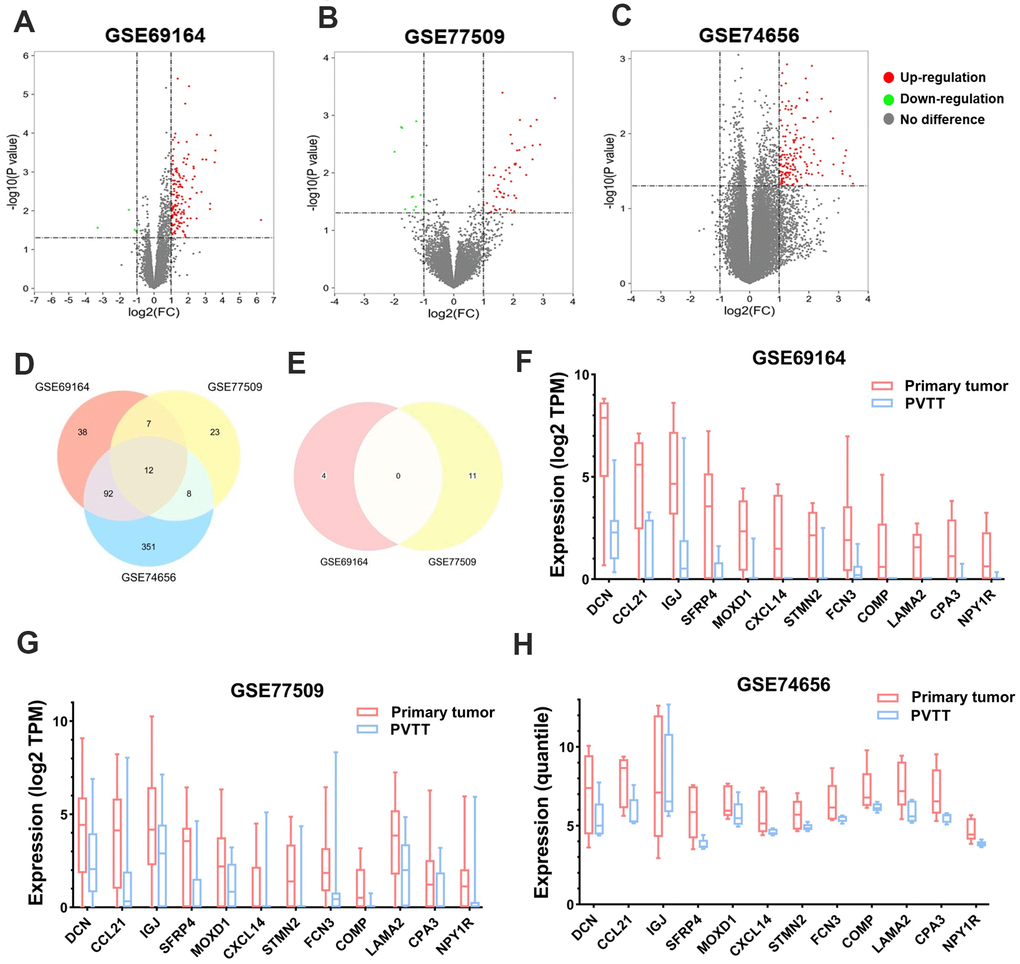
Figure 1. Identification of the DEGs between PT and PVTT tissues. Volcano plots showing the identification of the DEGs in (A) GSE69164, (B) GSE77509, and (C) GSE74656 datasets with the screening criteria of |log2(FC)| > 1 and P < 0.05. Dots in red or green represent upregulated or downregulated DEGs in PT compared with PVTT tissues, dots in grey represent genes without significant expressional differences. Venn diagrams showing the intersections of (D) upregulated and (E) downregulated DEGs among the three datasets. Since no downregulated DEGs was identified in dataset GSE74656, the Venn diagram for it was not drawn. The expression of the 12 overlapping upregulated DEGs in PT and PVTT tissues in datasets (F) GSE69164, (G) GSE77509, and (H) GSE74656. DEGs, differentially expressed genes; PT, primary tumor; PVTT, portal vein tumor thrombus; FC, fold change.
Table 1. Expression of the 12 DEGs in primary tumor compared with paired PVTT tissues in three GEO datasets.
| Gene symbol | Protein name | GSE69164 | GSE77509 | GSE74656 | |||||
| Log2FC | P value | Log2FC | P value | Log2FC | P value | ||||
| DCN | Decorin | 3.591 | 2.82E-04 | 1.542 | 4.29E-02 | 3.393 | 3.70E-02 | ||
| CCL21 | C-C motif chemokine 21 | 3.055 | 4.82E-04 | 2.897 | 3.24E-03 | 2.178 | 1.88E-02 | ||
| IGJ | Immunoglobulin J chain | 2.776 | 3.29E-03 | 2.035 | 2.49E-02 | 1.437 | 4.05E-02 | ||
| SFRP4 | Secreted frizzled-related protein 4 | 2.321 | 8.12E-04 | 1.927 | 1.41E-02 | 2.736 | 5.08E-03 | ||
| MOXD1 | DBH-like monooxygenase protein 1 | 1.912 | 1.68E-04 | 1.696 | 1.29E-02 | 1.078 | 7.01E-03 | ||
| CXCL14 | C-X-C motif chemokine 14 | 1.771 | 4.45E-04 | 2.224 | 8.05E-03 | 2.393 | 2.32E-02 | ||
| STMN2 | Stathmin-2 | 1.740 | 1.29E-03 | 3.396 | 5.04E-04 | 1.732 | 1.16E-02 | ||
| FCN3 | Ficolin-3 | 1.644 | 1.09E-02 | 1.386 | 4.36E-02 | 1.696 | 5.01E-02 | ||
| COMP | Cartilage oligomeric matrix protein | 1.478 | 1.77E-03 | 2.645 | 5.85E-03 | 1.382 | 2.98E-02 | ||
| LAMA2 | Laminin subunit alpha-2 | 1.389 | 3.95E-06 | 1.578 | 1.18E-02 | 1.951 | 4.88E-02 | ||
| CPA3 | Carboxypeptidase A4 | 1.107 | 7.80E-03 | 1.436 | 2.64E-02 | 1.601 | 4.22E-02 | ||
| NPY1R | Neuropeptide Y receptor type 1 | 1.050 | 8.74E-04 | 1.574 | 2.22E-02 | 1.942 | 3.62E-03 | ||
Expression of the DEGs in HCC and their clinical relevance
Following, the expression of the 12 DEGs in HCC tumors and normal liver samples was validated using TCGA data via GEPIA platform. It showed that the mRNA expression of DCN, CCL21, IGJ, CXCL14, FCN3, and NPY1R was significantly decreased in HCC compared with normal liver samples (Figure 2A).
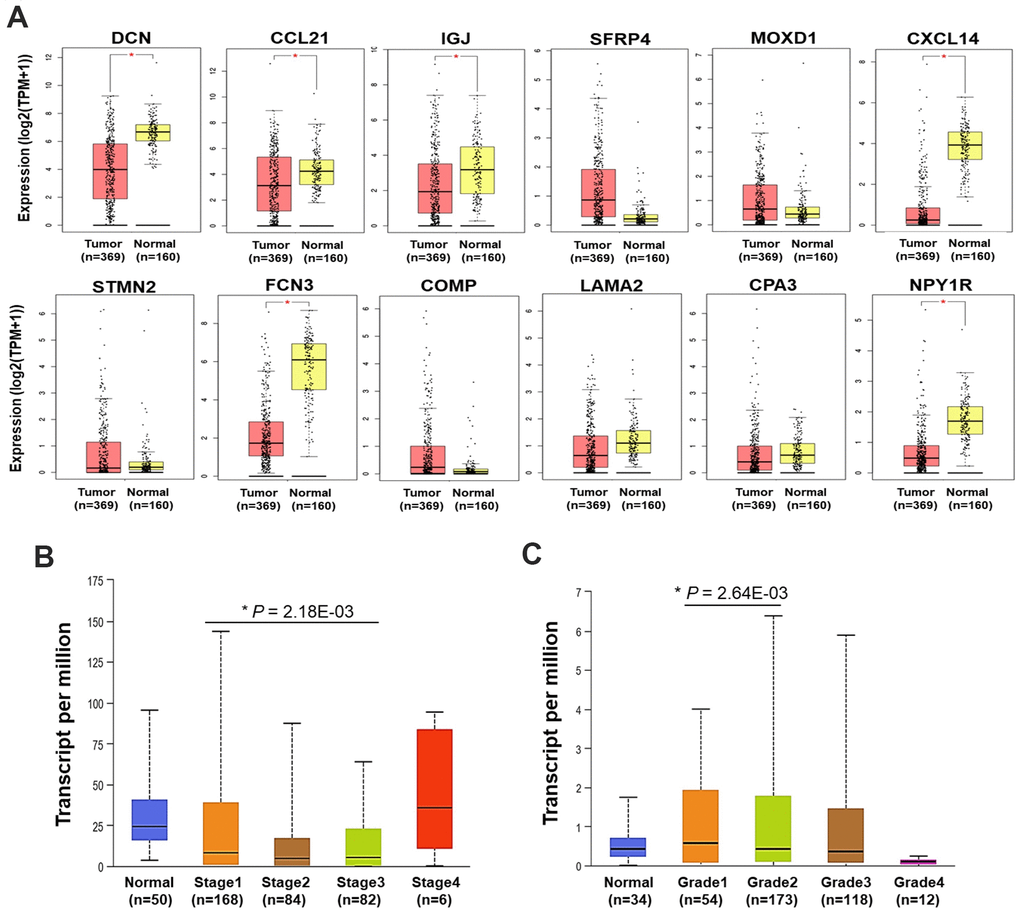
Figure 2. Expression and clinical relevance of the DEGs. (A) The expression of the 12 DEGs in HCC and normal liver samples (GEPIA) (*P < 0.05). (B) The expression of CCL21 in HCC and normal liver samples by different stages. (C) The expression of MOXD1 in HCC and normal liver samples by different grades. TPM, transcript per million.
Then, correlations between the expression of the 12 DEGs with the clinical characteristics were analyzed using UALCAN. In general, we found DCN, IGJ, CXCL14, FCN3, and NPY1R were significantly down-expressed, while SFRP4 and COMP were up-expressed in HCC samples with distinct genders, ages, stages, and grades, compared with normal liver samples (P < 0.05). Different from the findings in GEPIA platform, the down-expression of CCL21 in HCC was not statistically significant here, compared with normal liver samples (Supplementary Figure 2A–2D). Furthermore, the expression level of CCL21 in Stage-I HCC was higher than that in Stage-III HCC (P < 0.05) (Figure 2B). MOXD1 was expressed higher in Grade 1 tumor than that in Grade 2 tumor (P < 0.05) (Figure 2C).
Prognostic significance of the DEGs in all HCC patients
To discover the prognostic values of the 12 DEGs in HCC patients, survival analyses were performed using KM Plotter. As shown in Figure 3, high-expression of DCN (OS: HR = 0.7, P = 0.041; RFS: HR = 0.71, P = 0.042; PFS: HR = 0.73, P = 0.037) and FCN3 (OS: HR = 0.67, P = 0.022; RFS: HR = 0.63, P = 0.0066; PFS: HR = 0.66, P = 0.0048) was associated with longer OS, RFS, and PFS of all HCC patients. Upregulation of CCL21 (RFS: HR = 0.69, P = 0.019; PFS: HR = 0.67, P = 0.0076), IGJ (RFS: HR = 0.63, P = 0.006; PFS: HR = 0.67, P = 0.0084), and LAMA2 (RFS: HR = 0.67, P = 0.016; PFS: HR = 0.74, P = 0.043) linked with better RFS and PFS of all HCC patients. High-expression of NPY1R and CXCL14 associated with favorable OS (HR = 0.62, P = 0.0068) and RFS (HR = 0.65, P = 0.011) of all HCC patients, respectively. Except for the above, the expression of SFRP4, COMP, MOXD1, STMN2, and CPA3 presented no significant association with HCC patients’ prognosis.
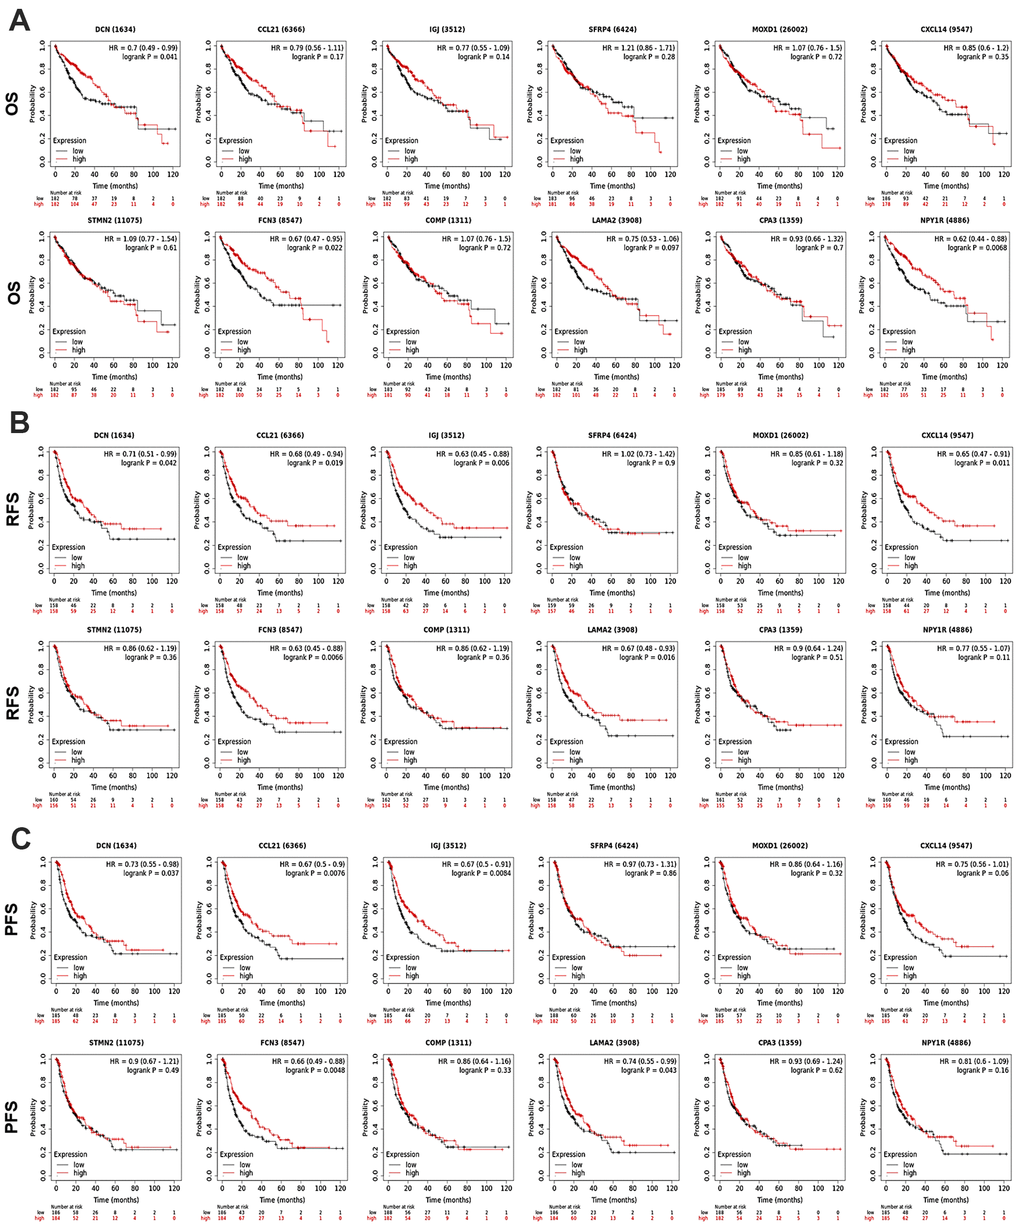
Figure 3. Prognostic significance of the DEGs in HCC patients (KM Plotter). The survival curves showed the associations between the expression of the 12 DEGs with (A) OS, (B) RFS, and (C) PFS of HCC patients. OS, overall survival; RFS, relapse free survival; PFS, progression free survival; HR, hazard ratio.
Prognostic values of the DEGs in HCC patients with diverse clinical characteristics
Subsequently, associations between the DEGs’ expression with OS and PFS of HCC patients with diverse clinical characteristics were further assessed. Male HCC patients with higher expression of FCN3 (HR = 0.60, P = 0.026) and NPY1R (HR = 0.53, P = 0.005) might have better OS; those patients with higher expression of DCN (HR = 0.62, P = 0.009), CCL21 (HR = 0.63, P = 0.012), IGJ (HR = 0.66, P = 0.023), FCN3 (HR = 0.67, P = 0.031), and LAMA2 (HR = 0.63, P = 0.012) might have better PFS. Elevated expression of IGJ (OS: HR = 0.61, P = 0.014; PFS: HR = 0.63, P = 0.021) and FCN3 (OS: HR = 0.61, P = 0.044; PFS: HR = 0.66, P = 0.037) linked with favorable OS and PFS; and high-expression of DCN (HR = 0.61, P = 0.014) and LAMA2 (HR = 0.63, P = 0.02) associated with better PFS of HCC patients without a family history of cancer (Supplementary Tables 1, 2).
In terms of etiological factors, high-expression of DCN (OS: HR = 0.31, P = 0.028; PFS: HR = 0.32, P = 0.002), IGJ (OS: HR = 0.61, P = 0.014; PFS: HR =0.43, P = 0.018), CXCL14 (OS: HR = 0.21, P = 0.007; PFS: HR =0.44, P = 0.019), and LAMA2 (OS: HR = 0.31, P = 0.029; PFS: HR = 0.36, P = 0.004) associated with both better OS and PFS of HCC patients with a history of hepatitis B; and upregulation of CCL21 (HR = 0.47, P = 0.031) and FCN3 (HR = 0.49, P = 0.044) associated with better PFS of these patients. As for HCC patients with alcohol consumption, high-expressed FCN3 (HR = 0.21, P = 0.0003) and NPY1R (HR = 0.47, P = 0.04) indicated better OS; LAMA2 (HR = 0.53, P = 0.032) suggested better PFS of these patients.
When it comes to pathological stages and grades, up-expression of IGJ (HR = 0.47, P = 0.005), STMN2 (HR = 0.51, P = 0.013), COMP (HR = 0.58, P = 0.044), and NPY1R (HR = 0.52, P = 0.014) related with favorable PFS of patients in advanced stages (Stage III-IV). NPY1R upregulation also indicated better OS (HR = 0.39, P = 0.002) of advanced-stage patients and better OS (HR = 0.51, P = 0.032) of patients with Grade 3 tumor. Besides, FCN3 overexpression linked with both favorable OS (HR = 0.58, P = 0.037) and PFS (HR = 0.64, P = 0.048) of patients with Grade 2 tumor.
Alternations of the DEGs in HCC patients
Next, alternations of the 12 DEGs in HCC patients were analyzed using cBioPortal. Overall, six kinds of alternations, including missense mutation, slice mutation, truncating mutation, amplification, deep deletion, and mRNA overexpression of the DEGs were observed in a total of 147 out of 360 (41%) HCC samples (Figure 4A). The most frequent alternation was mRNA overexpression which occurred in 47 (13.47%) cases (Figure 4B), and STMN2 was the most frequently (15%) altered gene. In Figure 4A, we could see some samples with alterations in one gene tended to have alterations in other genes. This observation could be supported by the results of co-occurrence analysis, that alterations in 12 pairs of genes significantly (P < 0.01) co-occurred in the same samples (Supplementary Table 3). The alternations of the DEGs indicated their potential participation in the development of HCC. However, the overall genetic alterations in the DEGs were not significantly related to OS of HCC patients (Figure 4C).
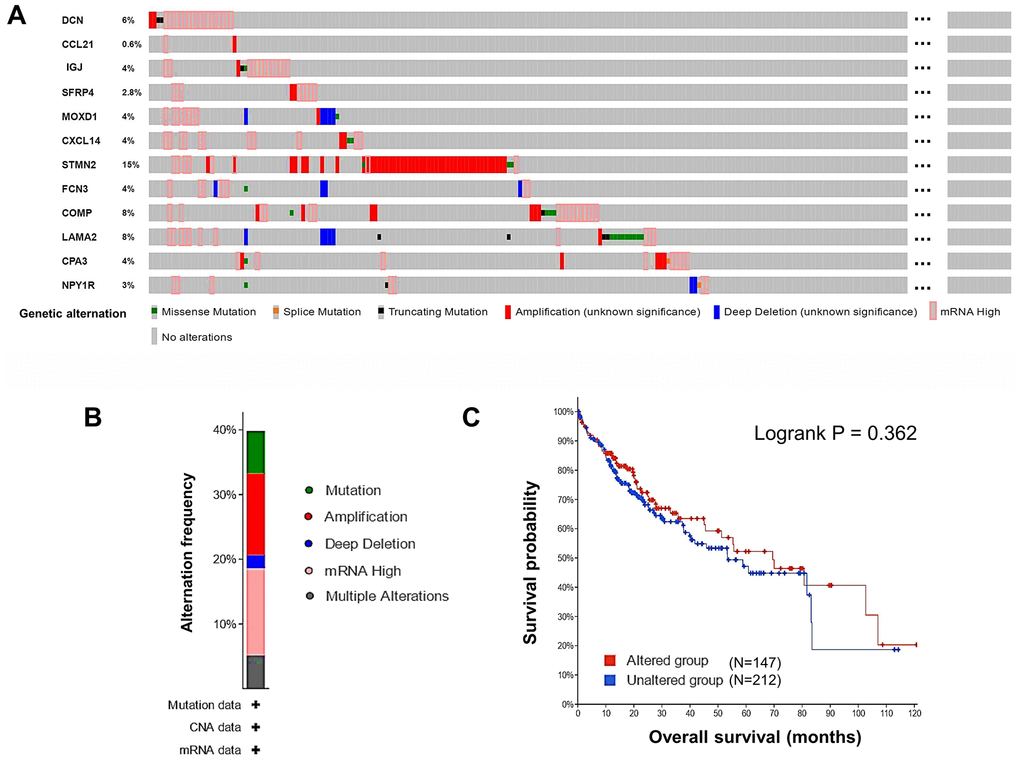
Figure 4. Genetic alternations of the DEGs in HCC patients (cBioPortal). (A) The overview of the genetic alternations occurring in the 12 DEGs in HCC patients from “TCGA, Firehose Legacy” dataset. (B) The summary graph of alternation frequency of the 12 DEGs in HCC patients. (C) The effect of the overall genetic alternations of the DEGs on OS of HCC patients.
Prognostic value of DNA methylation of the DEGs in HCC
Generally, the global DNA methylation of DCN, CCL21, IGJ, FCN3, and CPA3 was significantly decreased, while that of MOXD1 and NPY1R was significantly increased in HCC, compared with normal liver samples (Figure 5A). In detail, 9 CpG sites of DCN, 1 CpG site of CCL12, 2 CpG sites of IGJ, 16 CpG sites of SFRP4, 13 CpG sites of MOXD1, 11 CpG sites of CXCL14, 18 CpG sites of STMN2, 7 CpG sites of FCN3, 22 CpG sites of COMP, 33 CpG sites of LAMA2, 4 CpG sites of CPA3, and 18 CpG sites of NPY1R were found significantly differently methylated in HCC, compared with normal samples (Supplementary Table 4). The DNA methylation density of DCN, SFRP4, CXCL14, STMN2, FCN3, COMP, and LAMA2 was positively, while that of NPY1R was negatively correlated with the mRNA expression level of the corresponding genes in HCC (Supplementary Figure 3). Moreover, the methylation level of one CpG site of DCN, three CpG sites of SFRP4, one CpG site of MOXD1, one CpG site of STMN2, one CpG site of COMP, two CpG sites of LAMA2, and two CpG sites of NPY1R was significantly associated with OS of HCC patients (Figure 5B).
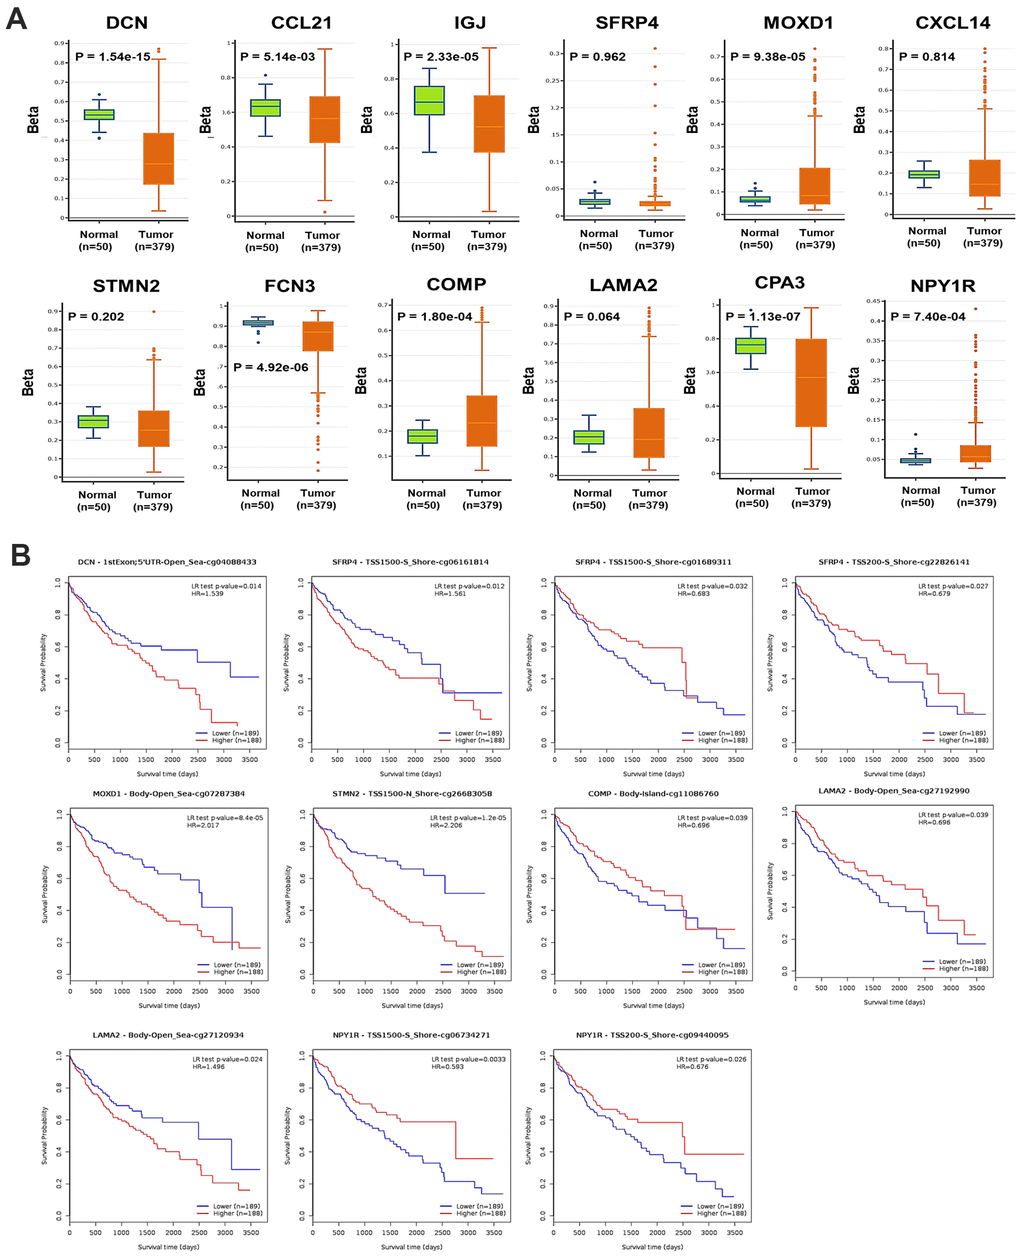
Figure 5. DNA methylation of the DEGs in HCC. (A) The global DNA methylation level of the 12 DEGs in HCC and normal liver samples (DNMIVD). (B) The associations between the methylation level of CpG sites of the DEGs with the OS of HCC patients (MethSurv).
Correlations between the expression of DEGs and immune infiltration in HCC
Because immune infiltration plays critical roles in the progression of cancers [20], correlations between the expression of DEGs and the immune infiltration in HCC were investigated by TIMER server. Tumor purity is defined as the proportion of cancer cells in the tumor admixture, which can interfere with the evaluation of immune infiltration. Thus, the correlation analysis of immune infiltration was adjusted with the corresponding tumor purity of samples [21]. As shown in Figure 5, the expression of the 12 DEGs was all negatively correlated to the tumor purity, which suggested the expression of these genes might be mainly from cells in the TME, rather than cancer cells.
Notably, we found the expression of DCN, CCL21, IGJ, SFRP4, MOXD1, CXCL14, STMN2, COMP, LAMA2, CPA3, and NPY1R was almost conformably positively correlated with the infiltration level of CD8+ T cells, CD4+ T cells, B cells, neutrophils, macrophages, and DCs, but negatively correlated with that of NK cells (except for COMP with CD8+ T cells, LAMA2 with B cells, CPA3 with B cells and NK cells, along with NPY1R with B cells and macrophages) (P < 0.05). In addition, the expression of FCN3 was positively correlated with the infiltration level of CD8+ T cells and macrophages (Figure 6).
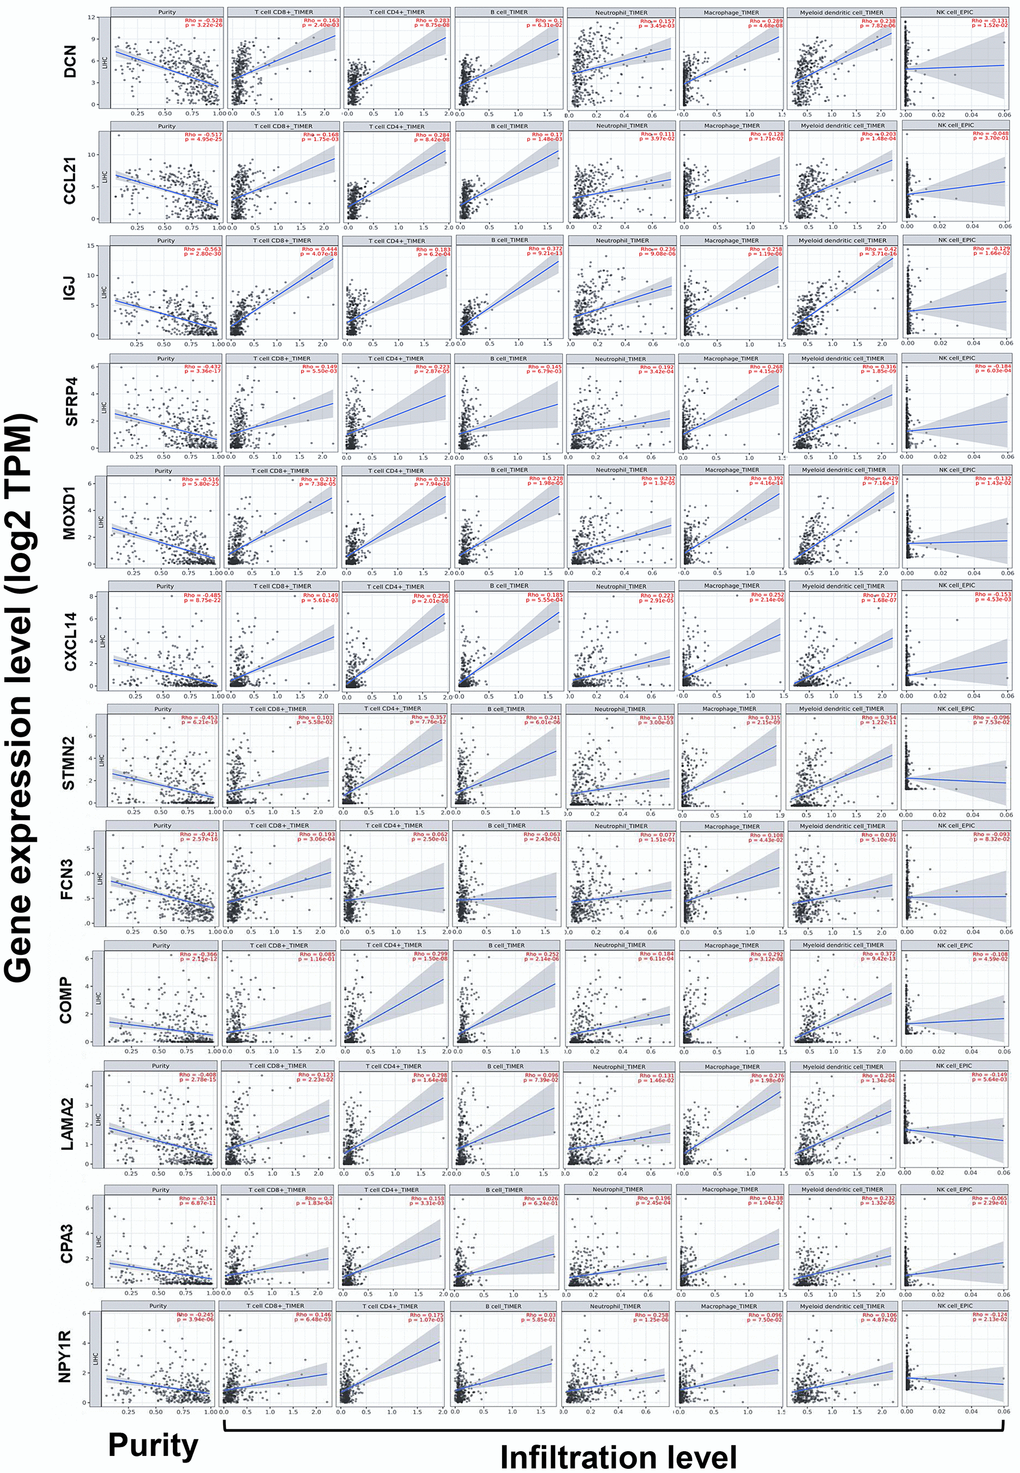
Figure 6. Correlations between the expression of the DEGs with immune infiltration in HCC (TIMER). Correlations between the expression of the 12 DEGs with tumor purity, and infiltration level of CD8+ T cells, CD4+ T cells, B cells, neutrophils, macrophages, DCs, and NK cells in HCC. DCs, dendritic cells; NK cells, natural killer cells.
Intergenic correlations, co-expression network, and functions of the DEGs
To deeply understand the characters of the DEGs play in HCC, intergenic correlations among the DEGs were analyzed, a co-expression network was constructed, and functional annotation analysis was conducted. The results of intergenic correlation analyses implied the DEGs correlated with each other closely with strong or moderate correlation strength (P < 1.00E-05) (Figure 7A). Then, 20 co-expressive genes of the 12 DEGs were identified using GeneMANIA, so the network was composed of 32 genes totally (Figure 7B). The functional enrichment analyses expounded the genes in the co-expression network were components of ECM, and mainly took part in the biological processes of ECM organization, cell adhesion, and glycoprotein synthesis, together with the binding of integrin, calcium ion, collagen, and so on (Figure 7C). Moreover, these genes were involved in signaling pathways of ECM-receptor interaction, focal adhesion, phosphoinositide 3-kinase-protein kinase B (PI3K-Akt), and proteoglycans in cancer (Figure 7D).
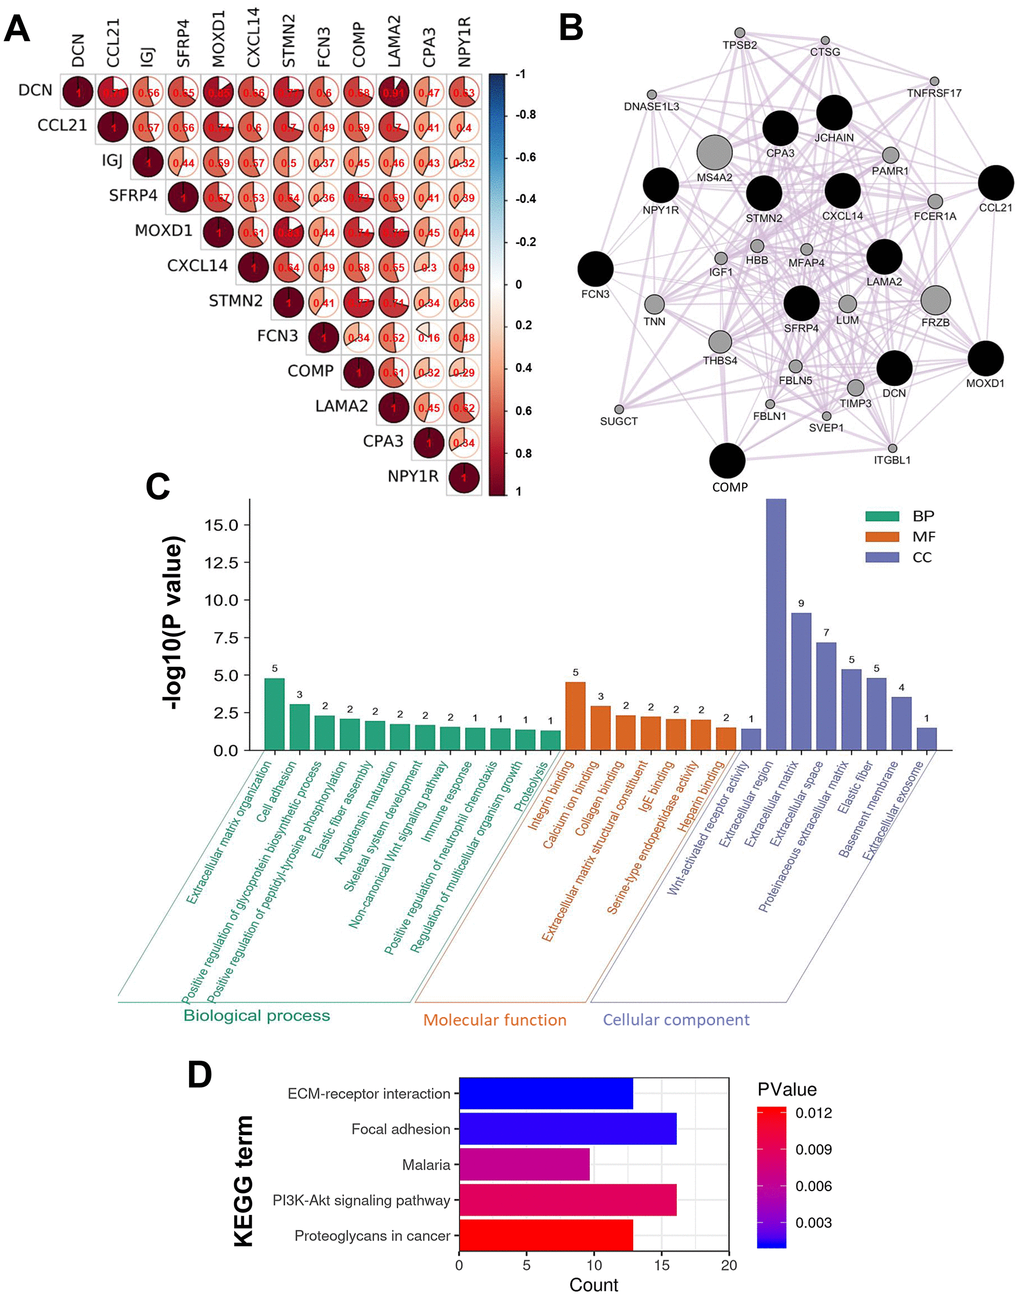
Figure 7. Intergenic correlations, co-expression network, and the biological functions of the DEGs. (A) Intergenic correlations of the 12 DEGs. (B) The co-expression network of the 12 DEGs constructed by GeneMANIA. Edges in the network represent the co-expression relations among genes. The results of (C) GO and (D) KEGG functional enrichment analyses for all the genes in the co-expression network.
Discussion
The current study identified not many DEGs between PT and PVTT tissues, and a vast majority of them were low-expressed in PVTT compared with paired PT tissues (Figure 1), which was consistent with the previous studies [13, 14]. Among the 12 DEGs, the expression level of DCN, CCL21, IGJ, CXCL14, FCN3, LAMA2, and NPY1R was progressively decreased from normal liver, PT, to PVTT (all were significantly except for LAMA2), and the up-expression of them linked with favorable survivals of all HCC patients (Figure 3). Also, the upregulation of them (except for NPY1R) indicated better outcomes of HCC patients with a history of hepatitis B, though hepatitis B virus infection is an independent risk factor of HCC vascular invasion [15, 22, 23]. Notably, high expression of NPY1R implied both favorable OS and PFS of patients in advanced stages or with high-grade tumors (Supplementary Tables 1, 2).
The tumor-suppressive effects of the above seven genes had been illuminated before. DCN is a small leucine-rich proteoglycan acting as a powerful cancer repressor by blocking receptor tyrosine kinases [24], whose expression was decreased in HCC compared with normal liver tissues and followed the staging [25]. Chemokine CCL21 and its unique receptor CCR7 had been described as vital factors determining cancer lymph node metastasis, and they were observed elevated in colorectal liver metastases [26]. IGJ is the joining chain of multimeric IgA and IgM, whose upregulation might augment the anticancer immune responses by Sorafenib treatment and favored survivals of HCC patients [27]. C-x-C motif chemokine CXCL14 was found stably lower regulated in HCC than normal liver tissues [28], whose up-expression could attract DCs, T cells, and NK cells to enhance immunosurveillance, together with inhibiting angiogenesis and aggressiveness in HCC [29, 30]. FCN3 is a member of the ficolin family with lectin activity. It was reported that HCC patients with a higher serologically FCN3 level tended to have longer DFS after radiofrequency ablation treatment [31]. LAMA2 is a kind of ECM protein that was ever found frequently high-allelic mutated in HCC, and a lower expression of LAMA2 might correlate with a higher chance of recurrence and poorer survivals of HCC patients [32]. NPY1R was ever reported with the capability of restraining HCC cell proliferation via inactivating mitogen-activated protein kinase (MAPK) signaling, and it was usually significantly decreased in HCC [33].
As for the other DEGs, COMP, STMN2, and CPA3 were ever reported to play vicious roles in HCC, and SFRP4 played a benign one, while the character of MOXD1 in HCC had not been explained yet [34]. COMP is a large pentameric glycoprotein that can promote fibrillogenesis in liver [35], and it might facilitate HCC invasion and metastasis by activating PI3K-Akt signaling [36]. STMN2 is a component of the stathmin family, whose overexpression was critical for maintaining Wnt/β-catenin/TCF mediated hepatic carcinogenesis [37, 38]. CPA3 is a kind of metallo-carboxypeptidase that modulates inflammation, fibrosis, and stem cell niche formation in liver cancer [39], whose overexpression might associate with worse grades, stages, and prognosis of patients [40]. We didn’t find any prognostic significance of CPA3 in HCC patients, but we found the up-expression of STMN2 and COMP was related to favorable PFS of advanced-stage patients (Supplementary Table 2). The insufficient sample size might cause the paradoxical findings; thus, explorations with a larger sample size are still needed. SFRPs are known as cancer suppressors by block Wnt signaling pathway, whose promoter methylation can reduce the normal expression of SFRP4 and promote HCC [41]. A systematic review demonstrated hypermethylation of SFRP4 was a risk factor of cancer with an odds ratio (OR) of 11.41 [42]. MOXD1 belongs to the copper-dependent monooxygenase family, whose knockdown would suppress the proliferation of osteosarcoma cells via inducing apoptosis [34]. In the current study, we found methylated CpG sites of DCN, SFRP4, MOXD1, STMN2, COMP, and NPY1R significantly affected OS of HCC patients (Figure 6B).
It could be noticed the alternation of mRNA overexpression occurred frequently in the DEGs (Figure 4B), but most of the DEGs were low-expressed in HCC. Additionally, the DNA methylation of several DEGs was significantly correlated with their expression level (Supplementary Figure 3). Therefore, we suspected that abnormal methylation might induce transcriptional silencing of some DEGs to influence their anticancer or pro-cancer functions, but further validations are required. To sum up, seven DEGs, DCN, CCL21, IGJ, CXCL14, FCN3, LAMA2, and NPY1R might play anticancer roles in HCC, whose progressive down-regulation in the liver might promote the initiation of HCC and even venous metastasis. Besides, the DNA methylation of DCN, SFRP4, MOXD1, STMN2, COMP, and NPY1R might also concerned with the progression of HCC.
After that, we observed the expression of most DEGs were significantly correlated with the infiltration density of multiple TIICs (Figure 5). It is acknowledged that CD8+ T cells and NK cells can be motivated by DCs and then exert effective anticancer immune surveillance [43]. Although the role of B cells in HCC remains controversial, the interactions between T cells and B cells might imply better outcomes [44]. CD4+ T cells, tumor-associated macrophages (TAMs), and tumor-associated neutrophils (TANs) act flexibly in HCC, depending on the release of different cytokines and chemokines. TAMs and TANs can polarize into two subtypes respectively, the M1/N1-type ones can amplify anticancer immunity, whereas the M2/N2-type ones act oppositely [45]. Generally speaking, substantial activation of effective TIICs in the TME restrains carcinogenesis and cancer progression [15, 46]. Hence, we could summarize the DEGs might regulate HCC progression partly through modulation of immune infiltration.
The results of alternation occurrence analysis and intergenic correlation analysis implied the DEGs correlated with each other closely (Figure 7A and Supplementary Table 3). And the DEGs’ co-expressive genes were mostly involved in ECM organization, focal adhesion, along with the binding of integrin and collagen (Figure 7), which was consistent with the previous studies [14, 16]. As we know, the TME is formed by cellular components (stroma cells, immune cells, and endothelial cells, etc.), and non-cellular components produced by these cells (ECM, inflammatory cytokines, and growth factors, etc.) [47]. ECM is a complex network performing as a structural scaffold and is mainly consisted of fibrous proteins (eg, collagen) and proteoglycans. The 12 DEGs were components of ECM, which explained the negative correlations between their expression and the tumor purity, since they should be expressed by stroma cells (eg, fibroblasts) in the TME.
For most solid cancers, the metastatic cascade starts with cancer cells breaching the basement membrane and navigating away from the primary site. In some appropriate contexts, the ECM could be an obstacle for cancer metastasis, however, remodeled ECM inclines to be a cancer promoter [48]. Abnormal deposition and stiffness of ECM can promote malignant behaviors of cancer cells, facilitate the colonization of disseminated cancer cells, and mutually interact with immune-suppressive TIICs [49, 50]. Integrins are surface receptors mediating cell-matrix and cell-cell adhesion, which transmit bidirectional signals between cancer cells and the ECM. Integrins are also key components of migration machinery, which determine the colonization sites of metastatic cells and facilitate the survival of these cells [51, 52]. In fact, several pro-survival signals such as PI3K and MAPK pathways should depend on cells that adherent to the ECM via integrins, and the ECM molecules may amplify these signals [53]. In brief, components of the TME interact with each other intricately in cancer progression, our results indicated the DEGs might regulate cancer venous metastasis through alternations of ECM, focal adhesion, and immune infiltration.
Conclusions
This study discovered 12 DEGs between PT and PVTT tissues, which might contribute to PVTT development through modulating ECM organization, focal adhesion, and immune infiltration in the TME. The expression of DCN, CCL21, IGJ, CXCL14, FCN3, LAMA2, and NPY1R was progressively decreased from normal liver, PT, to PVTT tissues, which might promote the tumorigenesis and venous metastasis of HCC, and whose high-expression might serve as favorable prognostic biomarkers of HCC patients. Additionally, several methylated CpG sites of DCN, SFRP4, MOXD1, STMN2, COMP, and NPY1R might influence outcomes of HCC patients. This study helps to elucidate the molecular mechanisms underlying PVTT formation and provides several genes worthy to further explore.
Materials and Methods
Data collection
The gene expression data of a total of 36 pairs of human HCC PT and PVTT samples from three datasets were downloaded from the GEO database (https://www.ncbi.nlm.nih.gov/geo/). Datasets GSE69164, GSE77509, and GSE74656 contributed 11, 20, and 5 pairs of samples, respectively. The samples in GSE69164 and GSE77509 were detected by high throughput sequencing using Illumina HiSeq 2000 (GPL11154) and Illumina HiSeq 2500 (GPL16791) respectively; the samples in GSE74656 were processed using GeneChip PrimeView Human Gene Expression Array (GPL16043).
Data processing and DEGs identification
The mRNA sequencing data were normalized into transcripts per million (TPM) values. Microarray data were normalized into quantile values, and the median value was used as the expression value if several probes matched a single gene. The probe names of the microarray were transformed into gene symbols using the annotation files supplied by the manufacturer. The DEGs between PT and paired PVTT samples in each GEO dataset were analyzed by the “limma” package in R software (Version 4.0.3) with the cutoff criteria of |log2(fold change, FC)| > 1 and P < 0.05, and the results of which were visualized as volcano plots by the “ggplot2” package [54]. Then, the overlapping DEGs among the three datasets, as identified by Venn diagrams, were regarded as reliable DEGs for our further investigations.
Analysis of the expression of the DEGs in HCC patients with distinct clinical features
The mRNA expression of the DEGs in HCC and normal liver tissues was analyzed by Gene Expression Profiling Interactive Analysis (GEPIA) web tool (http://gepia.cancer-pku.cn) using data from the Cancer Genome Atlas (TCGA) and the GTEx projects [55]. The significance threshold was set as FC > 2 and P < 0.05.
The associations between the expression of the DEGs and clinical features of HCC patients, including genders, ages, stages, and tumor grades were explored using UALCAN (http://ualcan.path.uab.edu), which is an interactive platform for in-depth analysis of cancer omics data from TCGA [56].
Survival analysis of the DEGs
Kaplan-Meier (KM) Plotter (http://www.kmplot.com/) is an online tool for survival analysis of 54k genes in 21 types of cancers, whose data sources include GEO, TCGA, and European Genome-phenome Archive [57]. Associations between the DEGs’ expression and OS, relapse free survival (RFS), and progression free survival (PFS) of all HCC patients were analyzed by KM Plotter.
Prognostic values of the DEGs on OS and PFS of HCC patients with distinct clinical parameters were also assessed integrating KM Plotter and another prognosis analysis tool, Online consensus Survival for liver hepatocellular carcinoma (OSlihc, http://bioinfo.henu.edu.cn/) [58]. All cases were split into two groups by the median value of a gene’s expression level and univariant analysis was conducted.
Analysis of genomic alternations of the DEGs
cBioPortal (http://www.cbioportal.org/) is a web resource providing multidimensional cancer genomics data [59, 60]. Genomic alternation profiles of the DEGs including mutations, putative copy-number alterations (CNA), and mRNA expression (z-scores relative to diploid samples with a score threshold of ± 2.0) were analyzed using the data of 360 HCC patients in “TCGA, Firehose Legacy” dataset by cBioPortal. The co-occurrence tendency of pairs of alterations in any two DEGs was analyzed by Fisher’s exact test. Moreover, all available cases were split into altered and unaltered groups, the univariant analysis was conducted to discover the effect of the genetic alternations of the DEGs on survivals of HCC patients.
Correlations between the DEGs’ expression and immune infiltration in HCC
Tumor IMmune Estimation Resource (TIMER) (http://timer.cistrome.org) is a web server for the investigation into tumor-immune interactions covering 32 kinds of cancers from TCGA [64]. The correlations between the DEGs expression and infiltration level of diverse tumor-infiltrating immune cells (TIICs), including CD8+ T cells, CD4+ T cells, B cells, neutrophils, macrophages, dendritic cells (DCs), and natural killer (NK) cells in HCC were assessed by TIMER.
Co-expression analysis of the DEGs and functional enrichment analysis
Intergenic correlations of the DEGs were analyzed using GEPIA platform. A co-expression network of the DEGs was constructed using GeneMANIA (http://genemania.org) [65]. Gene Ontology (GO) and Kyoto Encyclopedia of Genes and Genomes (KEGG) pathway enrichment analysis was performed for the component genes in the co-expression network, using Database for Annotation, Visualization, and Integrated Discovery (DAVID) server (https://david.ncifcrf.gov/home.jsp) [66].
Statistical analysis
The student’s t-test was applied to compare differences in mRNA expression or DNA methylation of genes between two kinds of tissues. Kaplan-Meier curves and log-rank test were performed to explore the associations between expression or DNA methylation of genes and patients’ survivals. Spearman’s method was applied to evaluate the intergenic correlations, correlations between gene expression and DNA methylation, or correlations between gene expression and immune infiltration. Correlation strength was measured by correlation coefficient values: 0.00 - 0.19 was “very weak”, 0.20 - 0.39 was “weak”, 0.40 - 0.59 was “moderate”, 0.60 - 0.79 was “strong”, and 0.80 -1.0 was “very strong” [67, 68]. All tests were two-tailed paired and P values < 0.05 were considered statistically significant.
Data availability statement
All the data that support the findings of this study are publicly available in: https://www.oncomine.org/resource/login.html, http://gepia.cancer-pku.cn, http://ualcan.path.uab.edu, http://www.cbioportal.org/, http://www.kmplot.com/, http://bioinformatica.mty.itesm.mx:8080/Biomatec/SurvivaX.jsp, http://timer.cistrome.org, http://www.unimd.org/dnmivd/, http://biobigdata.hrbmu.edu.cn/survivalmeth/, https://biit.cs.ut.ee/methsurv/, http://genemania.org, https://david.ncifcrf.gov/home.jsp, together with the Supplementary Materials.
Supplementary Materials
Author Contributions
LT designed the study, conducted the bioinformatics analyses, and drafted the original manuscript. LZ studied the relevant literature and collected data. MP edited and refined the figures. ZE polished the language of the whole manuscript. PL provided the original ideas for this study and gave revision comments of the manuscript. All authors read, contributed to the revision of the manuscript, and approved the submitted version.
Conflicts of Interest
The authors declare that they have no conflicts of interest.
References
- 1. Bray F, Ferlay J, Soerjomataram I, Siegel RL, Torre LA, Jemal A. Global cancer statistics 2018: GLOBOCAN estimates of incidence and mortality worldwide for 36 cancers in 185 countries. CA Cancer J Clin. 2018; 68:394–424. https://doi.org/10.3322/caac.21492 [PubMed]
- 2. Duran SR, Jaquiss RD. Hepatocellular Carcinoma. N Engl J Med. 2019; 381:e2. https://doi.org/10.1056/NEJMc1906565 [PubMed]
- 3. Cheng S, Chen M, Cai J, Sun J, Guo R, Bi X, Lau WY, Wu M. Chinese expert consensus on multidisciplinary diagnosis and treatment of hepatocellular carcinoma with portal vein tumor thrombus (2018 edition). Liver Cancer. 2020; 9:28–40. https://doi.org/10.1159/000503685 [PubMed]
- 4. Lu J, Zhang XP, Zhong BY, Lau WY, Madoff DC, Davidson JC, Qi X, Cheng SQ, Teng GJ. Management of patients with hepatocellular carcinoma and portal vein tumour thrombosis: comparing east and west. Lancet Gastroenterol Hepatol. 2019; 4:721–30. https://doi.org/10.1016/S2468-1253(19)30178-5 [PubMed]
- 5. Chan SL, Chong CC, Chan AW, Poon DM, Chok KS. Management of hepatocellular carcinoma with portal vein tumor thrombosis: review and update at 2016. World J Gastroenterol. 2016; 22:7289–300. https://doi.org/10.3748/wjg.v22.i32.7289 [PubMed]
- 6. Forner A, Llovet JM, Bruix J. Hepatocellular carcinoma. Lancet. 2012; 379:1245–55. https://doi.org/10.1016/S0140-6736(11)61347-0 [PubMed]
- 7. Zhu J, Yin T, Xu Y, Lu XJ. Therapeutics for advanced hepatocellular carcinoma: recent advances, current dilemma, and future directions. J Cell Physiol. 2019; 234:12122–32. https://doi.org/10.1002/jcp.28048 [PubMed]
- 8. Sun JX, Shi J, Li N, Guo WX, Wu MC, Lau WY, Cheng SQ. Portal vein tumor thrombus is a bottleneck in the treatment of hepatocellular carcinoma. Cancer Biol Med. 2016; 13:452–58. https://doi.org/10.20892/j.issn.2095-3941.2016.0059 [PubMed]
- 9. Ye QH, Qin LX, Forgues M, He P, Kim JW, Peng AC, Simon R, Li Y, Robles AI, Chen Y, Ma ZC, Wu ZQ, Ye SL, et al. Predicting hepatitis B virus-positive metastatic hepatocellular carcinomas using gene expression profiling and supervised machine learning. Nat Med. 2003; 9:416–23. https://doi.org/10.1038/nm843 [PubMed]
- 10. Wong CM, Wong CC, Lee JM, Fan DN, Au SL, Ng IO. Sequential alterations of microRNA expression in hepatocellular carcinoma development and venous metastasis. Hepatology. 2012; 55:1453–61. https://doi.org/10.1002/hep.25512 [PubMed]
- 11. Yang Y, Chen L, Gu J, Zhang H, Yuan J, Lian Q, Lv G, Wang S, Wu Y, Yang YT, Wang D, Liu Y, Tang J, et al. Recurrently deregulated lncRNAs in hepatocellular carcinoma. Nat Commun. 2017; 8:14421. https://doi.org/10.1038/ncomms14421 [PubMed]
- 12. Liu S, Zhou Z, Jia Y, Xue J, Liu Z, Cheng K, Cheng S, Liu S. Identification of portal vein tumor thrombus with an independent clonal origin in hepatocellular carcinoma via multi-omics data analysis. Cancer Biol Med. 2019; 16:147–70. https://doi.org/10.20892/j.issn.2095-3941.2018.0184 [PubMed]
- 13. Wang D, Zhu Y, Tang J, Lian Q, Luo G, Wen W, Zhang MQ, Wang H, Chen L, Gu J. Integrative molecular analysis of metastatic hepatocellular carcinoma. BMC Med Genomics. 2019; 12:164. https://doi.org/10.1186/s12920-019-0586-4 [PubMed]
- 14. Zhang H, Ye J, Weng X, Liu F, He L, Zhou D, Liu Y. Comparative transcriptome analysis reveals that the extracellular matrix receptor interaction contributes to the venous metastases of hepatocellular carcinoma. Cancer Genet. 2015; 208:482–91. https://doi.org/10.1016/j.cancergen.2015.06.002 [PubMed]
- 15. Yang P, Li QJ, Feng Y, Zhang Y, Markowitz GJ, Ning S, Deng Y, Zhao J, Jiang S, Yuan Y, Wang HY, Cheng SQ, Xie D, Wang XF. TGF-β-miR-34a-CCL22 signaling-induced Treg cell recruitment promotes venous metastases of HBV-positive hepatocellular carcinoma. Cancer Cell. 2012; 22:291–303. https://doi.org/10.1016/j.ccr.2012.07.023 [PubMed]
- 16. Fan X, Li Y, Yi X, Chen G, Jin S, Dai Y, Cui B, Dai B, Lin H, Zhou D. Epigenome-wide DNA methylation profiling of portal vein tumor thrombosis (PVTT) tissues in hepatocellular carcinoma patients. Neoplasia. 2020; 22:630–43. https://doi.org/10.1016/j.neo.2020.09.007 [PubMed]
- 17. Zhang J, Pan YF, Ding ZW, Yang GZ, Tan YX, Yang C, Jiang TY, Liu LJ, Zhang B, Han T, Cao D, Yang T, Yang N, et al. RMP promotes venous metastases of hepatocellular carcinoma through promoting IL-6 transcription. Oncogene. 2015; 34:1575–83. https://doi.org/10.1038/onc.2014.84 [PubMed]
- 18. Brodt P. Role of the microenvironment in liver metastasis: from pre- to prometastatic niches. Clin Cancer Res. 2016; 22:5971–82. https://doi.org/10.1158/1078-0432.CCR-16-0460 [PubMed]
- 19. Tang Y, Yu H, Zhang L, Wang K, Guo W, Shi J, Liu S, Wu M, Wang H, Cheng S. Experimental study on enhancement of the metastatic potential of portal vein tumor thrombus-originated hepatocellular carcinoma cells using portal vein serum. Chin J Cancer Res. 2014; 26:588–95. https://doi.org/10.3978/j.issn.1000-9604.2014.10.07 [PubMed]
- 20. Liang CM, Chen L, Hu H, Ma HY, Gao LL, Qin J, Zhong CP. Chemokines and their receptors play important roles in the development of hepatocellular carcinoma. World J Hepatol. 2015; 7:1390–402. https://doi.org/10.4254/wjh.v7.i10.1390 [PubMed]
- 21. Aran D, Sirota M, Butte AJ. Systematic pan-cancer analysis of tumour purity. Nat Commun. 2015; 6:8971. https://doi.org/10.1038/ncomms9971 [PubMed]
- 22. Wei X, Li N, Li S, Shi J, Guo W, Zheng Y, Cheng S. Hepatitis B virus infection and active replication promote the formation of vascular invasion in hepatocellular carcinoma. BMC Cancer. 2017; 17:304. https://doi.org/10.1186/s12885-017-3293-6 [PubMed]
- 23. Chen J, Shi X, Luo T, Zhao Y, Ye J, Bai T, Li L. The correlations between hepatitis B virus infection and hepatocellular carcinoma with portal vein tumor thrombus or extrahepatic metastasis. Eur J Gastroenterol Hepatol. 2020; 32:373–77. https://doi.org/10.1097/MEG.0000000000001514 [PubMed]
- 24. Horváth Z, Kovalszky I, Fullár A, Kiss K, Schaff Z, Iozzo RV, Baghy K. Decorin deficiency promotes hepatic carcinogenesis. Matrix Biol. 2014; 35:194–205. https://doi.org/10.1016/j.matbio.2013.11.004 [PubMed]
- 25. Reszegi A, Horváth Z, Fehér H, Wichmann B, Tátrai P, Kovalszky I, Baghy K. Protective role of decorin in primary hepatocellular carcinoma. Front Oncol. 2020; 10:645. https://doi.org/10.3389/fonc.2020.00645 [PubMed]
- 26. Jiao X, Shu G, Liu H, Zhang Q, Ma Z, Ren C, Guo H, Shi J, Liu J, Zhang C, Wang Y, Gao Y. The diagnostic value of chemokine/chemokine receptor pairs in hepatocellular carcinoma and colorectal liver metastasis. J Histochem Cytochem. 2019; 67:299–308. https://doi.org/10.1369/0022155418824274 [PubMed]
- 27. Kim H, Yu SJ, Yeo I, Cho YY, Lee DH, Cho Y, Cho EJ, Lee JH, Kim YJ, Lee S, Jun J, Park T, Yoon JH, Kim Y. Prediction of response to sorafenib in hepatocellular carcinoma: a putative marker panel by multiple reaction monitoring-mass spectrometry (MRM-MS). Mol Cell Proteomics. 2017; 16:1312–23. https://doi.org/10.1074/mcp.M116.066704 [PubMed]
- 28. Liu Y, Chang Q, Wu X, Yu Y, Zhang H. Effect of chemokine CXCL14 on in vitro angiogenesis of human hepatocellular carcinoma cells. Arch Physiol Biochem. 2020; 1:1–7. https://doi.org/10.1080/13813455.2020.1769677 [PubMed]
- 29. Wang W, Huang P, Zhang L, Wei J, Xie Q, Sun Q, Zhou X, Xie H, Zhou L, Zheng S. Antitumor efficacy of C-X-C motif chemokine ligand 14 in hepatocellular carcinoma in vitro and in vivo. Cancer Sci. 2013; 104:1523–31. https://doi.org/10.1111/cas.12279 [PubMed]
- 30. Westrich JA, Vermeer DW, Colbert PL, Spanos WC, Pyeon D. The multifarious roles of the chemokine CXCL14 in cancer progression and immune responses. Mol Carcinog. 2020; 59:794–806. https://doi.org/10.1002/mc.23188 [PubMed]
- 31. Shen S, Peng H, Wang Y, Xu M, Lin M, Xie X, Peng B, Kuang M. Screening for immune-potentiating antigens from hepatocellular carcinoma patients after radiofrequency ablation by serum proteomic analysis. BMC Cancer. 2018; 18:117. https://doi.org/10.1186/s12885-018-4011-8 [PubMed]
- 32. Jhunjhunwala S, Jiang Z, Stawiski EW, Gnad F, Liu J, Mayba O, Du P, Diao J, Johnson S, Wong KF, Gao Z, Li Y, Wu TD, et al. Diverse modes of genomic alteration in hepatocellular carcinoma. Genome Biol. 2014; 15:436. https://doi.org/10.1186/s13059-014-0436-9 [PubMed]
- 33. Lv X, Zhao F, Huo X, Tang W, Hu B, Gong X, Yang J, Shen Q, Qin W. Neuropeptide Y1 receptor inhibits cell growth through inactivating mitogen-activated protein kinase signal pathway in human hepatocellular carcinoma. Med Oncol. 2016; 33:70. https://doi.org/10.1007/s12032-016-0785-1 [PubMed]
- 34. Han X, He J, Wang Z, Bai Z, Wang W, Li X. Monooxygenase DBH like 1 (MOXD1) knockdown suppresses the proliferation and xenograft tumor growth of osteosarcoma cells via inducing apoptosis. Panminerva Med. 2019. [Epub ahead of print]. https://doi.org/10.23736/S0031-0808.19.03717-0 [PubMed]
- 35. Posey KL, Coustry F, Hecht JT. Cartilage oligomeric matrix protein: COMPopathies and beyond. Matrix Biol. 2018; 71-72:161–73. https://doi.org/10.1016/j.matbio.2018.02.023 [PubMed]
- 36. Li Q, Wang C, Wang Y, Sun L, Liu Z, Wang L, Song T, Yao Y, Liu Q, Tu K. HSCs-derived COMP drives hepatocellular carcinoma progression by activating MEK/ERK and PI3K/AKT signaling pathways. J Exp Clin Cancer Res. 2018; 37:231. https://doi.org/10.1186/s13046-018-0908-y [PubMed]
- 37. Lee HS, Park MH, Yang SJ, Park KC, Kim NS, Kim YS, Kim DI, Yoo HS, Choi EJ, Yeom YI. Novel candidate targets of Wnt/beta-catenin signaling in hepatoma cells. Life Sci. 2007; 80:690–98. https://doi.org/10.1016/j.lfs.2006.10.024 [PubMed]
- 38. Lee HS, Lee DC, Park MH, Yang SJ, Lee JJ, Kim DM, Jang Y, Lee JH, Choi JY, Kang YK, Kim DI, Park KC, Kim SY, et al. STMN2 is a novel target of beta-catenin/TCF-mediated transcription in human hepatoma cells. Biochem Biophys Res Commun. 2006; 345:1059–67. https://doi.org/10.1016/j.bbrc.2006.05.017 [PubMed]
- 39. Zhang H, Hao C, Wang H, Shang H, Li Z. Carboxypeptidase A4 promotes proliferation and stem cell characteristics of hepatocellular carcinoma. Int J Exp Pathol. 2019; 100:133–38. https://doi.org/10.1111/iep.12315 [PubMed]
- 40. Sun L, Guo C, Burnett J, Pan J, Yang Z, Ran Y, Sun D. Association between expression of Carboxypeptidase 4 and stem cell markers and their clinical significance in liver cancer development. J Cancer. 2017; 8:111–16. https://doi.org/10.7150/jca.17060 [PubMed]
- 41. Xie Q, Chen L, Shan X, Shan X, Tang J, Zhou F, Chen Q, Quan H, Nie D, Zhang W, Huang AL, Tang N. Epigenetic silencing of SFRP1 and SFRP5 by hepatitis B virus X protein enhances hepatoma cell tumorigenicity through Wnt signaling pathway. Int J Cancer. 2014; 135:635–46. https://doi.org/10.1002/ijc.28697 [PubMed]
- 42. Yu J, Xie Y, Li M, Zhou F, Zhong Z, Liu Y, Wang F, Qi J. Association between SFRP promoter hypermethylation and different types of cancer: A systematic review and meta-analysis. Oncol Lett. 2019; 18:3481–92. https://doi.org/10.3892/ol.2019.10709 [PubMed]
- 43. Osada T, Clay T, Hobeika A, Lyerly HK, Morse MA. NK cell activation by dendritic cell vaccine: a mechanism of action for clinical activity. Cancer Immunol Immunother. 2006; 55:1122–31. https://doi.org/10.1007/s00262-005-0089-3 [PubMed]
- 44. Garnelo M, Tan A, Her Z, Yeong J, Lim CJ, Chen J, Lim KH, Weber A, Chow P, Chung A, Ooi LL, Toh HC, Heikenwalder M, et al. Interaction between tumour-infiltrating B cells and T cells controls the progression of hepatocellular carcinoma. Gut. 2017; 66:342–51. https://doi.org/10.1136/gutjnl-2015-310814 [PubMed]
- 45. Endig J, Buitrago-Molina LE, Marhenke S, Reisinger F, Saborowski A, Schütt J, Limbourg F, Könecke C, Schreder A, Michael A, Misslitz AC, Healy ME, Geffers R, et al. Dual role of the adaptive immune system in liver injury and hepatocellular carcinoma development. Cancer Cell. 2016; 30:308–23. https://doi.org/10.1016/j.ccell.2016.06.009 [PubMed]
- 46. Lee JH, Lee JH, Lim YS, Yeon JE, Song TJ, Yu SJ, Gwak GY, Kim KM, Kim YJ, Lee JW, Yoon JH. Adjuvant immunotherapy with autologous cytokine-induced killer cells for hepatocellular carcinoma. Gastroenterology. 2015; 148:1383–91.e6. https://doi.org/10.1053/j.gastro.2015.02.055 [PubMed]
- 47. Yang JD, Nakamura I, Roberts LR. The tumor microenvironment in hepatocellular carcinoma: current status and therapeutic targets. Semin Cancer Biol. 2011; 21:35–43. https://doi.org/10.1016/j.semcancer.2010.10.007 [PubMed]
- 48. Gilkes DM, Semenza GL, Wirtz D. Hypoxia and the extracellular matrix: drivers of tumour metastasis. Nat Rev Cancer. 2014; 14:430–39. https://doi.org/10.1038/nrc3726 [PubMed]
- 49. Bonnans C, Chou J, Werb Z. Remodelling the extracellular matrix in development and disease. Nat Rev Mol Cell Biol. 2014; 15:786–801. https://doi.org/10.1038/nrm3904 [PubMed]
- 50. Paolillo M, Schinelli S. Extracellular matrix alterations in metastatic processes. Int J Mol Sci. 2019; 20:4947. https://doi.org/10.3390/ijms20194947 [PubMed]
- 51. Jürgensen HJ, van Putten S, Nørregaard KS, Bugge TH, Engelholm LH, Behrendt N, Madsen DH. Cellular uptake of collagens and implications for immune cell regulation in disease. Cell Mol Life Sci. 2020; 77:3161–76. https://doi.org/10.1007/s00018-020-03481-3 [PubMed]
- 52. Hamidi H, Ivaska J. Every step of the way: integrins in cancer progression and metastasis. Nat Rev Cancer. 2018; 18:533–48. https://doi.org/10.1038/s41568-018-0038-z [PubMed]
- 53. Filliol A, Schwabe RF. Contributions of fibroblasts, extracellular matrix, stiffness, and mechanosensing to hepatocarcinogenesis. Semin Liver Dis. 2019; 39:315–33. https://doi.org/10.1055/s-0039-1685539 [PubMed]
- 54. Ritchie ME, Phipson B, Wu D, Hu Y, Law CW, Shi W, Smyth GK. limma powers differential expression analyses for RNA-sequencing and microarray studies. Nucleic Acids Res. 2015; 43:e47. https://doi.org/10.1093/nar/gkv007 [PubMed]
- 55. Tang Z, Li C, Kang B, Gao G, Li C, Zhang Z. GEPIA: a web server for cancer and normal gene expression profiling and interactive analyses. Nucleic Acids Res. 2017; 45:W98–102. https://doi.org/10.1093/nar/gkx247 [PubMed]
- 56. Chandrashekar DS, Bashel B, Balasubramanya SA, Creighton CJ, Ponce-Rodriguez I, Chakravarthi BV, Varambally S. UALCAN: a portal for facilitating tumor subgroup gene expression and survival analyses. Neoplasia. 2017; 19:649–58. https://doi.org/10.1016/j.neo.2017.05.002 [PubMed]
- 57. Györffy B, Lanczky A, Eklund AC, Denkert C, Budczies J, Li Q, Szallasi Z. An online survival analysis tool to rapidly assess the effect of 22,277 genes on breast cancer prognosis using microarray data of 1,809 patients. Breast Cancer Res Treat. 2010; 123:725–31. https://doi.org/10.1007/s10549-009-0674-9 [PubMed]
- 58. An Y, Wang Q, Zhang G, Sun F, Zhang L, Li H, Li Y, Peng Y, Zhu W, Ji S, Guo X. OSlihc: an online prognostic biomarker analysis tool for hepatocellular carcinoma. Front Pharmacol. 2020; 11:875. https://doi.org/10.3389/fphar.2020.00875 [PubMed]
- 59. Cerami E, Gao J, Dogrusoz U, Gross BE, Sumer SO, Aksoy BA, Jacobsen A, Byrne CJ, Heuer ML, Larsson E, Antipin Y, Reva B, Goldberg AP, et al. The cBio cancer genomics portal: an open platform for exploring multidimensional cancer genomics data. Cancer Discov. 2012; 2:401–04. https://doi.org/10.1158/2159-8290.CD-12-0095 [PubMed]
- 60. Gao J, Aksoy BA, Dogrusoz U, Dresdner G, Gross B, Sumer SO, Sun Y, Jacobsen A, Sinha R, Larsson E, Cerami E, Sander C, Schultz N. Integrative analysis of complex cancer genomics and clinical profiles using the cBioPortal. Sci Signal. 2013; 6:pl1. https://doi.org/10.1126/scisignal.2004088 [PubMed]
- 61. Ding W, Chen J, Feng G, Chen G, Wu J, Guo Y, Ni X, Shi T. DNMIVD: DNA methylation interactive visualization database. Nucleic Acids Res. 2020; 48:D856–62. https://doi.org/10.1093/nar/gkz830 [PubMed]
- 62. Zhang C, Zhao N, Zhang X, Xiao J, Li J, Lv D, Zhou W, Li Y, Xu J, Li X. SurvivalMeth: a web server to investigate the effect of DNA methylation-related functional elements on prognosis. Brief Bioinform. 2020. [Epub ahead of print]. https://doi.org/10.1093/bib/bbaa162 [PubMed]
- 63. Modhukur V, Iljasenko T, Metsalu T, Lokk K, Laisk-Podar T, Vilo J. MethSurv: a web tool to perform multivariable survival analysis using DNA methylation data. Epigenomics. 2018; 10:277–88. https://doi.org/10.2217/epi-2017-0118 [PubMed]
- 64. Li T, Fan J, Wang B, Traugh N, Chen Q, Liu JS, Li B, Liu XS. TIMER: a web server for comprehensive analysis of tumor-infiltrating immune cells. Cancer Res. 2017; 77:e108–10. https://doi.org/10.1158/0008-5472.CAN-17-0307 [PubMed]
- 65. Franz M, Rodriguez H, Lopes C, Zuberi K, Montojo J, Bader GD, Morris Q. GeneMANIA update 2018. Nucleic Acids Res. 2018; 46:W60–64. https://doi.org/10.1093/nar/gky311 [PubMed]
- 66. Huang W, Sherman BT, Lempicki RA. Systematic and integrative analysis of large gene lists using DAVID bioinformatics resources. Nat Protoc. 2009; 4:44–57. https://doi.org/10.1038/nprot.2008.211 [PubMed]
- 67. Pan JH, Zhou H, Cooper L, Huang JL, Zhu SB, Zhao XX, Ding H, Pan YL, Rong L. LAYN is a prognostic biomarker and correlated with immune infiltrates in gastric and colon cancers. Front Immunol. 2019; 10:6. https://doi.org/10.3389/fimmu.2019.00006 [PubMed]
- 68. Xiao Z, Hu L, Yang L, Wang S, Gao Y, Zhu Q, Yang G, Huang D, Xu Q. TGFβ2 is a prognostic-related biomarker and correlated with immune infiltrates in gastric cancer. J Cell Mol Med. 2020; 24:7151–62. https://doi.org/10.1111/jcmm.15164 [PubMed]