


Introduction
High blood pressure (BP) contributes to atherosclerosis and increases the risk of cardiovascular disease (CVD). In 2017, the American College of Cardiology and the American Heart Association (ACC/AHA) redefined hypertension as BP levels ≥130/80 mmHg and BP levels 130~139/80~89 mmHg which were regarded as ‘high-normal’ previously, were classified as stage 1 hypertension [1]. However, this definition was not embraced by other guidelines, such as the 2018 European Society of Cardiology/European Society of Hypertension (ESC/ESH) guidelines and the 2020 International Society of Hypertension (ISH) Global Hypertension Practice Guidelines [2–4]. Therefore, whether BP levels 130~139/80~89 mmHg should be defined as hypertension warrants investigation. Subsequent studies have reported significant associations between ACC/AHA stage 1 hypertension and risks of CVD events in long-term population-based cohorts [5–7], providing strong evidence and justification for the definition of ACC/AHA stage 1 hypertension in these populations for an early intervention.
Pulse wave velocity (PWV) was proposed as a method to assess arterial stiffness in 2003 [8] and has been widely accepted in cardiovascular studies [9]. Arterial stiffness defined by an increased PWV was considered a prelude to clinical atherosclerosis and was related to higher CVD risks. An individual participant meta-analysis revealed that PWV could predict future CVD events independent of conventional risk factors [10]. Brachial-ankle PWV (ba-PWV) is measured by brachial and tibial arterial wave analyses and previous studies have demonstrated significantly higher risks of CVD occurrence in association with increased ba-PWV levels independent of traditional cardiovascular risk factors in different populations [11–14]. Therefore, early detection and prevention of arterial stiffness are of great importance.
Previous studies have shown significant associations between BP levels and arterial stiffness. For instance, subjects with a high level of ba-PWV had higher risks of hypertension [15], and subjects with a high BP level were more likely to have increased ba-PWV [16]. However, most studies were cross-sectional. Associations of stage 1 hypertension defined by the 2017 ACC/AHA guidelines with the development of arterial stiffness were rarely reported. Therefore, using data from a well-defined population cohort of community residents in China, we aimed to examine the associations between ACC/AHA stage 1 hypertension and incident arterial stiffness defined by an increased ba-PWV.
Results
General characteristics of study participants are described in Table 1. Among 4595 participants, 699 (15.2%) had normal BP, 528 (11.5%) had elevated BP, 1099 (23.9%) had stage 1 hypertension, and 2269 (49.4%) had stage 2 hypertension including 1,008 participants using anti-hypertensive medications. Compared with participants in the normal BP category, participants in the higher BP categories were older and more likely to be men, had higher levels of body mass index (BMI), fasting plasma glucose (FPG), triglycerides, total cholesterol, low-density lipoprotein (LDL) cholesterol, and urinary albumin-to-creatine ratio (ACR), and had lower levels of education, high-density lipoprotein (HDL) cholesterol, and estimated glomerular filtration rate (eGFR) (all P for trend <0.001). In addition, baseline ba-PWV levels increased significantly across BP categories (P for trend <0.001).
Table 1. Baseline characteristics according to blood pressure categories.
| Characteristics | Total n=4595 | Blood pressure categories | P for trend | ||||||||||||||||||||||||||||||||||||||||||||||||||||||||||||||||||||||||||||||||||||||||||||||||
| Normal BP n=699 | Elevated BP n=528 | Stage 1 hypertension n=1099 | Stage 2 hypertension n=2269 | ||||||||||||||||||||||||||||||||||||||||||||||||||||||||||||||||||||||||||||||||||||||||||||||||
| Systolic blood pressure (mmHg) | 136.0 ± 17.0 | 112.1 ± 5.6 | 124.6 ± 2.9 ** | 130.8 ± 6.4 ** | 148.6 ± 13.4 ** | <0.001 | |||||||||||||||||||||||||||||||||||||||||||||||||||||||||||||||||||||||||||||||||||||||||||||
| Diastolic blood pressure (mmHg) | 82.0 ± 9.8 | 70.8 ± 5.2 | 73.6 ± 4.8 ** | 81.4 ± 5.3 ** | 87.6 ± 8.9 ** | <0.001 | |||||||||||||||||||||||||||||||||||||||||||||||||||||||||||||||||||||||||||||||||||||||||||||
| Age (years) | 55.8 ± 7.7 | 53.0 ± 7.2 | 56.2 ± 7.8 ** | 54.4 ± 7.4 ** | 57.2 ± 7.6 ** | <0.001 | |||||||||||||||||||||||||||||||||||||||||||||||||||||||||||||||||||||||||||||||||||||||||||||
| Men, n (%) | 1684 (36.65) | 196 (28.04) | 167 (31.63) | 425 (38.67) ** | 896 (39.49) ** | <0.001 | |||||||||||||||||||||||||||||||||||||||||||||||||||||||||||||||||||||||||||||||||||||||||||||
| Education ≥9 years, n (%) | 3256 (71.17) | 556 (79.77) | 372 (70.59) ** | 805 (73.45) ** | 1523 (67.54) ** | <0.001 | |||||||||||||||||||||||||||||||||||||||||||||||||||||||||||||||||||||||||||||||||||||||||||||
| Current smoking, n (%) | 972 (21.92) | 137 (20.24) | 107 (21.19) | 275 (25.89) ** | 453 (20.68) | 0.980 | |||||||||||||||||||||||||||||||||||||||||||||||||||||||||||||||||||||||||||||||||||||||||||||
| Current drinking, n (%) | 464 (10.44) | 52 (7.64) | 35 (6.97) | 127 (11.94) ** | 250 (11.38) ** | 0.001 | |||||||||||||||||||||||||||||||||||||||||||||||||||||||||||||||||||||||||||||||||||||||||||||
| Physical activity ≥600 METs-min/week, n (%) | 3305 (71.93) | 511 (73.10) | 383 (72.54) | 780 (70.97) | 1631 (71.88) | 0.537 | |||||||||||||||||||||||||||||||||||||||||||||||||||||||||||||||||||||||||||||||||||||||||||||
| Body mass index (kg/m2) | 25.0 ± 3.2 | 23.2 ± 2.7 | 24.2 ± 2.7 ** | 24.7 ± 2.9 ** | 26.0 ±3.3 ** | <0.001 | |||||||||||||||||||||||||||||||||||||||||||||||||||||||||||||||||||||||||||||||||||||||||||||
| Fasting plasma glucose (mg/dL) | 92.07 (85.23-101.08) | 87.93 (81.98-94.23) | 90.45 (84.32-97.48) ** | 91.89 (85.05-100.18) ** | 94.23 (87.03-104.32) ** | <0.001 | |||||||||||||||||||||||||||||||||||||||||||||||||||||||||||||||||||||||||||||||||||||||||||||
| Triglycerides (mg/dL) | 100.00 (71.42-140.60) | 81.20 (60.90-113.53) | 87.07 (63.91-127.44) ** | 99.25 (72.93-139.10) ** | 109.02 (78.20-154.14) ** | <0.001 | |||||||||||||||||||||||||||||||||||||||||||||||||||||||||||||||||||||||||||||||||||||||||||||
| Low-density lipoprotein cholesterol (mg/dL) | 122.52 ± 32.27 | 120.73 ± 31.10 | 120.73 ± 31.10 | 121.73 ± 33.02 ** | 124.95 ± 32.08 ** | <0.001 | |||||||||||||||||||||||||||||||||||||||||||||||||||||||||||||||||||||||||||||||||||||||||||||
| High-density lipoprotein cholesterol (mg/dL) | 51.44 ± 12.38 | 53.46 ± 12.31 | 52.65 ± 12.79 | 52.07 ± 13.05 * | 50.23 ± 11.84 ** | <0.001 | |||||||||||||||||||||||||||||||||||||||||||||||||||||||||||||||||||||||||||||||||||||||||||||
| Total cholesterol (mg/dL) | 204.99 ± 37.08 | 197.59 ± 36.03 | 201.85 ± 36.20 * | 205.40 ± 37.66 ** | 207.80 ± 36.98 ** | <0.001 | |||||||||||||||||||||||||||||||||||||||||||||||||||||||||||||||||||||||||||||||||||||||||||||
| eGFR (mL/min/1.73m2) | 101.75 (95.68-107.29) | 104.07 (97.97-109.30) | 101.99 (95.95-107.41) ** | 103.19 (96.79-108.30) ** | 100.22 (94.48-105.98) ** | <0.001 | |||||||||||||||||||||||||||||||||||||||||||||||||||||||||||||||||||||||||||||||||||||||||||||
| Urinary albumin-to-creatine ratio (mg/g) | 4.52 (2.64-8.05) | 3.90 (2.59-6.45) | 4.10 (2.36-6.63) | 4.44 (2.62-7.67) ** | 4.91 (2.75-9.26) ** | <0.001 | |||||||||||||||||||||||||||||||||||||||||||||||||||||||||||||||||||||||||||||||||||||||||||||
| Ba-PWV (cm/s) | 1446 (1310-1593) | 1273 (1175-1375) | 1365 (1259-1503) ** | 1409 (1298-1545) ** | 1536 (1408-1649) ** | <0.001 | |||||||||||||||||||||||||||||||||||||||||||||||||||||||||||||||||||||||||||||||||||||||||||||
| Continuous variables are presented as means ± standard deviation or medians (interquartile ranges). Categorical variables are presented as n (%). * P <0.05; ** P <0.01 vs. normal BP group. | |||||||||||||||||||||||||||||||||||||||||||||||||||||||||||||||||||||||||||||||||||||||||||||||||||
| METs-min/week, metabolic equivalents-minute per week; eGFR, estimated glomerular filtration rate; Ba-PWV, brachial-ankle pulse wave velocity. | |||||||||||||||||||||||||||||||||||||||||||||||||||||||||||||||||||||||||||||||||||||||||||||||||||
After a median of 4.3 years’ follow-up, 724 participants developed an increased ba-PWV (Figure 1), which was defined as a normal ba-PWV at baseline (≤1793 cm/s, i.e. the 75th percentile of baseline ba-PWV) and an increased ba-PWV at follow-up (>1793 cm/s). Proportions of participants developing arterial stiffness were 4.15%, 9.47%, 11.19%, and 23.01% in groups of normal BP, elevated BP, stage 1 hypertension, and stage 2 hypertension, respectively. Significant differences were found for the development of arterial stiffness between participants with stage 1 hypertension and participants with normal BP, or between participants with systolic BP 130~139 mmHg and participants with systolic BP <120 mmHg (both P <0.001). However, no difference was found between participants with diastolic BP 80~89 mmHg and participants with diastolic BP <80 mmHg (P = 0.189).
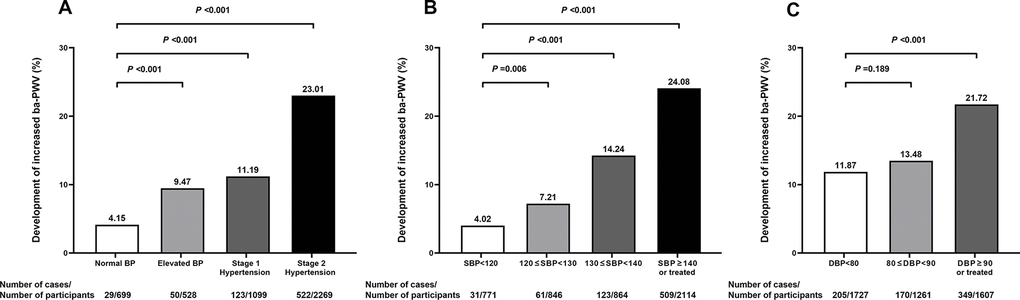
Figure 1. Proportions (%) of participants developing an increased ba-PWV in different blood pressure categories. 2017 ACC/AHA blood pressure categories (A); systolic blood pressure categories (B); diastolic blood pressure categories (C). SBP, systolic blood pressure; DBP, diastolic blood pressure; Ba-PWV, brachial-ankle pulse wave velocity.
Risks of developing arterial stiffness in association with BP categories are shown in Table 2. Compared with participants with normal BP, participants with stage 1 hypertension had a 1.48-fold increased risk of developing arterial stiffness [odds ratio (OR) =2.48; 95% confidence interval (CI) =1.59-3.85, P <0.001] after adjustment for age, sex, education, current smoking, current drinking, physical activity, BMI, FPG, triglycerides, LDL cholesterol, HDL cholesterol, eGFR, and urinary ACR. Similar and significant associations between stage 1 hypertension and risks of developing arterial stiffness were found in men and women, in participants with or without dysglycemia after full adjustment (both P for interaction >0.1). However, a significant interaction was observed for age (P for interaction =0.039). In participants aged <60 years, stage 1 hypertension was associated with a 3.08-fold increased risk of developing arterial stiffness (OR =4.08; 95% CI =2.06-8.08, P <0.001) whereas in participants aged ≥60 years, no significant association was found.
Table 2. Risks of developing an increased ba-PWV in association with blood pressure categories in the overall study population and in subgroups of sex, age, and dysglycemia.
| Blood pressure categories | Odds ratio (95% confidence interval) | ||||||||||||||||||||||||||||||||||||||||||||||||||||||||||||||||||||||||||||||||||||||||||||||||||
| Total | Sex † | Age † | Dysglycemia † | ||||||||||||||||||||||||||||||||||||||||||||||||||||||||||||||||||||||||||||||||||||||||||||||||
| Model 1 | Model 2 | Model 3 | Men | Women | <60 years | ≥60 years | Without | With | |||||||||||||||||||||||||||||||||||||||||||||||||||||||||||||||||||||||||||||||||||||||||||
| Normal BP | 1.00 | 1.00 | 1.00 | 1.00 | 1.00 | 1.00 | 1.00 | 1.00 | 1.00 | ||||||||||||||||||||||||||||||||||||||||||||||||||||||||||||||||||||||||||||||||||||||||||
| Elevated BP | 1.73 (1.06-2.82) | 1.65 (1.00-2.73) | 1.59 (0.96-2.63) | 1.20 (0.53-2.72) | 1.90 (0.99-3.65) | 2.94 (1.34-6.43) | 1.07 (0.55-2.08) | 1.80 (0.95-3.42) | 1.26 (0.55-2.91) | ||||||||||||||||||||||||||||||||||||||||||||||||||||||||||||||||||||||||||||||||||||||||||
| Stage 1 hypertension | 2.68 (1.75-4.11) | 2.70 (1.75-4.19) | 2.48 (1.59-3.85) | 2.14 (1.09-4.24) | 2.74 (1.52-4.93) | 4.08 (2.06-8.08) | 1.47 (0.81-2.67) | 2.14 (1.20-3.82) | 2.64 (1.29-5.41) | ||||||||||||||||||||||||||||||||||||||||||||||||||||||||||||||||||||||||||||||||||||||||||
| Stage 2 hypertension | 5.05 (3.40-7.51) | 5.10 (3.38-7.68) | 4.54 (3.00-6.87) | 3.64 (1.92-6.90) | 5.34 (3.08-9.24) | 8.04 (4.17-15.52) | 3.01 (1.75-5.20) | 5.14 (3.03-8.71) | 3.90 (1.97-7.71) | ||||||||||||||||||||||||||||||||||||||||||||||||||||||||||||||||||||||||||||||||||||||||||
| P for trend | <0.001 | <0.001 | <0.001 | <0.001 | <0.001 | <0.001 | <0.001 | <0.001 | <0.001 | ||||||||||||||||||||||||||||||||||||||||||||||||||||||||||||||||||||||||||||||||||||||||||
| P for interaction | 0.260 | 0.039 | 0.609 | ||||||||||||||||||||||||||||||||||||||||||||||||||||||||||||||||||||||||||||||||||||||||||||||||
| Model 1: adjusted for age, sex. | |||||||||||||||||||||||||||||||||||||||||||||||||||||||||||||||||||||||||||||||||||||||||||||||||||
| Model 2: further adjusted for education, current smoking, current drinking, physical activity, and body-mass index. | |||||||||||||||||||||||||||||||||||||||||||||||||||||||||||||||||||||||||||||||||||||||||||||||||||
| Model 3: further adjusted for fasting plasma glucose, triglycerides, low-density lipoprotein cholesterol, high-density lipoprotein cholesterol, estimated glomerular filtration rate, urinary albumin-to-creatine ratio. | |||||||||||||||||||||||||||||||||||||||||||||||||||||||||||||||||||||||||||||||||||||||||||||||||||
| † Using model 3 except the stratified variable. | |||||||||||||||||||||||||||||||||||||||||||||||||||||||||||||||||||||||||||||||||||||||||||||||||||
| Ba-PWV, brachial-ankle pulse wave velocity. | |||||||||||||||||||||||||||||||||||||||||||||||||||||||||||||||||||||||||||||||||||||||||||||||||||
Risks of developing arterial stiffness in association with systolic and diastolic BP categories separately are shown in Table 3. Compared with participants with a systolic BP <120 mmHg, participants with a systolic BP 130~139 mmHg had a 2.03-fold increased risk of developing arterial stiffness (OR =3.03; 95% CI =1.97-4.67, P <0.001) after adjustment for confounding factors. Further adjustment for diastolic BP did not alter the association (OR =2.90; 95% CI =1.86-4.52, P <0.001). Compared with participants with a diastolic BP <80 mmHg, participants with a diastolic BP 80~89 mmHg had a 50% increased risk of developing arterial stiffness (OR =1.50; 95% CI =1.18-1.91, P <0.001) after adjustment for confounding factors. However, further adjustment for systolic BP attenuated the association to the null (OR =1.09; 95% CI =0.85-1.41, P =0.492).
Table 3. Risks of developing an increased ba-PWV in association with systolic blood pressure or diastolic blood pressure categories separately.
| Blood pressure categories | Odds ratio (95% confidence interval) | ||||||||||||||||||||||||||||||||||||||||||||||||||||||||||||||||||||||||||||||||||||||||||||||||||
| Model 1 | Model 2 | Model 3 | Model 4 | ||||||||||||||||||||||||||||||||||||||||||||||||||||||||||||||||||||||||||||||||||||||||||||||||
| SBP (mmHg) | |||||||||||||||||||||||||||||||||||||||||||||||||||||||||||||||||||||||||||||||||||||||||||||||||||
| <120 | 1.00 | 1.00 | 1.00 | 1.00 | |||||||||||||||||||||||||||||||||||||||||||||||||||||||||||||||||||||||||||||||||||||||||||||||
| 120~129 | 1.57 (0.99-2.47) | 1.52 (0.95-2.43) | 1.44 (0.90-2.30) | 1.41 (0.88-2.26) | |||||||||||||||||||||||||||||||||||||||||||||||||||||||||||||||||||||||||||||||||||||||||||||||
| 130~139 | 3.26 (2.15-4.95) | 3.28 (2.13-5.03) | 3.03 (1.97-4.67) | 2.90 (1.86-4.52) | |||||||||||||||||||||||||||||||||||||||||||||||||||||||||||||||||||||||||||||||||||||||||||||||
| ≥140 or treated | 5.25 (3.58-7.69) | 5.33 (3.58-7.92) | 4.74 (3.18-7.08) | 4.43 (2.87-6.83) | |||||||||||||||||||||||||||||||||||||||||||||||||||||||||||||||||||||||||||||||||||||||||||||||
| P for trend | <0.001 | <0.001 | <0.001 | <0.001 | |||||||||||||||||||||||||||||||||||||||||||||||||||||||||||||||||||||||||||||||||||||||||||||||
| DBP (mmHg) | |||||||||||||||||||||||||||||||||||||||||||||||||||||||||||||||||||||||||||||||||||||||||||||||||||
| <80 | 1.00 | 1.00 | 1.00 | 1.00 | |||||||||||||||||||||||||||||||||||||||||||||||||||||||||||||||||||||||||||||||||||||||||||||||
| 80~89 | 1.54 (1.22-1.95) | 1.55 (1.22-1.96) | 1.50 (1.18-1.91) | 1.09 (0.85-1.41) | |||||||||||||||||||||||||||||||||||||||||||||||||||||||||||||||||||||||||||||||||||||||||||||||
| ≥90 or treated | 2.37 (1.93-2.90) | 2.27 (1.83-2.83) | 2.12 (1.70-2.66) | 1.22 (0.94-1.58) | |||||||||||||||||||||||||||||||||||||||||||||||||||||||||||||||||||||||||||||||||||||||||||||||
| P for trend | <0.001 | <0.001 | <0.001 | 0.130 | |||||||||||||||||||||||||||||||||||||||||||||||||||||||||||||||||||||||||||||||||||||||||||||||
| Model 1: adjusted for age, sex. | |||||||||||||||||||||||||||||||||||||||||||||||||||||||||||||||||||||||||||||||||||||||||||||||||||
| Model 2: further adjusted for education, current smoking, current drinking, physical activity, and body-mass index. | |||||||||||||||||||||||||||||||||||||||||||||||||||||||||||||||||||||||||||||||||||||||||||||||||||
| Model 3: further adjusted for fasting plasma glucose, triglycerides, low-density lipoprotein cholesterol, high-density lipoprotein cholesterol, estimated glomerular filtration rate, urinary albumin-to-creatine ratio. | |||||||||||||||||||||||||||||||||||||||||||||||||||||||||||||||||||||||||||||||||||||||||||||||||||
| Model 4: further adjusted for DBP (in association with SBP categories) or SBP (in association with DBP categories). | |||||||||||||||||||||||||||||||||||||||||||||||||||||||||||||||||||||||||||||||||||||||||||||||||||
| Ba-PWV, brachial-ankle pulse wave velocity; SBP, systolic blood pressure; DBP, diastolic blood pressure. | |||||||||||||||||||||||||||||||||||||||||||||||||||||||||||||||||||||||||||||||||||||||||||||||||||
Further categorization using both baseline BP and follow-up BP and their associations with arterial stiffness are shown in Figure 2. Using participants with systolic BP <130 mmHg and diastolic BP <80 mmHg at both baseline and follow-up as the reference, participants whose BP levels were <130/<80 mmHg at baseline and 130~139/80~89 mmHg at follow-up had a 5.91-fold increased risk of arterial stiffness (OR =6.91; 95% CI =3.72-12.86, P<0.001). For participants with BP levels 130~139/80~89 mmHg at baseline, significantly increased risks of arterial stiffness were found for BP levels 130~139/80~89 mmHg or higher at follow-up.
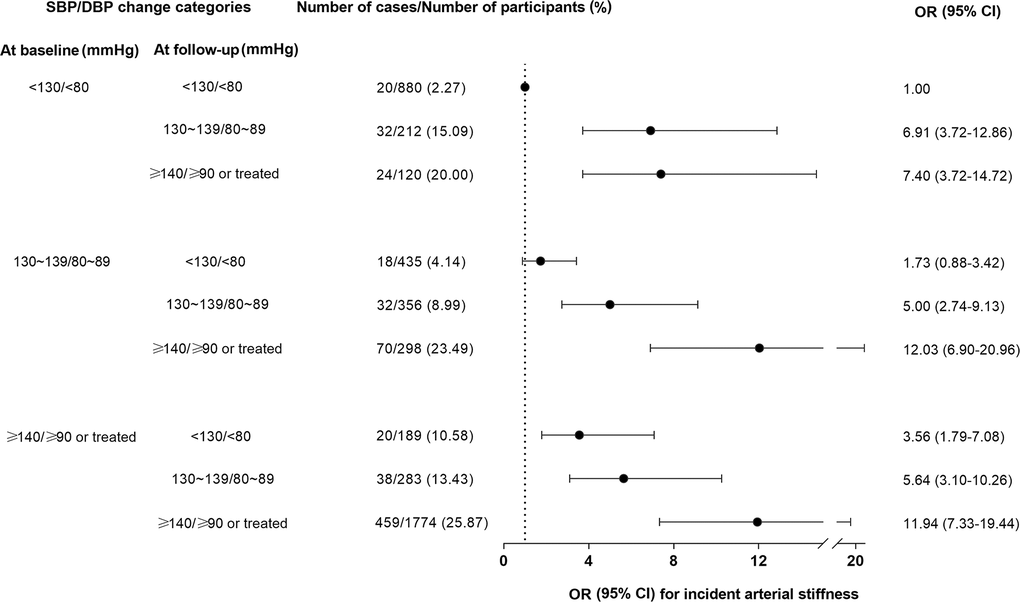
Figure 2. Risks of developing an increased ba-PWV in association with blood pressure changes during follow-up. The OR (95% CI) was adjusted for age, sex, education, current smoking, current drinking, physical activity, body-mass index, fasting plasma glucose, triglycerides, low-density lipoprotein cholesterol, high-density lipoprotein cholesterol, estimated glomerular filtration rate, and urinary albumin-to-creatine ratio. Forty-eight participants had missing data on BP measurements during follow-up and were not included in the analysis. BP, blood pressure; SBP, systolic blood pressure; DBP, diastolic blood pressure; Ba-PWV, brachial-ankle pulse wave velocity; OR, odds ratio; CI, confidence interval.
Discussion
Using data from a well-defined community cohort of Chinese adults aged ≥40 years, we found that stage 1 hypertension defined by the 2017 ACC/AHA guideline was significantly associated with a higher risk of developing arterial stiffness defined by an increased ba-PWV level compared with the normal BP category. The association was more evident in adults aged 40-59 years and was not significant in adults aged ≥60 years. In addition, a systolic BP of 130~139 mmHg might be more closely related with arterial stiffness than a diastolic BP 80~89 mmHg. Furthermore, participants with BP levels 130~139/80~89 mmHg either at baseline or at follow-up had increased risks of arterial stiffness compared with continuously normal BP.
Although there have been studies reporting significant associations between the newly defined stage 1 hypertension by the ACC/AHA and major clinical cardiovascular events in different populations [5–7, 17–20], few studies have assessed the impact of stage 1 hypertension on arterial stiffness. One cross-sectional study examined the association of the 2017 ACC/AHA BP categorization with ba-PWV levels in 772 Afro-Caribbean men aged ≥50 years [21]. They found significantly higher ba-PWV levels in men with ACC/AHA stage 1 hypertension. Findings from the current study were consistent with previous findings and extended the evidence by examining prospectively the association between stage 1 hypertension and the development of arterial stiffness in a general Chinese population. One longitudinal study examined the association of systolic BP and the rates of change in PWV in 775 US adults [16]. They found that the effect of systolic BP on PWV trajectories exists in the prehypertensive range. However, prehypertension defined in this study was according to the JNC 7 guideline (i.e. systolic BP 120~139 mmHg). The new definition of stage 1 hypertension according to the 2017 ACC/AHA guideline (systolic/diastolic BP 130~139/80~89 mmHg) is the focus of the current study. According to our findings, participants with ACC/AHA stage 1 hypertension might already have an increased risk of arterial stiffness and therefore warrant an early intervention to prevent clinical cardiovascular events.
We found a significant interaction of age with the association between stage 1 hypertension and arterial stiffness. The significant association was observed in participants aged 40-59 years whereas in participants aged ≥60 years, the significant association was only found for stage 2 hypertension. The more evident association found in middle-aged adults compared with elderly adults was also demonstrated in previous studies for stage 1 hypertension and clinical cardiovascular outcomes. One study in 15 million Koreans aged 20-94 years found that stage 1 hypertension was associated with higher risks of CVD events compared with normal BP at all adult ages and the age group of 35-49 years had the highest relative risk [5]. Another study in 21,441 Chinese aged ≥35 years found significant associations between stage 1 hypertension and CVD events in participants aged 35-59 years, which was not found in participants aged ≥60 years [6]. Findings from the current study revealed that this age-specific association also exists for stage 1 hypertension and arterial stiffness. An appropriate high level of systolic BP might be required to maintain coronary perfusion in the elderly [22], leading to a potentially age-dependent threshold for hypertension [23]. Therefore, the definition of stage 1 hypertension in the elderly needs more evidence.
When systolic and diastolic BP were examined separately, we found systolic BP levels in accordance with stage 1 hypertension (130~139 mmHg) were significantly associated with arterial stiffness independent of diastolic BP whereas diastolic BP levels in accordance with stage 1 hypertension (80~89 mmHg) were no longer associated with arterial stiffness after adjustment for systolic BP, indicating a closer relation between systolic BP and arterial stiffness. Although stronger associations for systolic BP over diastolic BP in general for clinical cardiovascular outcomes have been demonstrated previously [24–26], a comparison between systolic BP and diastolic BP in stage 1 hypertension for its association with cardiovascular risks is limited [27]. A recent study in US adults found that both systolic and diastolic hypertension influenced the risk of adverse cardiovascular events, regardless of the definition of hypertension (≥140/90 mmHg or ≥130/80 mmHg). However, no further adjustment for systolic BP or diastolic BP was made for the association [28]. The stronger association of systolic BP 130~139 mmHg with arterial stiffness found in the current study provided further evidence for targeting systolic BP as the priority if the stage 1 hypertension is to be treated.
In addition, changes in BP levels over a median of 4.3 years were also important with regard to arterial stiffness, as found in the current study. Increasing BP levels during follow-up were all associated with increasing risks of arterial stiffness when compared with non-hypertensive BP levels maintained at both baseline and follow-up. Stage 1 hypertension, whether already present at baseline or developed during follow-up, was associated with a significantly increased risk of arterial stiffness, indicating the importance of long-term BP management under the levels of 130/80 mmHg in reducing cardiovascular risks.
The current study is among the first to examine prospectively the association between stage 1 hypertension and the development of arterial stiffness. Arterial stiffness was evaluated in a large sample of community residents using ba-PWV at baseline and at follow-up after a median of 4.3 years. BP levels of stage 1 hypertension were examined comprehensively by baseline systolic BP and diastolic BP combined or separated, as well as by changes in BP levels during follow-up. However, there are also limitations. First, BP levels were measured on a single day in the morning of clinic examination, although 3 measurements were obtained for each participant. Measuring BP levels at different times of the day and at different days is important for the diagnosis of hypertension. Second, the follow-up duration was relatively short and only one follow-up visit was conducted. Therefore, changes in BP levels and the development of arterial stiffness in the current study were recorded in parallel. Third, a significant number of participants with missing data on ba-PWV at follow-up were excluded, which has the potential to introduce selection bias. Although general characteristics were largely similar between participants included and those excluded, proportions of men and current smoking were higher and levels of BMI, BP, LDL cholesterol, and total cholesterol were lower in those excluded (Supplementary Table 1). Finally, although a comprehensive cardiometabolic risk profile was adjusted in multivariable models, residual or undetected confounders could not be ruled out.
In conclusion, the 2017 ACC/AHA stage 1 hypertension was significantly associated with higher risks of arterial stiffness evaluated by ba-PWV measurements. Systolic BP of stage 1 hypertension levels was associated with arterial stiffness independent of diastolic BP and should be prioritized for BP management if stage 1 hypertension is to be treated. In addition, long-term BP control under 130/80 mmHg might have to be maintained in order to prevent arterial stiffness. Future studies and more evidence are needed to determine whether treating stage 1 hypertension can reduce the risk of clinical and subclinical cardiovascular disease.
Materials and Methods
Study population
The study was conducted among the residents living in Jiading District, Shanghai, China. The study design has been published elsewhere [29]. In 2010, 10375 registered permanent residents aged 40 years or older were recruited for a comprehensive examination of cardiometabolic health. During 2014 to 2015, participants were asked to come back for a follow-up visit. For the current analysis, we excluded 306 participants with self-reported history of CVD and 22 participants with missing data on BP measurements at baseline. We further excluded participants with missing data on ba-PWV at baseline or at follow-up and participants with already increased baseline ba-PWV levels. Eventually, 4595 participants were included for the current analysis. Details of the study population selection are presented in Figure 3.
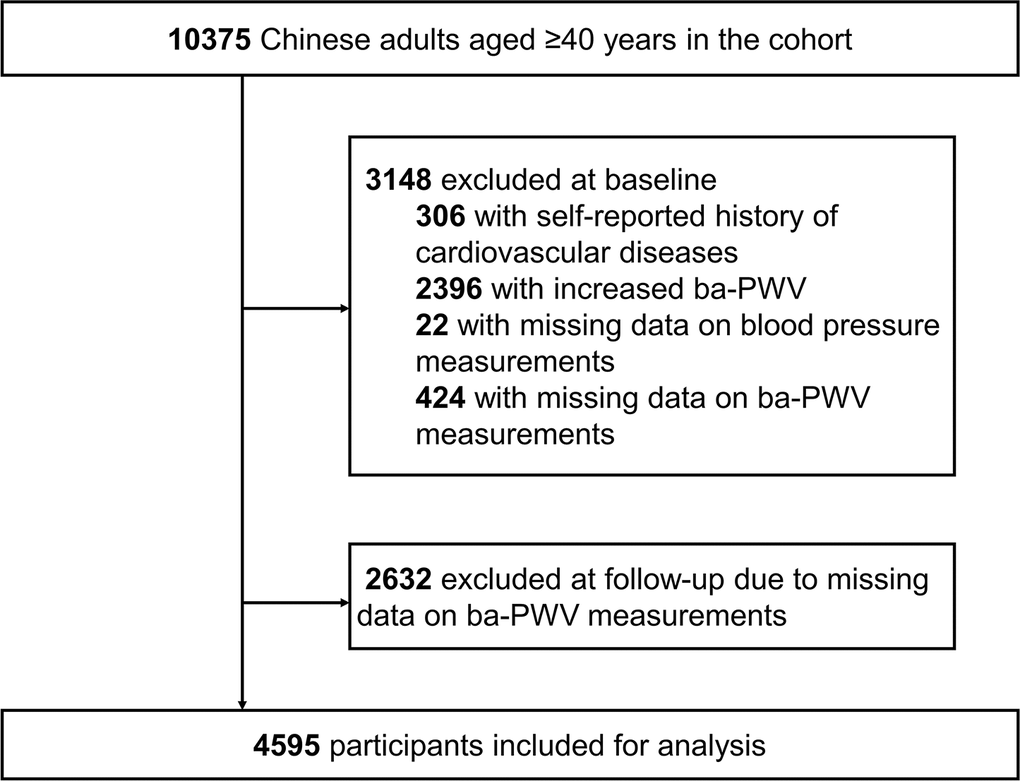
Figure 3. Flow chart of the selection of study participants. Ba-PWV, brachial-ankle pulse wave velocity.
The study protocol was approved by the Institutional Review Board at Ruijin Hospital affiliated to Shanghai Jiaotong University School of Medicine. All participants provided written informed consent.
Data collection
At the baseline examination, each participant completed a standard questionnaire including sociodemographic characteristics, medical history of chronic diseases, and lifestyle factors, etc. Current smoking or current drinking was defined as smoking or drinking regularly during the past 6 months. Physical activity was recorded using the International Physical Activity Questionnaire (IPAQ) and was dichotomized according to the recommendation of current guidelines [≥600 metabolic equivalent minutes per week (MET-min/week)] [30]. Anthropometric measurements were performed according to a standard protocol. Height and weight were measured with participants wearing light clothes and without shoes. BMI was calculated as weight in kilograms divided by height in meters squared. Three BP measurements were obtained from each participant in a seated position using a calibrated automatic electronic device (OMRON Model HEM-752 FUZZY, Omron Company, Dalian, China) in a separate examination room after at least 5-minute sitting rest. Participants were advised to avoid alcohol, coffee, tea, smoking and exercise at least 30 minutes before BP measurement. The average of three readings was used for analysis.
Fasting venous blood sample was drawn from each participant after at least a 10-hour overnight fast. An oral glucose tolerance test was performed and blood samples were re-taken 2 hours after the glucose load. Plasma glucose, serum lipids and creatinine were measured on an auto-analyser (Modular P800, Modular E170; Roche, Basel, Switzerland). eGFR was calculated using the Chronic Kidney Disease Epidemiology Collaboration (CKD-EPI) equation [31]. A first voided urine sample at early morning was collected from each participant and urinary albumin and creatinine were measured to estimate the urinary ACR in mg/g.
Ba-PWV measurement
Levels of ba-PWV were measured at the baseline and follow-up visits by a trained physician using Colin VP-1000 (Model BP203RPE II, form PWV/ABI; OMRON Colin Medical Instruments, Tokyo, Japan) [32]. After cuffs were placed on both sides of upper arms and ankles, pulse waves were obtained simultaneously. The time of delay and the distance from right and left upper arms to right and left ankles were used to calculate the right and left ba-PWV. The larger reading of the right and left ba-PWV was used for analysis. Because there is no clinical cutoff point for ba-PWV, we used the upper quartile of ba-PWV levels at baseline to define normal and increased ba-PWV, as described previously [33]. Therefore, the development of an increased arterial stiffness was defined as a normal ba-PWV (≤1793 cm/s) at baseline and an increased ba-PWV (>1793 cm/s) at follow-up.
BP categories
BP was categorized according to the 2017 ACC/AHA guideline into four groups: 1) normal, systolic BP <120 mmHg and diastolic BP <80 mmHg; 2) elevated, systolic BP 120~129 mmHg and diastolic BP <80 mmHg; 3) stage 1 hypertension, systolic BP 130~139 mmHg and/or diastolic BP 80~89 mmHg; and 4) stage 2 hypertension, systolic BP ≥140 mmHg and/or diastolic BP ≥90 mmHg and/or using anti-hypertensive medications [1]. Furthermore, systolic BP and diastolic BP were categorized separately into systolic BP <120, 120~129, 130~139, and ≥140 mmHg or diastolic BP <80, 80~89, and ≥90 mmHg. Participants using anti-hypertensive medications were categorized in the highest BP group.
Statistical analysis
Characteristics of study participants were described in total and by BP categories. Continuous variables are presented as means ± standard deviations (SDs) or medians (interquartile ranges) for skewed variables. Categorical variables are shown in absolute numbers (percentages). Linear regression analysis for continuous variables and chi-square tests for categorical variables were conducted to assess the significance of trend across BP categories. The skewed variables such as triglycerides and urinary ACR were logarithmically transformed before analysis. The percentages of participants who developed arterial stiffness at follow-up were calculated in each BP categories and were compared with the normal BP group using chi-square tests. The risks of developing arterial stiffness in association with BP categories were examined using logistic regression models with the normal BP group as the reference. The multivariable-adjusted OR (95% CI) were also calculated in subgroups of men or women, age <60 years or ≥60 years, with or without dysglycemia, and interactions were tested by adding a multiplicative term to the model. In addition, associations were examined with systolic BP and diastolic BP categories separately. Logistic regression models included model 1 with adjustment for age and sex, model 2 with further adjustment for education, current smoking, current drinking, physical activity, and BMI, and model 3 with additional adjustment for FPG, triglycerides, LDL cholesterol, HDL cholesterol, eGFR, and urinary ACR. Furthermore, associations between changes in BP levels over a 4.3-year follow-up period and risks of arterial stiffness were also examined, using logistic regression models adjusted for cardiovascular risk factors mentioned above. Participants were stratified by baseline and follow-up BP (<130/<80, 130~139/80~89, and ≥140/≥90 mmHg or treated) and cross-combined into 9 categories. Participants with systolic BP <130 mmHg and diastolic BP <80 mmHg at both baseline and follow-up were used as the reference.
A two-sided P value <0.05 was considered statistically significant. All analyses were performed with SAS software version 9.4 (SAS institute, Cary, NC).
Supplementary Materials
Author Contributions
Shanshan Liu, Shujing Wu, and Yu Xu contributed to the conception or design of the work. Shanshan Liu, Shujing Wu, Jingya Niu, Ruizhi Zheng, Lizhan Bie, Zhuojun Xin, Shuangyuan Wang, Hong Lin, Zhiyun Zhao, Mian Li, Tiange Wang, Min Xu, Jieli Lu, Yuhong Chen, Yiping Xu, Yufang Bi, Weiqing Wang, Guang Ning, and Yu Xu contributed to the acquisition, analysis, or interpretation of data for the work. Shanshan Liu, Shujing Wu, and Yu Xu drafted the manuscript. Yufang Bi, Weiqing Wang, Guang Ning, and Yu Xu critically revised the manuscript. All gave final approval and agree to be accountable for all aspects of work ensuring integrity and accuracy.
Conflicts of Interest
The authors declare that they have no conflicts of interest.
Funding
This work was supported by the grants from the National Key R&D Program of China (2017YFC1310700, 2016YFC1305600, 2018YFC1311800), the National Natural Science Foundation of China (81870560, 81700764, 81561128019), National Science and Technology Major Project for “Significant New Drugs Development” (2017ZX09304007), the Shanghai Municipal Government (18411951800), the Shanghai Shenkang Hospital Development Center (SHDC12019101), the Shanghai Jiaotong University School of Medicine (DLY201801), and the Ruijin Hospital (2018CR002). Dr. Y. Xu was supported by the “Outstanding Young Talent Program” from Shanghai Municipal Government. The study sponsor/funder was not involved in the design of the study; the collection, analysis, and interpretation of data; writing the report; and did not impose any restrictions regarding the publication of the report.
References
- 1. Whelton PK, Carey RM, Aronow WS, Casey DE
Jr , Collins KJ, Dennison Himmelfarb C, DePalma SM, Gidding S, Jamerson KA, Jones DW, MacLaughlin EJ, Muntner P, Ovbiagele B, et al. 2017 ACC/AHA/AAPA/ABC/ACPM/AGS/APhA/ASH/ASPC/NMA/PCNA Guideline for the Prevention, Detection, Evaluation, and Management of High Blood Pressure in Adults: Executive Summary: A Report of the American College of Cardiology/American Heart Association Task Force on Clinical Practice Guidelines. Hypertension. 2018; 71:1269–324. https://doi.org/10.1161/HYP.0000000000000066 [PubMed] - 2. Williams B, Mancia G, Spiering W, Agabiti Rosei E, Azizi M, Burnier M, Clement DL, Coca A, de Simone G, Dominiczak A, Kahan T, Mahfoud F, Redon J, et al, and ESC Scientific Document Group. 2018 ESC/ESH Guidelines for the management of arterial hypertension. Eur Heart J. 2018; 39:3021–104. https://doi.org/10.1093/eurheartj/ehy339 [PubMed]
- 3. Unger T, Borghi C, Charchar F, Khan NA, Poulter NR, Prabhakaran D, Ramirez A, Schlaich M, Stergiou GS, Tomaszewski M, Wainford RD, Williams B, Schutte AE. 2020 international society of hypertension global hypertension practice guidelines. Hypertension. 2020; 75:1334–57. https://doi.org/10.1161/HYPERTENSIONAHA.120.15026 [PubMed]
- 4. Xu Y, Wu S, Niu J, Li M, Lu J, Wang W, He J, Solomon HA, Bi Y, Ning G. A comparative analysis of current blood pressure management guidelines in people with and without diabetes. J Diabetes. 2020; 12:781–90. https://doi.org/10.1111/1753-0407.13071 [PubMed]
- 5. Lee H, Cho SM, Park JH, Park S, Kim HC. 2017 ACC/AHA blood pressure classification and cardiovascular disease in 15 million adults of age 20-94 years. J Clin Med. 2019; 8:1832. https://doi.org/10.3390/jcm8111832 [PubMed]
- 6. Qi Y, Han X, Zhao D, Wang W, Wang M, Sun J, Liu J, Li Y, Gao S, Hao Y, Deng Q, Liu J. Long-term cardiovascular risk associated with stage 1 hypertension defined by the 2017 ACC/AHA hypertension guideline. J Am Coll Cardiol. 2018; 72:1201–10. https://doi.org/10.1016/j.jacc.2018.06.056 [PubMed]
- 7. Lee H, Yano Y, Cho SM, Park JH, Park S, Lloyd-Jones DM, Kim HC. Cardiovascular risk of isolated systolic or diastolic hypertension in young adults. Circulation. 2020; 141:1778–86. https://doi.org/10.1161/CIRCULATIONAHA.119.044838 [PubMed]
- 8. Safar ME, Levy BI, Struijker-Boudier H. Current perspectives on arterial stiffness and pulse pressure in hypertension and cardiovascular diseases. Circulation. 2003; 107:2864–69. https://doi.org/10.1161/01.CIR.0000069826.36125.B4 [PubMed]
- 9. Safar ME. Arterial stiffness as a risk factor for clinical hypertension. Nat Rev Cardiol. 2018; 15:97–105. https://doi.org/10.1038/nrcardio.2017.155 [PubMed]
- 10. Ben-Shlomo Y, Spears M, Boustred C, May M, Anderson SG, Benjamin EJ, Boutouyrie P, Cameron J, Chen CH, Cruickshank JK, Hwang SJ, Lakatta EG, Laurent S, et al. Aortic pulse wave velocity improves cardiovascular event prediction: an individual participant meta-analysis of prospective observational data from 17,635 subjects. J Am Coll Cardiol. 2014; 63:636–46. https://doi.org/10.1016/j.jacc.2013.09.063 [PubMed]
- 11. Ohkuma T, Ninomiya T, Tomiyama H, Kario K, Hoshide S, Kita Y, Inoguchi T, Maeda Y, Kohara K, Tabara Y, Nakamura M, Ohkubo T, Watada H, et al, and Collaborative Group for J-BAVEL (Japan Brachial-Ankle Pulse Wave Velocity Individual Participant Data Meta-Analysis of Prospective Studies)*. Brachial-Ankle Pulse Wave Velocity and the Risk Prediction of Cardiovascular Disease: An Individual Participant Data Meta-Analysis. Hypertension. 2017; 69:1045–52. https://doi.org/10.1161/HYPERTENSIONAHA.117.09097 [PubMed]
- 12. Xu Y, Wu Y, Li J, Ma W, Guo X, Luo Y, Hu D. The predictive value of brachial-ankle pulse wave velocity in coronary atherosclerosis and peripheral artery diseases in urban Chinese patients. Hypertens Res. 2008; 31:1079–85. https://doi.org/10.1291/hypres.31.1079 [PubMed]
- 13. Tomiyama H, Koji Y, Yambe M, Shiina K, Motobe K, Yamada J, Shido N, Tanaka N, Chikamori T, Yamashina A. Brachial — ankle pulse wave velocity is a simple and independent predictor of prognosis in patients with acute coronary syndrome. Circ J. 2005; 69:815–22. https://doi.org/10.1253/circj.69.815 [PubMed]
- 14. Katakami N, Osonoi T, Takahara M, Saitou M, Matsuoka TA, Yamasaki Y, Shimomura I. Clinical utility of brachial-ankle pulse wave velocity in the prediction of cardiovascular events in diabetic patients. Cardiovasc Diabetol. 2014; 13:128. https://doi.org/10.1186/s12933-014-0128-5 [PubMed]
- 15. Lee SJ, Avolio A, Seo DC, Kim BS, Kang JH, Lee MY, Sung KC. Relationship between brachial-ankle pulse wave velocity and incident hypertension according to 2017 ACC/AHA high blood pressure guidelines. J Am Heart Assoc. 2019; 8:e013019. https://doi.org/10.1161/JAHA.119.013019 [PubMed]
- 16. AlGhatrif M, Strait JB, Morrell CH, Canepa M, Wright J, Elango P, Scuteri A, Najjar SS, Ferrucci L, Lakatta EG. Longitudinal trajectories of arterial stiffness and the role of blood pressure: the Baltimore Longitudinal Study of Aging. Hypertension. 2013; 62:934–41. https://doi.org/10.1161/HYPERTENSIONAHA.113.01445 [PubMed]
- 17. Yano Y, Reis JP, Colangelo LA, Shimbo D, Viera AJ, Allen NB, Gidding SS, Bress AP, Greenland P, Muntner P, Lloyd-Jones DM. Association of blood pressure classification in young adults using the 2017 American college of cardiology/American heart association blood pressure guideline with cardiovascular events later in life. JAMA. 2018; 320:1774–82. https://doi.org/10.1001/jama.2018.13551 [PubMed]
- 18. Talaei M, Hosseini N, Koh AS, Yuan JM, Koh WP. Association of “elevated blood pressure” and “stage 1 hypertension” with cardiovascular mortality among an Asian population. J Am Heart Assoc. 2018; 7:e008911. https://doi.org/10.1161/JAHA.118.008911 [PubMed]
- 19. Hatano Y, Yano Y, Fujimoto S, Sato Y, Iseki K, Konta T, Moriyama T, Yamagata K, Tsuruya K, Narita I, Kondo M, Kasahara M, Shibagaki Y, et al. The population-attributable fraction for premature mortality due to cardiovascular disease associated with stage 1 and 2 hypertension among Japanese. Am J Hypertens. 2021; 34:56–63. https://doi.org/10.1093/ajh/hpaa128 [PubMed]
- 20. Critselis E, Chrysohoou C, Kollia N, Georgousopoulou EN, Tousoulis D, Pitsavos C, Panagiotakos DB, and ATTICA Study group. Stage 1 hypertension, but not elevated blood pressure, predicts 10-year fatal and non-fatal CVD events in healthy adults: the ATTICA Study. J Hum Hypertens. 2019; 33:308–18. https://doi.org/10.1038/s41371-019-0169-z [PubMed]
- 21. Kuipers AL, Miljkovic I, Barinas-Mitchell E, Cvejkus R, Bunker CH, Wheeler VW, Zmuda JM. Arterial stiffness and hypertension status in Afro-Caribbean men. J Hypertens. 2019; 37:546–54. https://doi.org/10.1097/HJH.0000000000001909 [PubMed]
- 22. Jung MH, Yi SW, An SJ, Yi JJ. Age-specific associations between systolic blood pressure and cardiovascular mortality. Heart. 2019; 105:1070–77. https://doi.org/10.1136/heartjnl-2019-314697 [PubMed]
- 23. Port S, Demer L, Jennrich R, Walter D, Garfinkel A. Systolic blood pressure and mortality. Lancet. 2000; 355:175–80. https://doi.org/10.1016/S0140-6736(99)07051-8 [PubMed]
- 24. Abell JG, Kivimäki M, Dugravot A, Tabak AG, Fayosse A, Shipley M, Sabia S, Singh-Manoux A. Association between systolic blood pressure and dementia in the Whitehall II cohort study: role of age, duration, and threshold used to define hypertension. Eur Heart J. 2018; 39:3119–25. https://doi.org/10.1093/eurheartj/ehy288 [PubMed]
- 25. Mason PJ, Manson JE, Sesso HD, Albert CM, Chown MJ, Cook NR, Greenland P, Ridker PM, Glynn RJ. Blood pressure and risk of secondary cardiovascular events in women: the Women’s Antioxidant Cardiovascular Study (WACS). Circulation. 2004; 109:1623–29. https://doi.org/10.1161/01.CIR.0000124488.06377.77 [PubMed]
- 26. Okayama A, Kadowaki T, Okamura T, Hayakawa T, Ueshima H, and NIPPON DATA80 Research Group. Age-specific effects of systolic and diastolic blood pressures on mortality due to cardiovascular diseases among Japanese men (NIPPON DATA80). J Hypertens. 2006; 24:459–62. https://doi.org/10.1097/01.hjh.0000209981.43983.cf [PubMed]
- 27. Lu Y, Ballew SH, Tanaka H, Szklo M, Heiss G, Coresh J, Matsushita K. 2017 ACC/AHA blood pressure classification and incident peripheral artery disease: The Atherosclerosis Risk in Communities (ARIC) Study. Eur J Prev Cardiol. 2020; 27:51–59. https://doi.org/10.1177/2047487319865378 [PubMed]
- 28. Flint AC, Conell C, Ren X, Banki NM, Chan SL, Rao VA, Melles RB, Bhatt DL. Effect of systolic and diastolic blood pressure on cardiovascular outcomes. N Engl J Med. 2019; 381:243–51. https://doi.org/10.1056/NEJMoa1803180 [PubMed]
- 29. Li M, Xu Y, Xu M, Ma L, Wang T, Liu Y, Dai M, Chen Y, Lu J, Liu J, Bi Y, Ning G. Association between nonalcoholic fatty liver disease (NAFLD) and osteoporotic fracture in middle-aged and elderly Chinese. J Clin Endocrinol Metab. 2012; 97:2033–38. https://doi.org/10.1210/jc.2011-3010 [PubMed]
- 30. Craig CL, Marshall AL, Sjöström M, Bauman AE, Booth ML, Ainsworth BE, Pratt M, Ekelund U, Yngve A, Sallis JF, Oja P. International physical activity questionnaire: 12-country reliability and validity. Med Sci Sports Exerc. 2003; 35:1381–95. https://doi.org/10.1249/01.MSS.0000078924.61453.FB [PubMed]
- 31. Levey AS, Stevens LA, Schmid CH, Zhang YL, Castro AF 3rd, Feldman HI, Kusek JW, Eggers P, Van Lente F, Greene T, Coresh J, and CKD-EPI (Chronic Kidney Disease Epidemiology Collaboration). A new equation to estimate glomerular filtration rate. Ann Intern Med. 2009; 150:604–12. https://doi.org/10.7326/0003-4819-150-9-200905050-00006 [PubMed]
- 32. Wang L, Niu JY, Zhao ZY, Li M, Xu M, Lu JL, Wang TG, Chen YH, Wang SY, Dai M, Li L, Liu SS, Wang WQ, et al. Ideal cardiovascular health is inversely associated with subclinical atherosclerosis: a prospective analysis. Biomed Environ Sci. 2019; 32:260–71. https://doi.org/10.3967/bes2019.036 [PubMed]
- 33. Huang Y, Bi Y, Xu M, Ma Z, Xu Y, Wang T, Li M, Liu Y, Lu J, Chen Y, Huang F, Xu B, Zhang J, et al. Nonalcoholic fatty liver disease is associated with atherosclerosis in middle-aged and elderly Chinese. Arterioscler Thromb Vasc Biol. 2012; 32:2321–26. https://doi.org/10.1161/ATVBAHA.112.252957 [PubMed]