


Introduction
Aging is a progressive structural and functional decline in cellular components and metabolic activities, resulting in a number of chronic diseases and the death of an organism [1]. Although aging is generally considered inevitable, recent studies have revealed that aging can be slowed by many interventions [2]. A growing number of substances have been identified as potential pharmaceutical interventions to enhance longevity in a variety of organisms from yeasts to humans [3]. Mechanistic studies, which demonstrate these substances including metformin, rapamycin, NAD+ boosters and hydrogen sulfide target intracellular signaling pathways that modulate aging, are paving the path toward determining whether they effectively affect aging in human [4–6].
Hydrogen sulfide (H2S), the third gasotransmitter after nitric oxide and carbon monoxide, has gained noteworthy scientific consideration in the present era [7–9]. Traditionally, it has been known as an extremely toxic gas having a characteristic smell of rotten eggs. Its cytotoxicity relies on the interruption of intracellular metabolic activities through the down-regulation of the cytochrome c oxidase thereby inhibiting mitochondrial adenosine triphosphate (ATP) synthesis [10]. Also, physiological concentrations of H2S regulate vaso-relaxation by opening KATP channel [11], and by promoting angiogenesis through the activation of Akt and KATP channel/MAPK pathway [12, 13]. The H2S interacts with glucose and the KATP channel to control insulin secretion [14]. It act as an O2 sensor/transducer in vascular response to hypoxia [15]. It augments NMDA receptor-mediated responses to assist the induction of hippocampal long-term potentiation [16]. Moreover, H2S increases thermotolerance and lifespan in nematodes through SIR-2.1 activity [17]. In addition, H2S protects against neurodegeneration [18, 19], myocardial ischemia-reperfusion injury [20–22], acute inflammation [23] and hypoxia [24].
Recently, it has been demonstrated that ROS modulates lifespan at specific developmental stages [25], suggesting the importance of optimal timing for aging interventions. Considering the co-existence of cyto-protective and cytotoxic effects of H2S, it is especially important to understand the optimal timing of exogenous H2S administration to mostly slow aging. However, this information is lacking due to the use of slow H2S releasing donors which need to be used continuously during lifespan studies [26]. In this study, we treated S. cerevisiae with NaHS, a fast H2S releasing donor with a short half-life, at the early and late phases of growth. We found that a low level of NaHS at the late phase of growth substantially extended yeast CLS. In contrast, the NaHS treatment at the early phase was surprisingly ineffective. Moreover, the similarities and differences in the gene expression profile of both treatment cases provide new insights into the role of H2S in aging.
Results
Lifespan extension by H2S depends on the timing of NaHS treatment
Previous studies have demonstrated that long term H2S treatment by using a combination of a slow H2S-releasing donor, GYY4137, and fast H2S releasing donor, NaHS, extends the CLS of yeast [26]. Considering the dramatic changes in the metabolic pathways of yeast cells during the growth from inoculation up to senescence, the effects of H2S treatment at different stages of growth are unclear. To investigate the stage of growth at which H2S regulates metabolic pathways to increase lifespan, the Saccharomyces cerevisiae strain BY4742 was treated with NaHS at different time periods during growth. While treating yeast cells with two doses of 100 μM NaHS at 24 and 48 hours after inoculation has no effect on cell growth (Supplementary Figure 1), there was also no effect in CLS with one 100 μM dose of NaHS at 12 hours or twice at 24 and 48 hours after inoculation (Figure 1A and 1B). Instead, one NaHS treatment at 84 hours after inoculation resulted in a slight but statically significant increase in CLS (Figure 1C). The extension of CLS was more robust if NaHS was added once at 96 hours or twice at 72 and 96 hours after inoculation (Figure 1D and 1E). Moreover, the day to day treatments starting from 72 hours after inoculation with 100 μM of NaHS also extended the CLS, but there was a sudden decline observed at the later stage of the lifespan (Figure 1F), probably due to the cytotoxic effect of longterm treatments. These results suggest that one or two NaHS treatments later than 72 hours after inoculation are required for CLS extension.
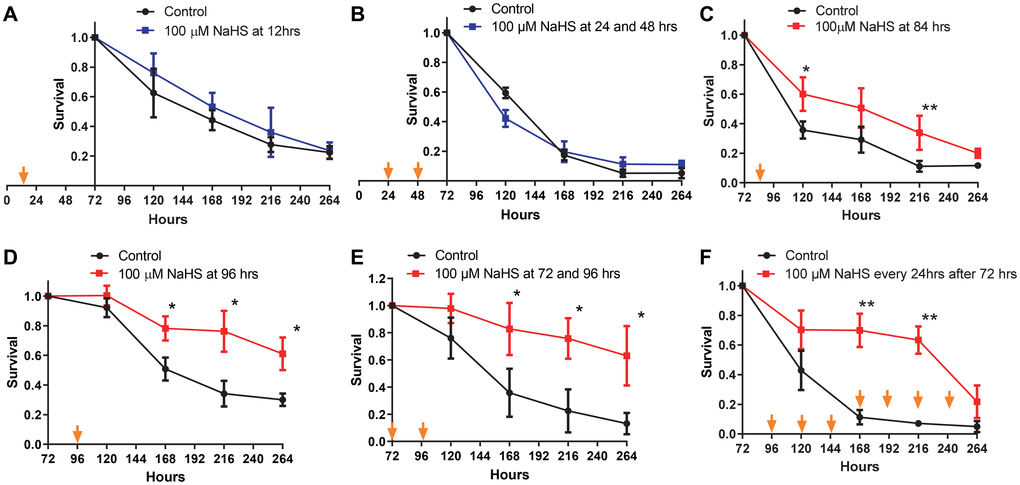
Figure 1. CLS extension is dependent upon the timing of NaHS treatment. Viabilities of cells treated without (black plots) or with 100 μM NaHS at the earlier (blue plots) or the later (red plots) phases of growth were plotted. Specifically, NaHS was added once or twice into cell cultures at the 12 hours (A), 24 and 48 hours (B), 84 hours (C), 96 hours (D), or 72 and 96 hours (E) after inoculation. (F) NaHS was added into cell cultures every 24 hours after 72 hours of inoculation. Arrows indicate the time of NaHS treatment. Triplicate cultures were used to achieve mean ± SD of viabilities. *p < 0.05, **p < 0.01, ***p < 0.001.
Next, we examined if the extension of CLS was dependent on the concentration of NaHS. Two treatments with 10 or 20 μM of NaHS at 72 and 96 hours after inoculation extended lifespan (Figure 2A), although less significantly than treatments at 100 μM (comparing to Figure 1E). And treatments with 500 μM or 1000 μM of NaHS were not more beneficial for lifespan extension than treatment with 100 μM of NaHS (comparing Figure 2B and 2C to Figure 1E). The day to day treatments with 20 μM of NaHS extended the CLS without an accelerated decline in the later stage of lifespan as observed in day to day treatments with 100 μM of NaHS (comparing Figure 2D to Figure 1F), suggesting that the longterm H2S treatment at lower level was less toxic, while still cytoprotective. However, treatments with different concentrations of NaHS at 24 and 48 hours after inoculation did not extend CLS (Figure 2E and 2F). These data suggest that exogenous H2S does not extend yeast CLS if the H2S treatment before 72 hours of growth, which we refer to as the early H2S treatment. Instead, the extension of yeast CLS requires H2S treatment after 72 hours of growth, which we refer to as late H2S treatment.
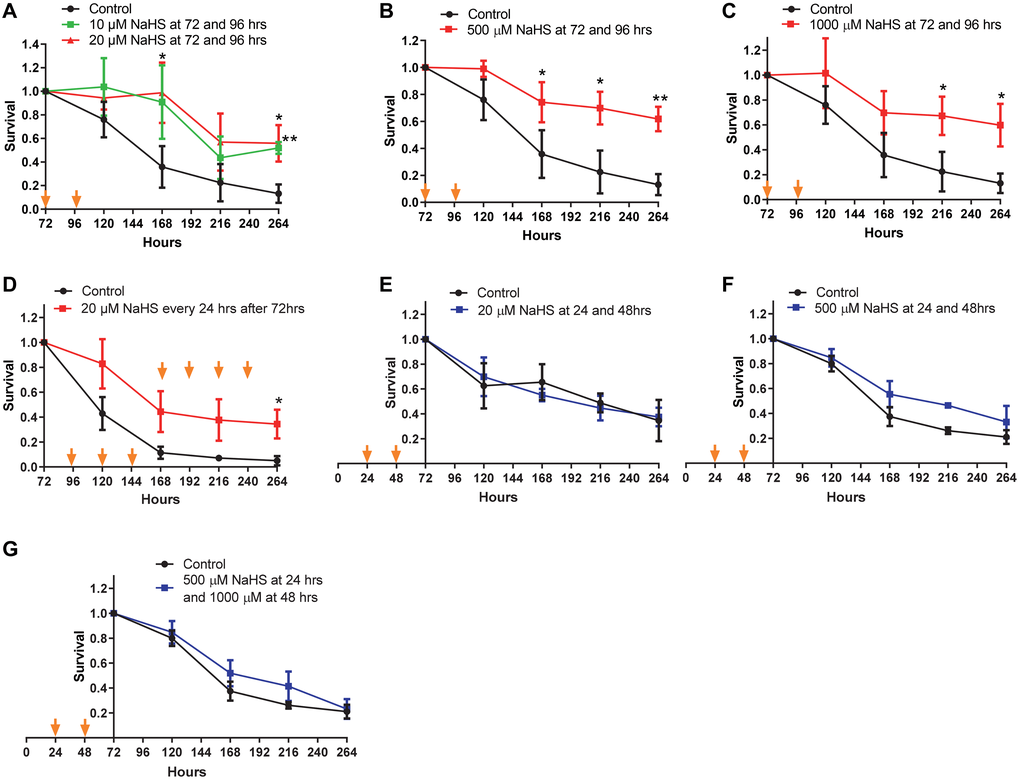
Figure 2. CLS in response to various concentrations of NaHS. Cells were treated with different concentration of NaHS at the early and the late phases of growth. (A–G) Viabilities of Cells treated with or without NaHS at the indicated time were plotted. Arrows indicate the time of NaHS treatment. Triplicate cultures were used to achieve mean ± SD of viabilities. *p < 0.05, **p < 0.01, ***p < 0.001.
Both early and late H2S treatments alter the expression of a wide range of yeast genes
To gain detailed insights into the molecular mechanisms of H2S induced longevity in yeast; we performed RNA-seq analysis of cells with early and late NaHS treatment and their respective untreated controls (Figure 3A). Using (|log2 FC| ≥1, p ≤ 0.05) as the threshold, we identified the differentially expressed genes (DEGs) by comparing the gene expression profiles of the untreated controls to NaHS treated samples at two treatment time points. We identified 928 and 723 DEGs in cells treated with NaHS at the early and late stages, respectively. Among them, 408 genes were upregulated and 520 genes were downregulated in the early NaHS treatment (Figure 3B, Supplementary Table 1), whereas 202 genes were upregulated and 521 genes were downregulated in the late NaHS treatment (Figure 3C, Supplementary Table 2).
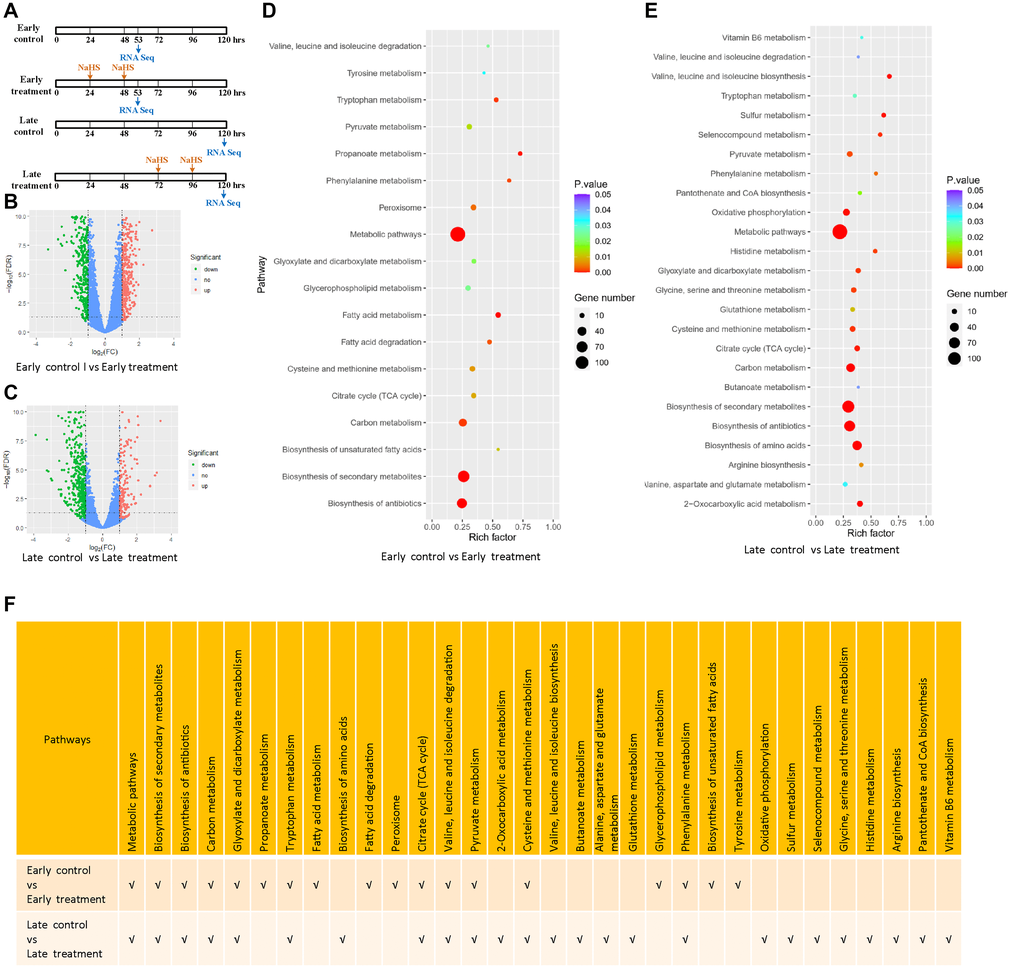
Figure 3. Transcriptomic alterations by the early and late NaHS treatments. (A) Schematic of the early and late NaHS treatments in relation to their untreated controls. 100 μM of NaHS were used for each dosing. (B, C) The volcano plots represent DEGs of indicated controls and treatments. (D, E) The bubble charts representing KEGG enrichment analysis of indicated DEGs. The rich factor indicates the degree of enrichment represented by the ratio of DEGs in a pathway to the number of total genes annotated to that pathway. (F) Comparison of enriched pathways in (D and E).
The KEGG pathway enrichment analysis reveals that both the early and late NaHS treatments have similar impacts on several pathways including biosynthesis of secondary metabolites, carbon metabolism, TCA cycle and metabolism of several amino acids (Figure 3D, 3E and 3F). These results show that early and late NaHS treatments share some gene expression changes. Late NaHS treatment does change a few pathways including oxidative phosphorylation, sulfur metabolism and metabolism of some amino acids and metabolites (Figure 3E and 3F), which may contribute to CLS extension effect of the late NaHS treatment.
To have a deeper insight to the transcriptomic effects of the early and late NaHS treatments, we identified and analyzed genes, which were altered similarly and differently by these two treatments. There are 213 DEGs common in both treatments, including 177 DEGs regulated in same direction (Supplementary Figure 2A, Supplementary Table 3) and 36 DEGs regulated oppositely (Supplementary Figure 2B, Supplementary Table 3). The remaining 715 DEGs in the early treatment (Supplementary Table 4) and 510 DEGs in the late treatments (Supplementary Table 5) are specific for those treatments, respectively. The KEGG analysis of these DEGs indicates that many metabolic pathways were similarly or specifically regulated by the early and late NaHS treatments (Figure 4A–4D). Therefore, similar to the initial analysis (Figure 3F), the KEGG analysis of DEGs expressed in same direction and DEGs specific to each treatment case also revealed the similarities and differences in the transcriptomic effects of the early and late NaHS treatments. Taken together, these data indicate that both the early and late NaHS treatments had similar and profound influences on some metabolic pathways, which may relate to CLS regulation.
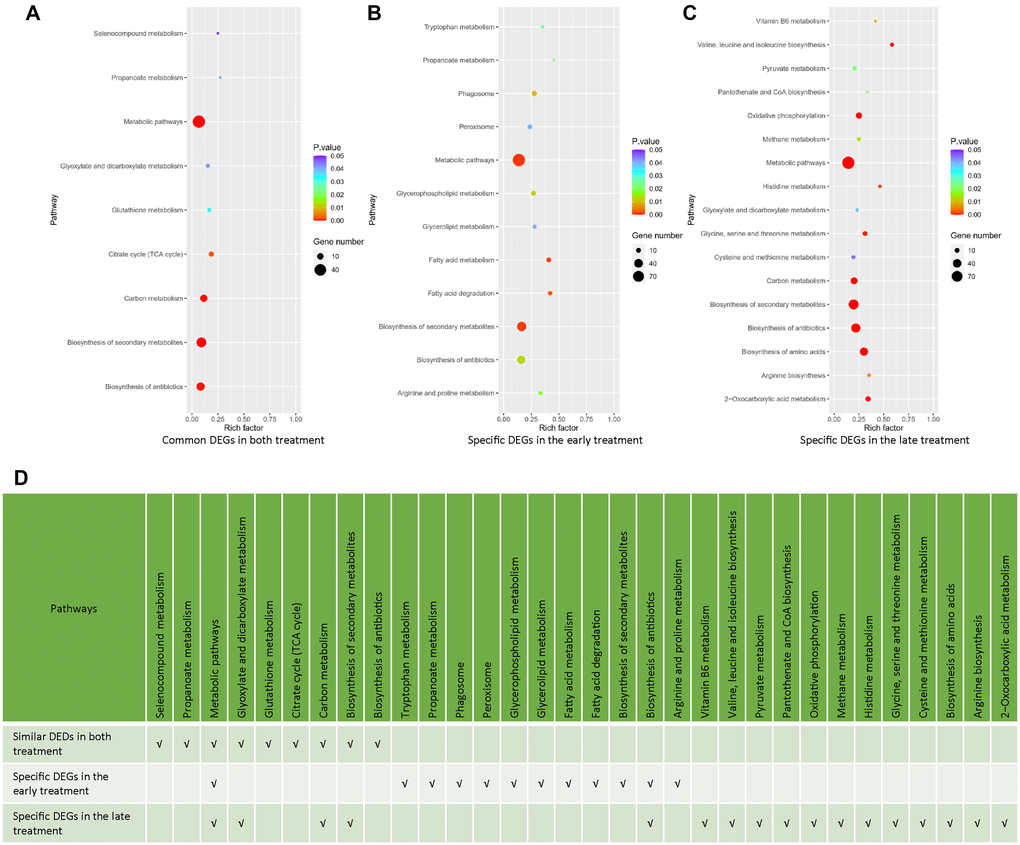
Figure 4. Analysis of common and specific DEGs in the early and late NaHS treatments. (A–C) The bubble charts representing KEGG enrichment analysis of common or specific DEGs in the early and late NaHS treatments. (D) Comparison of enriched pathways in (A–C).
The late NaHS treatment provided more cytoprotection for life span extension
Genes involved in oxidative stress response and heat shock response play essential roles in the regulation of life span [27–31]. To explore the effects of H2S in these stress responses, we identified and analyzed antioxidant genes and heat shock protein (HSP) genes from the DEGs of early and late NaHS treatments. There are 7 antioxidant genes altered by the early and late NaHS treatments (Figure 5A and 5B, Supplementary Table 6). Among them, expression of 3 genes was similarly altered in both treatments including GPX2, TRR2 and CTT1 (Figure 5A–5C). As to HSP genes, 25 and 14 DEGs were found in the early and late NaHS treatments respectively with 12 genes were similarly altered in both treatments (Figure 5D–5F, Supplementary Table 7). The similar alteration in the expression of antioxidant genes and HSP genes under NaHS treatments at two different time points is consistent to the observation that both treatments have some common effects on transcriptome (Figure 4). However, when intracellular ROS was monitored at the 5th day (120 hours after inoculation), the late NaHS treatment decreased ROS production but the early NaHS treatment did not (Figure 5G). When the expression of some of similarly altered antioxidant or HSP genes were examined by qPCR, we found that the up-regulation of HSP78 and HSP104 by the early NaHS treatment persisted to the 5th day of the growth but the up-regulation of GPX2 could not (Figure 5H–5J). Instead, the increased GPX2 level induced by the late NaHS treatment stayed up at the 5th day (Figure 5H, right panel). These data suggest that although the early NaHS treatment provided cyto-protective effects, some of them did not last to the later growth stage when the fitness of the cell is essential for increased lifespan.
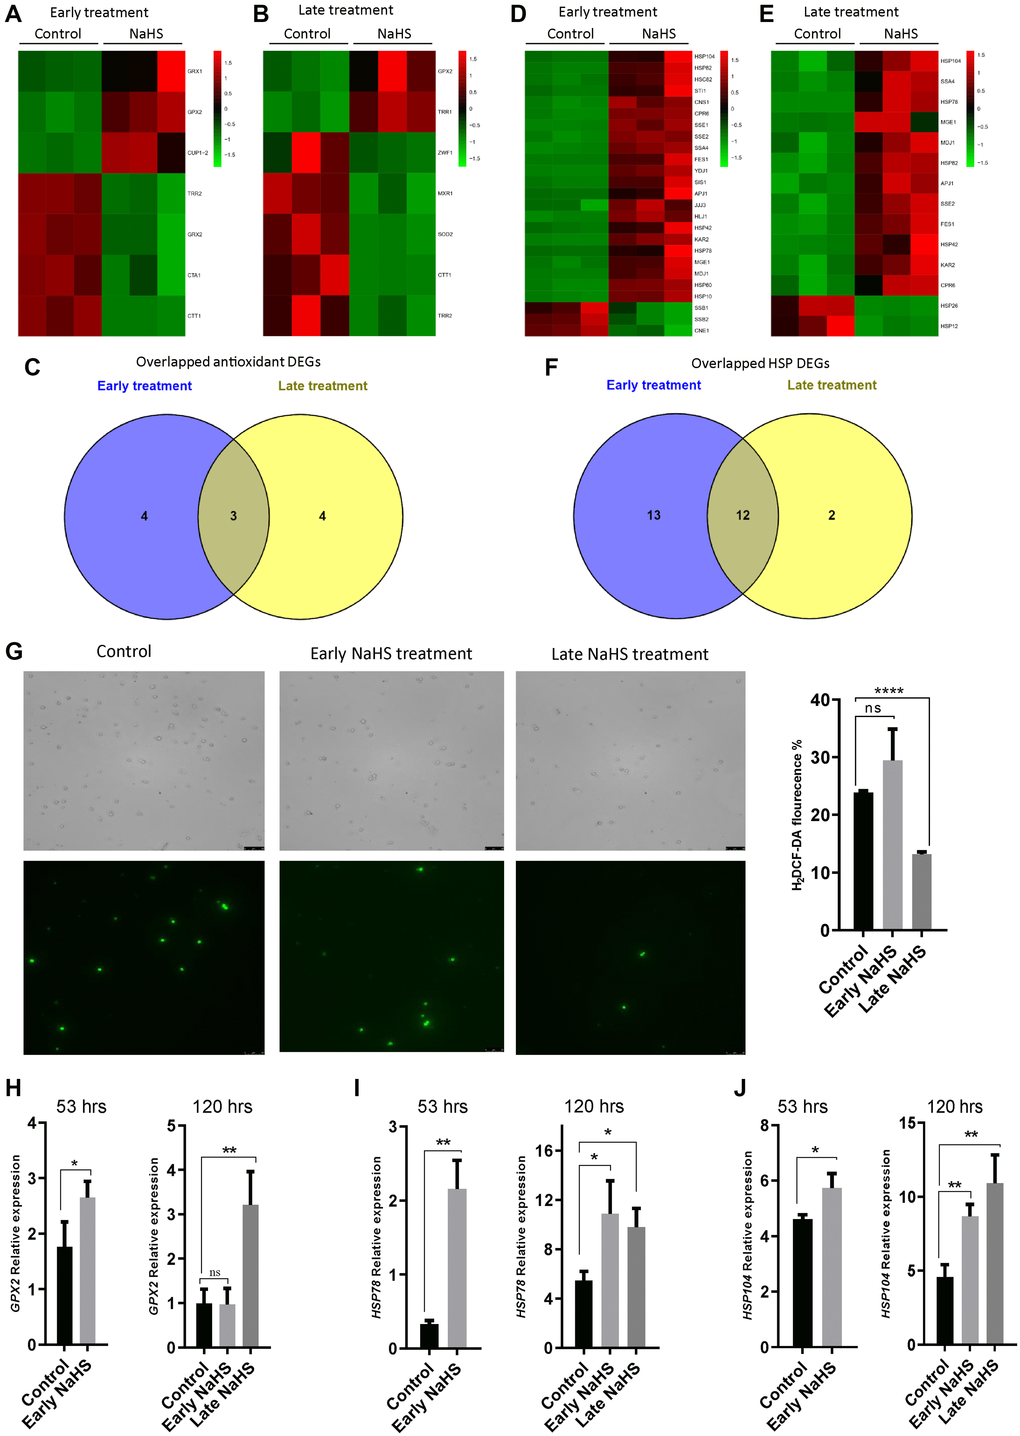
Figure 5. The late NaHS treatment is more cyto-protective. (A and B) Heat maps of antioxidant DEGs in the early and late NaHS treatments. (C) Venn diagram representing overlapped antioxidant DEGs. (D and E) Heat maps of HSP DEGs in the early and late NaHS treatments. (F) Venn diagram representing overlapped HSP DEGs. (G) The generation of Reactive oxygen species (ROS) in the early and late NaHS treatments at day 5 (120 hours after inoculation) was imaged by fluorescence microscope (left) and quantified by calculating the ratio of positively stained cells (right). (H–J) qPCR analysis of GPX2 (H) HSP78 (I) and HSP104 (J) at 53 hours or 120 hours after inoculation with or without the indicated NaHS treatment. The expression of these genes were normalized with the expression of actin (ACT).*p < 0.05, **p < 0.01, ***p < 0.001, ****p < 0.0001
The regulation of cell wall integrity contributed to the life span extension by the late NaHS treatment
Further analysis of the early and late NaHS treatments identified 36 DEGs that are regulated oppositely (Supplementary Figure 2B, Supplementary Table 4). Interestingly, GO analysis revealed that most of these DEGs regulate cell wall components and transport functions which are also influenced by cell wall [32] (Figure 6A), suggesting there may be a significant difference in the regulation of cell wall integrity between the early and late NaHS treatments. More importantly, these DEGs include YPK2, an AGC-type protein kinase and a key regulator of cell wall integrity [33, 34]. The YPK2 is one of the most significant DEGs by the late NaHS treatment while its expression was not altered by the early NaHS treatment (Supplementary Table 6). The qPCR analysis also verified that the expression of YPK2 was up-regulated about 8-fold by the late NaHS treatment, but not the early NaHS treatment (Figure 6B). Therefore, protein kinase Ypk2 is a potential target of the late NaHS treatment. To test if the increased expression of YPK2 induced by the late NaHS treatment contributes to the life span extension, the life span of RCD490, a YPK2 deletion mutant in the BY4742 background, was monitored with or without the late NaHS treatment. We found that the late NaHS treatment did not increase the life span of RCD490 cells (Figure 6C), indicating YPK2 is required for the life span extension induced by the late NaHS treatment. In addition, the effect of the late NaHS treatment on the CLS of wild type and the ypk2 mutant from BY4741 background was examined. The late NaHS treatment also increased the life span of wild-type BY4741 cells, although to a less extend than it did to BY4742 (Figure 6D).YMR104C, a ypk2 mutant at BY4741 background, lived longer than wild-type cells (compare black lines in Figure 6D and 6E). However, the late NaHS treatment did not increase the life span of YMR104C and even decreased the life span (Figure 6E). These data indicate that, although YPK2 is not a longevity gene by itself, it is required for the life span extension of yeast cells induced by the late NaHS treatment. Therefore, we conclude that in addition to the other pathways altered by the late NaHS treatment, the regulation of cell wall integrity is important for the life span extension.
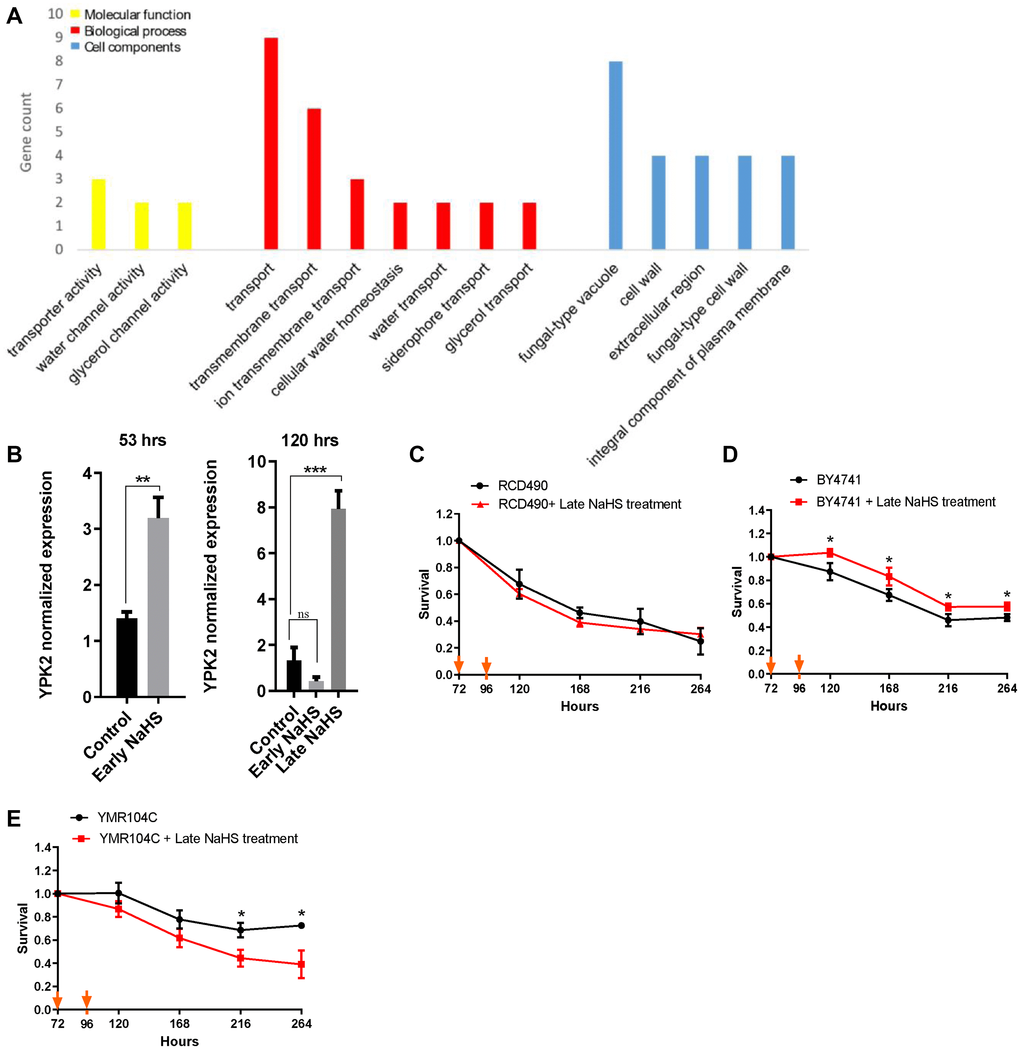
Figure 6. The late NaHS treatment regulates the cell wall integrity for the extension of CLS. (A) Gene ontology analysis of genes expressed oppositely in response to the early and late NaHS treatments. (B) The qPCR analysis of YPK2, an AGC-type protein kinase regulating cell wall integrity. (C) CLS of the late NaHS treated RCD490, a ypk2 mutant in BY4742 background. (D) CLS of the late NaHS treated BY4741. (E) CLS of the late NaHS treated YMR104C, a ypk2 mutant in BY4741 background. Triplicate cultures were used to achieve mean ± SD of viabilities. *p < 0.05, **p < 0.01, ***p < 0.001, ns nonsignificant.
Discussion
The beneficial effects of aging interventions are likely to only be achieved with a correct dosage and timing. The relationship between the treatment timing and lifespan extension is studied less due to the complexity of the roles of these interventions during the growth of different organisms. Yeast Saccharomyces cerevisiae is a well-established model system for studying aging [35–38]. The growth of yeast cells consists of lag, exponential, stationary and death phases, which are more straightforward for investigating the timing of aging interventions. In this study, we found that one or two NaHS treatments at later time (>96 hrs) are required for CLS extension whereas NaHS treatments earlier than 72 hours of inoculation did not bring any considerable change in CLS (Figure 1). We also found that there is a similar effect on CLS by NaHS treatments at concentrations from 10 μM to 1mM (Figure 2), suggesting that the H2S signaling on CLS regulation is not concentration dependent if a critical threshold is crossed. These results indicate that the most crucial factor for the promotion of CLS extension is the timing of NaHS treatment.
In order to achieve greater insight into the underlying mechanism of the differential outcomes from different timing of NaHS treatments, we compared the gene expression profile of the early and late NaHS treated cells to their respective untreated control. We found that both treatments shared some common effects on many metabolic and stress response pathways including biosynthesis of secondary metabolites, carbon metabolism, TCA cycle and metabolism of several amino acids which are related to aging process (Figures 3–5) [39–43].
Despite the obvious similarity of gene expression regulated by the early and late NaHS treatments, there are some DEGs specific to late NaHS treatment were shown by the comparison of the transcriptomes (Figures 4 and 6). Among them, genes related to cell wall integrity seem contribute to CLS extension by the late NaHS treatment because of the importance of cell wall in maintaining yeast lifespan [44]. Indeed, we found that YPK2, a key regulator of cell wall integrity, is up-regulated at stationary stage only by the late NaHS treatment and plays essential roles in NaHS induced CLS extension.
ROS, especially mitochondrial ROS are the key regulators of yeast life span [45, 46]. Increased mitochondrial membrane potential and superoxide production are suggested as an adaptive signal during growth that promotes CLS extension [47]. We show that the late NaHS treatment decreased intracellular ROS significantly but the early NaHS treatment had no effect. In addition, apart from some antioxidant genes specifically regulated in each case, both treatments shared common effects on many antioxidant genes. However, we found that some of those effects caused by the early treatments, such as the altered expression of GPX2, did not last longer and reverted back after sometime (Figure 5), which may contribute to their incompetence to reduce ROS and promote the CLS extension. Furthermore, the observation of changed expression of antioxidant and HSP genes suggested that there are some intracellular alterations in redox status. It also provided potential candidates which may be responsible for some of the effects induced by NaHS treatment.
Together, our data demonstrate that the timing of H2S treatment is vital for promoting CLS extension in yeast. The systematic comparison of the gene expression dynamics of the early and late NaHS treatments indicates that the persistence and specificity of H2S induced changes in gene expression are crucial for the longevity benefits. Indeed, these data provided new insights in to the aging intervention by using H2S and suggesting that the timing of H2S-type of interventions in multicellular eukaryotes is likely to be critical for maximizing health benefits and will require further research efforts.
Materials and Methods
The yeast strains and their genetic backgrounds are enlisted in the Supplementary Table 8. Yeast cells were grown in synthetic dextrose complete (SDC) having composition as shown in Supplementary Table 9. The initial pH of SDC was adjusted to 6.0 [48]. For NaHS treatments, the desired amount of freshly prepared aqueous solution of NaHS (50 mM, Sigma-Aldrich) was added to the cell cultures at the indicated times.
For CLS analysis, yeast cells were grown overnight at 30ºC in SDC medium and then inoculated into 10 ml medium in 50 ml capacity flasks to achieve an initial A600nm of 0.005. These cultures were further kept in a shaking incubator (200 rpm for proper aeration) at 30ºC for indicated time and cell viability was measured by spreading the diluted cultures on YPD agar plates (1% yeast extract, 2% peptone, 2% glucose). The CLS was estimated by counting the number of colonies obtained from the incubation at 30ºC and expressed as fraction of day 3 (72 hours) value.
The 2′, 7′-dichlorodihydrofluorescein diacetate (H2DCF-DA) staining was used for the analysis of ROS [49]. For the H2DCF-DA staining, cells (OD600nm of 1.0) were collected and incubated with 10 μM H2DCF-DA at 30 °C for 60–90 minutes. After the staining, cells were thoroughly washed twice with PBS buffer and then re-suspended in 1 ml PBS. The H2DCF-DA-stained cells were observed by fluorescence microscopy (excitation/emission: 488 nm/530 nm).
For transcriptome and real-time quantitative PCR (RT-qPCR) analysis, the early treatment comprised 2 doses of 100 μM NaHS at the time as indicated in the figures. The total RNA was extracted using TRIzol Reagent according the manufacturer’s instructions (Invitrogen) and genomic DNA was removed using DNase I (TaKara, China). RNA-seq transcriptome library was prepared using TruSeq RNA sample preparation Kit from Illumina (San Diego, CA, USA). Libraries were size selected for cDNA target fragments of 200–300 bp on 2% Low Range Ultra Agarose followed by PCR amplified using Phusion DNA polymerase (NEB) for 15 PCR cycles. After quantified by TBS380, paired-end RNA-seq sequencing library was sequenced with the Illumina HiSeq xten/NovaSeq 6000 sequencer. The raw paired end reads were trimmed and quality controlled by SeqPrep and Sickle software with default parameters. Then clean reads were separately aligned to reference genome with orientation mode using TopHat software. R statistical package software EdgeR was used for differential expression analysis, heat maps, volcano graphs and bubble charts. For gene ontology term and KEGG (Kyoto encyclopedia of genes and genomes) pathways enrichment analysis, David bioinformatics database (version 6.8) was used.
For RT-qPCR analysis, reverse transcription reactions were performed by using a Prime Script RT reagent kit (Takara, China). The primers are listed in Supplementary Table 10. Quantitative PCR was performed by using SYBR Premix Ex Taq II (TaKaRa Bio, China) and Bio-Rad CFX manager RT-qPCR system. Data were collected and analyzed by Bio-Rad CFX manager software. All RT-qPCR data from at least three independent experiments are presented as averages ± SD. Statistical analysis and comparisons were performed by using two-tailed, unpaired Student t-tests.
Data availability statement
The data that support the findings of this study are available from the corresponding author upon reasonable request.
Supplementary Materials
Author Contributions
Prof. Dr. Liu Ke and Arman Ali Shah primarily designed the study and experiments; Arman Ali Shah performed the experiments and analyzed the data; Binghua Liu, Zhihuai Tang, Wang Wang contributed materials/analytic tools; initial draft of the manuscript was prepared by Arman Ali Shah, edited and final shape was given by Prof. Dr Liu Ke. All the other authors also contributed in providing experimental material and they reviewed the manuscript. All authors read and approved the final manuscript.
Acknowledgments
We thank Dr. Robert C. Dickson (University of Kentucky) for kindly gifting us strains, plasmids and antibodies and providing valuable comments and suggestions.
Conflicts of Interest
All authors declare no conflicts of interest.
Funding
This work was supported by NSFC (Grant No. 31870849) and the Fundamental Research Funds for the Central Universities (SCU2020D013). Arman Ali Shah was sponsored by the China Scholarship Council.
References
- 1. Kumar S, Lefevre SD, Veenhuis M, van der Klei IJ. Extension of yeast chronological lifespan by methylamine. PLoS One. 2012; 7:e48982. https://doi.org/10.1371/journal.pone.0048982 [PubMed]
- 2. Longo VD, Antebi A, Bartke A, Barzilai N, Brown-Borg HM, Caruso C, Curiel TJ, de Cabo R, Franceschi C, Gems D, Ingram DK, Johnson TE, Kennedy BK, et al. Interventions to slow aging in humans: Are we ready? Aging Cell. 2015; 14:497–510. https://doi.org/10.1111/acel.12338 [PubMed]
- 3. Moskalev A, Chernyagina E, de Magalhães JP, Barardo D, Thoppil H, Shaposhnikov M, Budovsky A, Fraifeld VE, Garazha A, Tsvetkov V, Bronovitsky E, Bogomolov V, Scerbacov A, et al. Geroprotectors.org: a new, structured and curated database of current therapeutic interventions in aging and age-related disease. Aging (Albany NY). 2015; 7:616–28. https://doi.org/10.18632/aging.100799 [PubMed]
- 4. Moskalev A. Radiation-induced life span alteration of Drosophila lines with genotype differences. Biogerontology. 2007; 8:499–504. https://doi.org/10.1007/s10522-007-9090-x [PubMed]
- 5. Perridon BW, Leuvenink HGD, Hillebrands JL, van Goor H, Bos EM. The role of hydrogen sulfide in aging and age-related pathologies. Aging (Albany NY). 2016; 8:2264–2289. https://doi.org/10.18632/aging.101026 [PubMed]
- 6. Moskalev A, Chernyagina E, Tsvetkov V, Fedintsev A, Shaposhnikov M, Krut'ko V, Zhavoronkov A, Kennedy BK. Developing criteria for evaluation of geroprotectors as a key stage toward translation to the clinic. Aging Cell. 2016; 15:407–15. https://doi.org/10.1111/acel.12463 [PubMed]
- 7. Wang R. The gasotransmitter role of hydrogen sulfide. Antioxid Redox Signal. 2003; 5:493–501. https://doi.org/10.1089/152308603768295249 [PubMed]
- 8. Sen N. Functional and molecular insights of hydrogen sulfide signaling and protein sulfhydration. J Mol Biol. 2017; 429:543–561. https://doi.org/10.1016/j.jmb.2016.12.015 [PubMed]
- 9. Nagy P. Mechanistic chemical perspective of hydrogen sulfide signaling. Methods Enzymol. 2015; 554:3–29. https://doi.org/10.1016/bs.mie.2014.11.036 [PubMed]
- 10. Cooper CE, Brown GC. The inhibition of mitochondrial cytochrome oxidase by the gases carbon monoxide, nitric oxide, hydrogen cyanide and hydrogen sulfide: chemical mechanism and physiological significance. J Bioenerg Biomembr. 2008; 40:533–9. https://doi.org/10.1007/s10863-008-9166-6 [PubMed]
- 11. Zhao W, Zhang J, Lu Y, Wang R. The vasorelaxant effect of H(2)S as a novel endogenous gaseous K(ATP) channel opener. EMBO J. 2001; 20:6008–16. https://doi.org/10.1093/emboj/20.21.6008 [PubMed]
- 12. Cai WJ, Wang MJ, Moore PK, Jin HM, Yao T, Zhu YC. The novel proangiogenic effect of hydrogen sulfide is dependent on Akt phosphorylation. Cardiovasc Res. 2007; 76:29–40. https://doi.org/10.1016/j.cardiores.2007.05.026 [PubMed]
- 13. Papapetropoulos A, Pyriochou A, Altaany Z, Yang G, Marazioti A, Zhou Z, Jeschke MG, Branski LK, Herndon DN, Wang R, Szabó C. Hydrogen sulfide is an endogenous stimulator of angiogenesis. Proc Natl Acad Sci U S A. 2009; 106:21972–7. https://doi.org/10.1073/pnas.0908047106 [PubMed]
- 14. Yang W, Yang G, Jia X, Wu L, Wang R. Activation of KATP channels by H2S in rat insulin-secreting cells and the underlying mechanisms. J Physiol. 2005; 569:519–31. https://doi.org/10.1113/jphysiol.2005.097642 [PubMed]
- 15. Olson KR, Dombkowski RA, Russell MJ, Doellman MM, Head SK, Whitfield NL, Madden JA. Hydrogen sulfide as an oxygen sensor/transducer in vertebrate hypoxic vasoconstriction and hypoxic vasodilation. J Exp Biol. 2006; 209:4011–23. https://doi.org/10.1242/jeb.02480 [PubMed]
- 16. Abe K, Kimura H. The possible role of hydrogen sulfide as an endogenous neuromodulator. J Neurosci. 1996; 16:1066–71. https://doi.org/10.1523/jneurosci.16-03-01066.1996 [PubMed]
- 17. Miller DL, Roth MB. Hydrogen sulfide increases thermotolerance and lifespan in Caenorhabditis elegans. Proc Natl Acad Sci U S A. 2007; 104:20618–22. https://doi.org/10.1073/pnas.0710191104 [PubMed]
- 18. Kimura Y, Kimura H. Hydrogen sulfide protects neurons from oxidative stress. FASEB J. 2004; 18:1165–7. https://doi.org/10.1096/fj.04-1815fje [PubMed]
- 19. Panthi S, Chung HJ, Jung J, Jeong NY. Physiological importance of hydrogen sulfide: emerging potent neuroprotector and neuromodulator. Oxid Med Cell Longev. 2016; 2016:9049782. https://doi.org/10.1155/2016/9049782 [PubMed]
- 20. Bian JS, Yong QC, Pan TT, Feng ZN, Ali MY, Zhou S, Moore PK. Role of hydrogen sulfide in the cardioprotection caused by ischemic preconditioning in the rat heart and cardiac myocytes. J Pharmacol Exp Ther. 2006; 316:670–8. https://doi.org/10.1124/jpet.105.092023 [PubMed]
- 21. Elrod JW, Calvert JW, Morrison J, Doeller JE, Kraus DW, Tao L, Jiao X, Scalia R, Kiss L, Szabo C, Kimura H, Chow CW, Lefer DJ. Hydrogen sulfide attenuates myocardial ischemia-reperfusion injury by preservation of mitochondrial function. Proc Natl Acad Sci U S A. 2007; 104:15560–5. https://doi.org/10.1073/pnas.0705891104 [PubMed]
- 22. Pan LL, Qin M, Liu XH, Zhu YZ. The role of hydrogen sulfide on cardiovascular homeostasis: an overview with update on immunomodulation. Front Pharmacol. 2017; 8:686. https://doi.org/10.3389/fphar.2017.00686 [PubMed]
- 23. Zanardo RCO, Brancaleone V, Distrutti E, Fiorucci S, Cirino G, Wallace JL. Hydrogen sulfide is an endogenous modulator of leukocyte-mediated inflammation. FASEB J. 2006; 20:2118–20. https://doi.org/10.1096/fj.06-6270fje [PubMed]
- 24. Blackstone E, Roth MB. Suspended animation-like state protects mice from lethal hypoxia. Shock. 2007; 27:370–2. https://doi.org/10.1097/shk.0b013e31802e27a0 [PubMed]
- 25. Bazopoulou D, Knoefler D, Zheng Y, Ulrich K, Oleson BJ, Xie L, Kim M, Kaufmann A, Lee YT, Dou Y, Chen Y, Quan S, Jakob U. Developmental ROS individualizes organismal stress resistance and lifespan. Nature. 2019; 576:301–305. https://doi.org/10.1038/s41586-019-1814-y [PubMed]
- 26. Hine C, Harputlugil E, Zhang Y, Ruckenstuhl C, Lee BC, Brace L, Longchamp A, Treviño-Villarreal JH, Mejia P, Ozaki CK, Wang R, Gladyshev VN, Madeo F, et al. Endogenous hydrogen sulfide production is essential for dietary restriction benefits. Cell. 2015; 160:132–44. https://doi.org/10.1016/j.cell.2014.11.048 [PubMed]
- 27. Jazwinski SM. Longevity, genes, and aging. Science. 1996; 273:54–9. https://doi.org/10.1126/science.273.5271.54 [PubMed]
- 28. Shama S, Lai CY, Antoniazzi JM, Jiang JC, Jazwinski SM. Heat stress-induced life span extension in yeast. Exp Cell Res. 1998; 245:379–88. https://doi.org/10.1006/excr.1998.4279 [PubMed]
- 29. Verghese J, Abrams J, Wang Y, Morano KA. Biology of the heat shock response and protein chaperones: budding yeast (Saccharomyces cerevisiae) as a model system. Microbiol Mol Biol Rev. 2012; 76:115–58. https://doi.org/10.1128/mmbr.05018-11 [PubMed]
- 30. Camougrand N, Rigoulet M. Aging and oxidative stress: studies of some genes involved both in aging and in response to oxidative stress. Respir Physiol. 2001; 128:393–401. https://doi.org/10.1016/s0034-5687(01)00314-0 [PubMed]
- 31. Estruch F. Stress-controlled transcription factors, stress-induced genes and stress tolerance in budding yeast. FEMS Microbiol Rev. 2000; 24:469–86. https://doi.org/10.1111/j.1574-6976.2000.tb00551.x [PubMed]
- 32. Volkov V. Quantitative description of ion transport via plasma membrane of yeast and small cells. Front Plant Sci. 2015; 6:425. https://doi.org/10.3389/fpls.2015.00425 [PubMed]
- 33. Liu K, Zhang X, Lester RL, Dickson RC. The sphingoid long chain base phytosphingosine activates AGC-type protein kinases in Saccharomyces cerevisiae including Ypk1, Ypk2, and Sch9. J Biol Chem. 2005; 280:22679–87. https://doi.org/10.1074/jbc.m502972200 [PubMed]
- 34. Roelants FM, Torrance PD, Bezman N, Thorner J. Pkh1 and Pkh2 differentially phosphorylate and activate Ypk1 and Ykr2 and define protein kinase modules required for maintenance of cell wall integrity. Mol Biol Cell. 2002; 13:3005–28. https://doi.org/10.1091/mbc.e02-04-0201 [PubMed]
- 35. Kaeberlein M, Burtner CR, Kennedy BK. Recent developments in yeast aging. PLoS Genet. 2007; 3:e84. https://doi.org/10.1371/journal.pgen.0030084 [PubMed]
- 36. Bitterman KJ, Medvedik O, Sinclair DA. Longevity regulation in Saccharomyces cerevisiae: linking metabolism, genome stability, and heterochromatin. Microbiol Mol Biol Rev. 2003; 67:376–99. https://doi.org/10.1128/mmbr.67.3.376-399.2003 [PubMed]
- 37. Piper PW. Long-lived yeast as a model for ageing research. Yeast. 2006; 23:215–26. https://doi.org/10.1002/yea.1354 [PubMed]
- 38. Kaeberlein M. Longevity and aging in the budding yeast. Handbook of models for human aging. 2006:109–20.
- 39. Longo VD. The Ras and Sch9 pathways regulate stress resistance and longevity. Exp Gerontol. 2003; 38:807–11. https://doi.org/10.1016/s0531-5565(03)00113-x [PubMed]
- 40. Jazwinski SM. Yeast longevity and aging--the mitochondrial connection. Mech Ageing Dev. 2005; 126:243–8. https://doi.org/10.1016/j.mad.2004.08.016 [PubMed]
- 41. Jazwinski SM. Growing old: metabolic control and yeast aging. Annu Rev Microbiol. 2002; 56:769–92. https://doi.org/10.1146/annurev.micro.56.012302.160830 [PubMed]
- 42. Goldberg AA, Bourque SD, Kyryakov P, Gregg C, Boukh-Viner T, Beach A, Burstein MT, Machkalyan G, Richard V, Rampersad S, Cyr D, Milijevic S, Titorenko VI. Effect of calorie restriction on the metabolic history of chronologically aging yeast. Exp Gerontol. 2009; 44:555–71. https://doi.org/10.1016/j.exger.2009.06.001 [PubMed]
- 43. Zhang N, Cao L. Starvation signals in yeast are integrated to coordinate metabolic reprogramming and stress response to ensure longevity. Curr Genet. 2017; 63:839–843. https://doi.org/10.1007/s00294-017-0697-4 [PubMed]
- 44. Molon M, Woznicka O, Zebrowski J. Cell wall biosynthesis impairment affects the budding lifespan of the Saccharomyces cerevisiae yeast. Biogerontology. 2018; 19:67–79. https://doi.org/10.1007/s10522-017-9740-6 [PubMed]
- 45. Balaban RS, Nemoto S, Finkel T. Mitochondria, oxidants, and aging. Cell. 2005; 120:483–95. https://doi.org/10.1016/j.cell.2005.02.001 [PubMed]
- 46. Shadel GS. Expression and maintenance of mitochondrial DNA: new insights into human disease pathology. Am J Pathol. 2008; 172:1445–56. https://doi.org/10.2353/ajpath.2008.071163 [PubMed]
- 47. Pan Y, Schroeder EA, Ocampo A, Barrientos A, Shadel GS. Regulation of yeast chronological life span by TORC1 via adaptive mitochondrial ROS signaling. Cell Metab. 2011; 13:668–78. https://doi.org/10.1016/j.cmet.2011.03.018 [PubMed]
- 48. Fabrizio P, Longo VD. The chronological life span of Saccharomyces cerevisiae. Methods Mol Biol. 2007; 371:89–95. https://doi.org/10.1007/978-1-59745-361-5_8 [PubMed]
- 49. Mesquita A, Weinberger M, Silva A, Sampaio-Marques B, Almeida B, Leão C, Costa V, Rodrigues F, Burhans WC, Ludovico P. Caloric restriction or catalase inactivation extends yeast chronological lifespan by inducing H2O2 and superoxide dismutase activity. Proc Natl Acad Sci U S A. 2010; 107:15123–8. https://doi.org/10.1073/pnas.1004432107 [PubMed]