


Introduction
Idiopathic pulmonary fibrosis (IPF) is a chronic lung disease characterized by progressive pulmonary interstitial fibrosis and lung dysfunction. IPF patients usually show a poor prognosis with an average survival time of 3–5 years [1], and the specific etiology and pathogenesis of IPF remain unclear.
N6-methyladenosine (m6A) is the most abundant mRNA modification in mammalian cells. There are three types of proteins that regulate m6A: 1) “writers,” including methyltransferase-like 3 (METTL3), METTL14, Wilms tumor 1-associated protein, and KIAA1429; 2) “easers,” including fat mass and obesity-associated protein and alkB homologue 5; and 3) “readers,” including members of the YT521-B homology domain-containing protein and the heterogeneous nuclear ribonucleoprotein families [2]. Recent studies have suggested that m6A is involved in the regulation of numerous physiological processes, including cell differentiation, tumorigenesis, and viral immunity [3–5]. In addition, studies have shown that it could serve as a potential prognostic predictor for cancer patients [6, 7]. Another study also demonstrated that m6A modification of pri-miRNA-126 could activate the PI3K/AKT/mTOR pathway, contributing to pulmonary fibrosis in mice [8].
Since late 2019, a novel highly transmissible coronavirus, which was later defined as severe acute respiratory syndrome coronavirus 2 (SARS-CoV-2), has emerged, causing a global pandemic of acute respiratory disease, named “coronavirus disease 2019” (COVID-19). To date, no effective treatment has been available. Recently, researchers identified 332 high-confidence SARS-CoV-2-human protein–protein interactions, revealing targets for drug repurposing [9]. Because COVID-19 is an acute pulmonary infection with a certain potential correlation with IPF, the association between COVID-19 and IPF at the cellular and genetic levels is worth exploring.
In this study, we innovatively explored the association between m6A methylation regulators, COVID-19 infection pathways, and immune responses. The characteristic gene expression networks and immune infiltration patterns of m6A-SARS-CoV-2 related genes in different tissues of IPF were revealed. Moreover, we evaluated the influence of these related gene expression and immune infiltration patterns on the prognosis/lung function of the IPF patients. During the COVID-19 pandemic, these results would help to further understand the link between IPF and SARS-CoV-2 infection and provide new insights for prognosis assessment and treatment of both diseases.
Results
The gene expression patterns related to m6A and SARS-CoV-2 in IPF
The discovery cohort included 176 IPF patients from the GEO database (GSE70867). The batch effect was eliminated using the sva package (Figure 1A, 1B). We extracted the expression matrices of 19 m6A-related genes and 305 SARS-CoV-2 related genes from the GEO datasets. A total of 110 SARS-CoV-2 related genes were found to be significantly correlated with m6A-related genes, which were defined as m6A-related-CoV genes. Combined with the survival information, univariate Cox regression was then applied to screen prognostic genes, and 9 m6A-related-CoV genes (p < 0.01) were retained (Figure 1C). Then, we performed a LASSO regression, and eight optimal variables were obtained from the above 9 m6A-related-CoV genes. The correlations between the m6A-related genes and the 8 m6A-related-CoV genes are shown in Figure 1D.
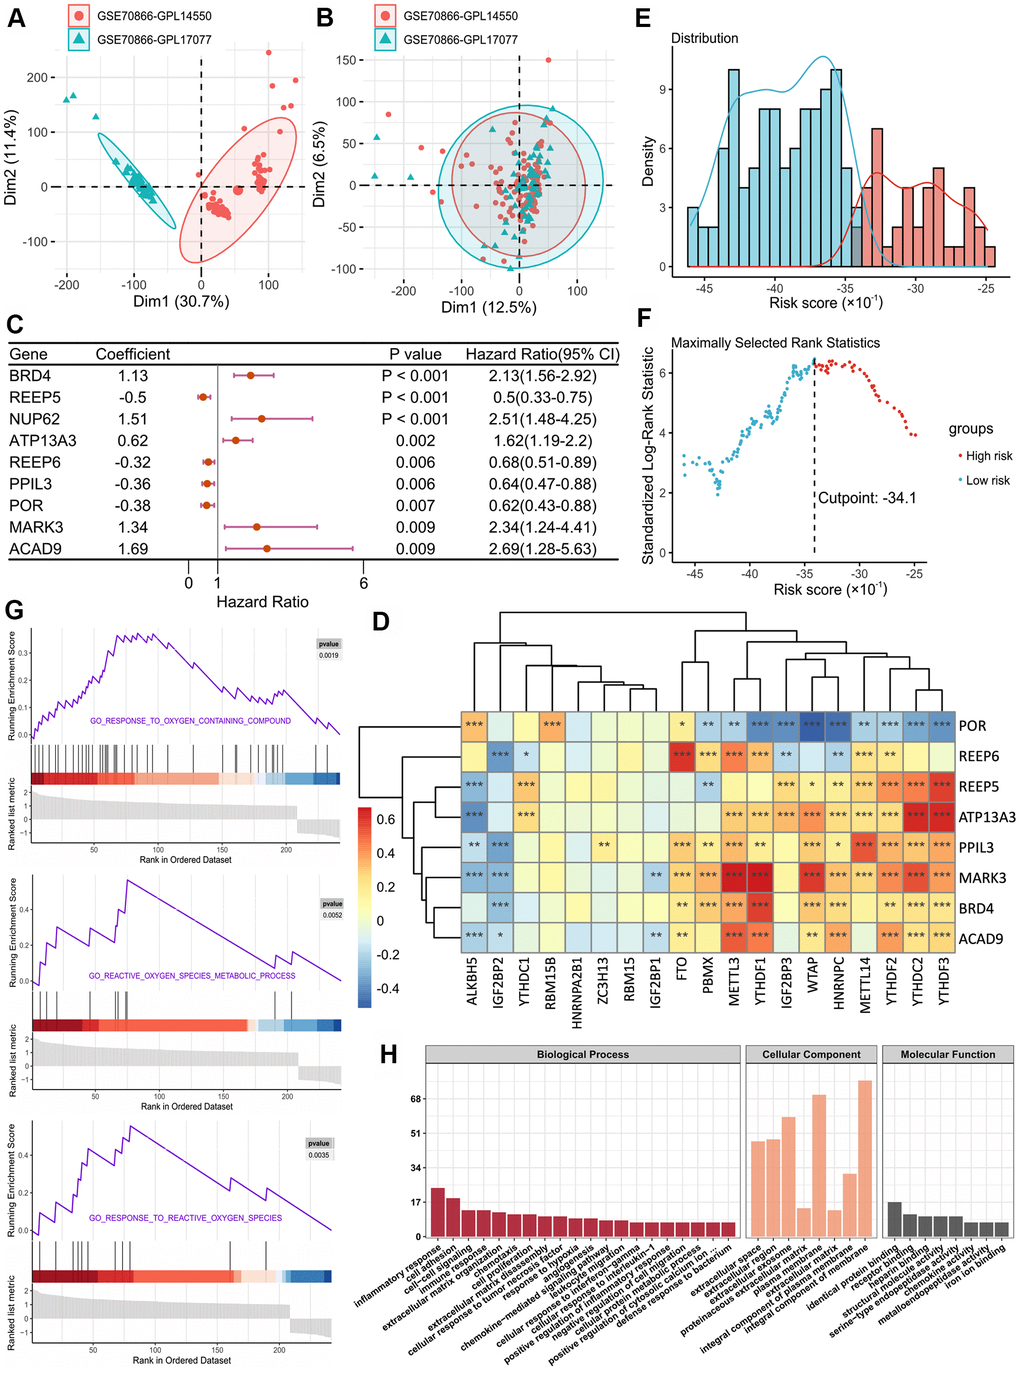
Figure 1. (A, B) Eliminating the batch effect between different sequencing platforms. (A) is the principal component analysis (PCA) plot before elimination of the batch effect, and (B) is the PCA plot after elimination. (C) Forest plot of 9 DEGs with P < 0.01 by univariate Cox regression. (D) The correlations between the m6A-related genes and 8 m6A-related-CoV genes. (E) Histogram based on maximally selected rank grouping. (F) The cut-off point with the maximum standard log-rank statistic was marked with a vertical dashed line. (G) The plots of GSEA results. (H) GO enrichment analysis of risk DEGs.
Additionally, we used the expression levels of 8 m6A-related-CoV genes and the corresponding coefficients derived from the multivariate Cox regression model to estimate the risk score for each patient: Score 1 = 0.3869 × expression of BRD4 + 0.6027 × expression of ATP13A3 + 0.3401 × expression of MARK3 + 0.3019 × expression of ACAD9 - 0.8837 × expression of REEP5 - 0.3489 × expression of REEP6 - 0.4576 × expression of PPIL3 - 0.2066 × expression of POR. Based on the Score 1 of each patient, we divided the patients into two groups using the maximally selected rank method: high-risk group and low-risk group (Figure 1E, 1F).
Due to the different prognostic outcomes, we sought to investigate the possible differences between the high-risk and low-risk groups using the gene set enrichment analysis (GSEA). The results suggested that high-risk patients had high levels of response to oxygen-containing compound signaling pathway, reactive oxygen species (ROS) metabolic process signaling pathway, and response to ROS signaling pathway (Figure 1G). In gene ontology (GO) functional annotation, biological process analysis suggested that overexpressed genes in the high-risk group were significantly enriched in the regulation of inflammatory response, cell adhesion, immune response, cell–cell signaling, and extracellular matrix organization. For cellular component analysis, these genes were significantly enriched in the integral components of the membrane, plasma membrane, and extracellular exosome. Molecular function analysis revealed that these proteins were significantly enriched in protein binding and receptor binding (Figure 1H).
The m6A-CoV related lncRNAs in IPF
To further explore the gene regulatory network, we identified eight lncRNAs that were significantly correlated with both SARS-CoV-2 related genes and m6A related genes, which were defined as m6A-CoV related lncRNAs. Figure 2A, 2B shows the correlations between the lncRNAs and SARS-CoV-2/m6A related genes, respectively (SARS-CoV-2/m6A related genes that are not significantly related are not shown in the figure). After univariate Cox and LASSO screening, 2 m6A-CoV related lncRNAs were screened for a multivariate Cox regression model to estimate the risk score: Score 2 = -0.3251 × expression of MGC4859 - 0.1319 × expression of HYMAI. The IPF patients were also divided into high-risk and low-risk groups based on Score 2 (Figure 2C, 2D).
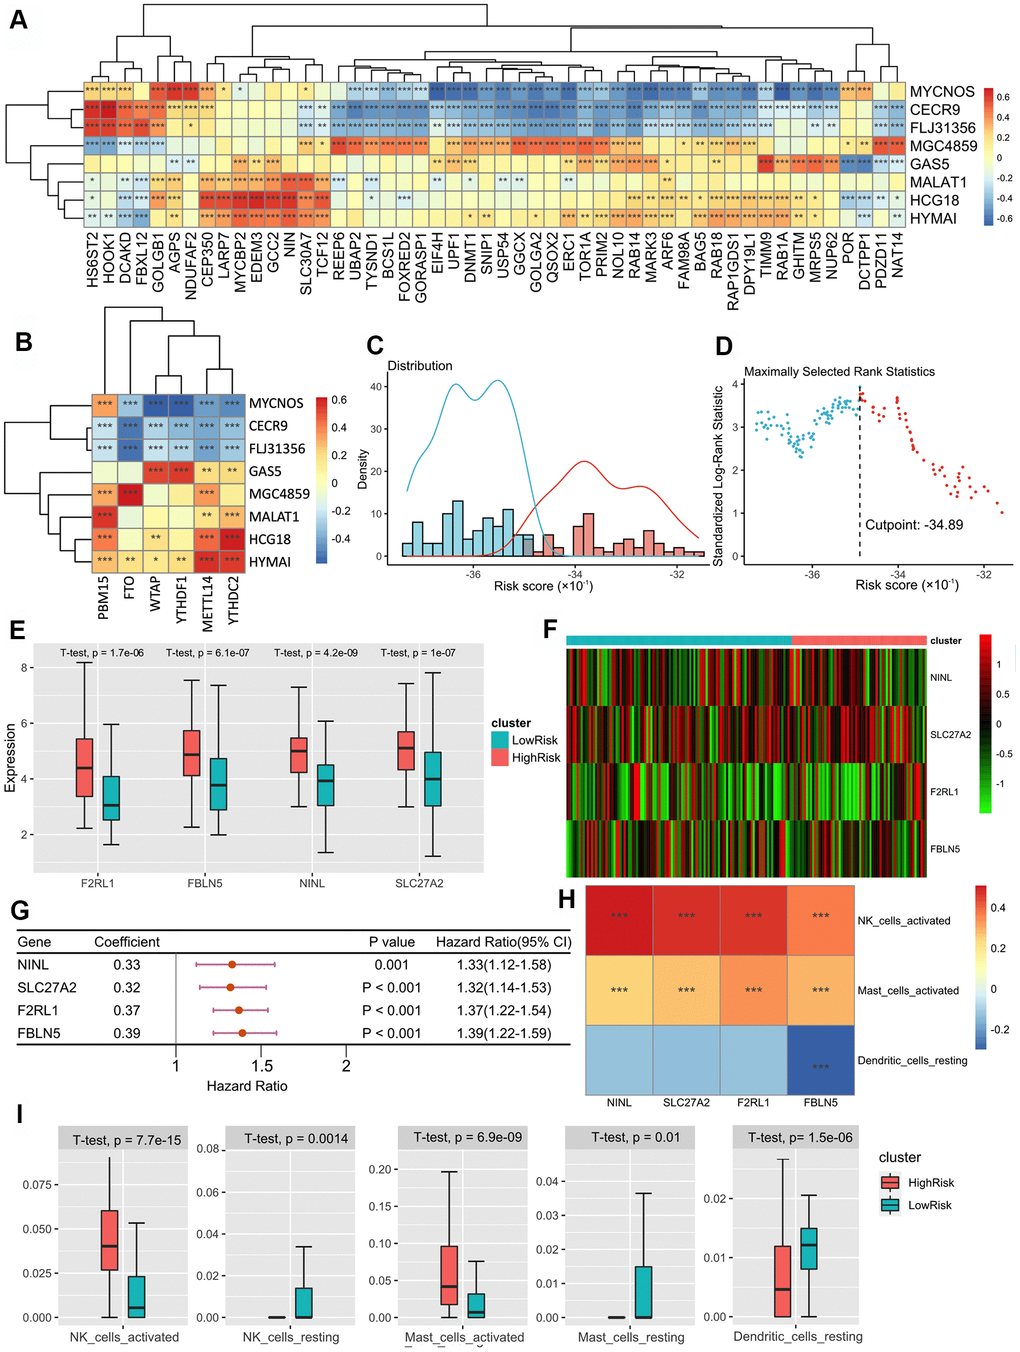
Figure 2. (A) The heatmap of the correlations between the lncRNAs and SARS-CoV-2 related genes. (B) The heatmap of correlations between the lncRNAs and m6A related genes. (C) Histogram based on maximally selected rank grouping. (D) The cut-off point with the maximum standard log-rank statistic was marked with a vertical dashed line. (E) The box plot showed the difference of F2RL1, FBLN5, NINL and SLC27C between low-risk group and high-risk groups. (F) The expression profiles of DEGs between the low-risk group and high-risk groups. (G) Forest plot of 9 DEGs with P < 0.01 by univariate Cox regression. (H) The heatmap of the correlations between three DEGs and 4 immune cells. (I) The box plot showed the significant difference of the immune cell infiltration between two groups.
The combined model based on Score 1–3 and survival prognosis verification
Based on the risk models of m6A-related-CoV genes (Score 1), m6A-CoV related lncRNAs (Score 2), and SARS-CoV-2 related immune infiltration patterns (Score 3), multivariate Cox regression was used to establish the combined model: Score-combined = 0.7902 × Score 1 + 0.576 × Score 2 + 0.4434 × Score 3.
Finally, we performed a prognostic validation using three independent models and a combined model. The results demonstrated that the group survival verifications of the three independent models and the combined model were significant (Figure 3A–3F). The receiver operating characteristic (ROC) curve showed that the area under the curve (AUC) values of the combined model within 1–5 years were all greater than 0.75 in the discovery cohort, which were also greater than the AUC of the independent models (Figure 3G–3J). This suggests that the combined model has a better predictive value for the prognosis of the IPF patients. We further developed a nomogram for 1–5 years of overall survival prediction based on the combined Cox model (Figure 3K).
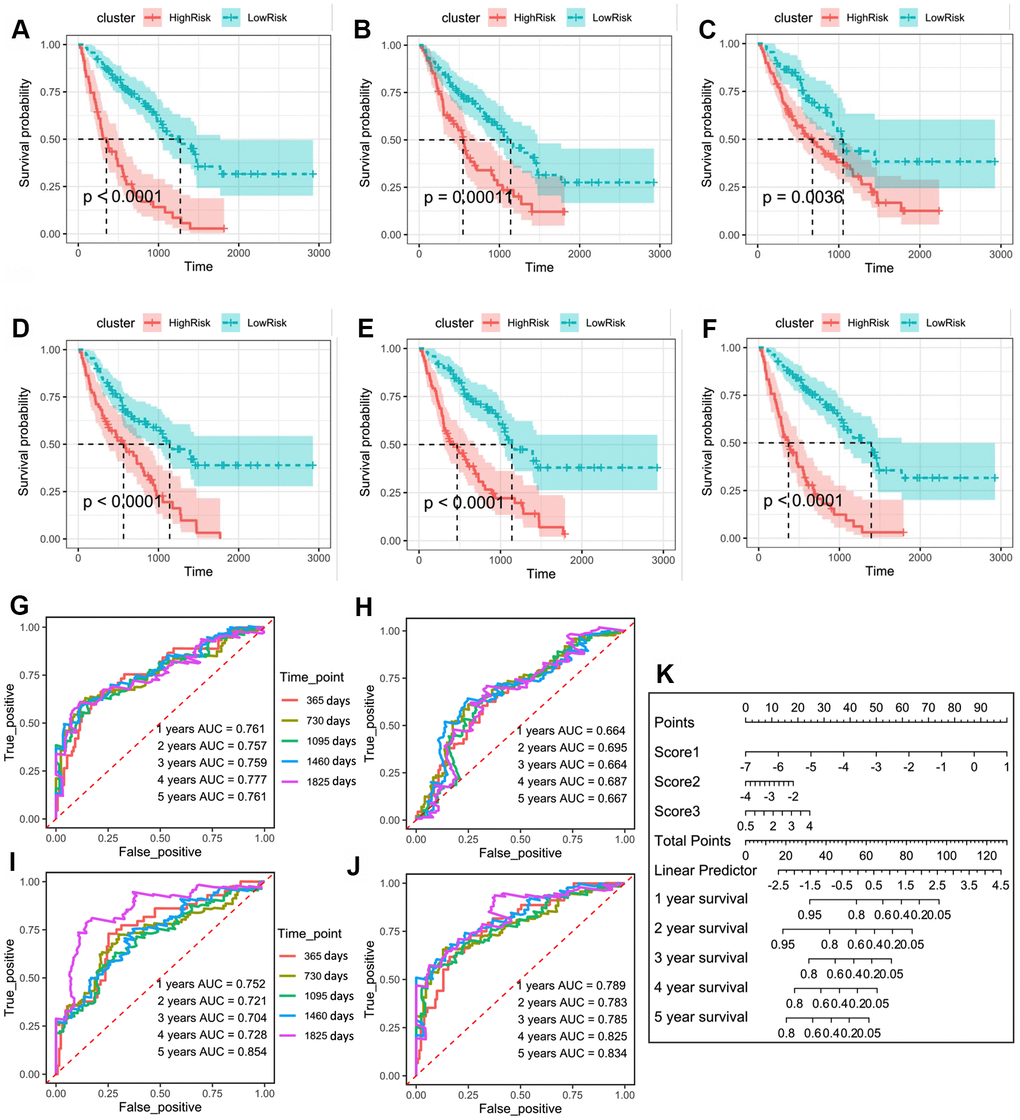
Figure 3. (A) Kaplan–Meier plot of overall survival in two clusters based on the risk models of m6A-related-CoV genes (Score 1). (B) Kaplan–Meier plot of overall survival in two clusters based on the risk models of m6A-CoV related lncRNAs (Score 2). (C) Kaplan–Meier plot of overall survival in two clusters based on the risk models of ESTIMATE immune score. (D) Kaplan–Meier plot of overall survival in two clusters based on the risk models of 3 immune cells’ infiltration. (E) Kaplan–Meier plot of overall survival in two clusters based on the risk models of SARS-CoV-2 related immune infiltration patterns (Score 3). (F) Kaplan–Meier plot of overall survival in two clusters based on the risk models of the combined Cox regression model. (G) The ROC curve in the risk models of m6A-related-CoV genes (Score 1). (H) The ROC curve in the risk models of m6A-CoV related lncRNAs (Score 2). (I) The ROC curve in the risk models of SARS-CoV-2 related immune infiltration patterns (Score 3). (J) The ROC curve in the risk models of the combined Cox regression model. (K) The nomogram for the 1–5-year overall survival based on the combined Cox regression model.
The networks of m6A-SARS-CoV-2 related genes and immune infiltration patterns in the whole blood of IPF
We further verified the above prediction method in external data sets (GSE93606), which included the peripheral whole blood from 57 patients with IPF. Similarly, we screened nine m6A-related-CoV genes (Figure 4A). Multivariate Cox regression model to estimate the risk score was used as follows: Score 1 = 0.8919 × expression of ZC3H7A - 0.1496 × expression of YIF1A - 1.4191 × expression of BAG5 + 3.9659 × expression of RHOA + 2.3642 × expression of NUP214 + 0.4134 × expression of INTS4 + 0.7913 × expression of GLA + 1.4476 × expression of AAR2 + 1.4582 × expression of ATP1B1.
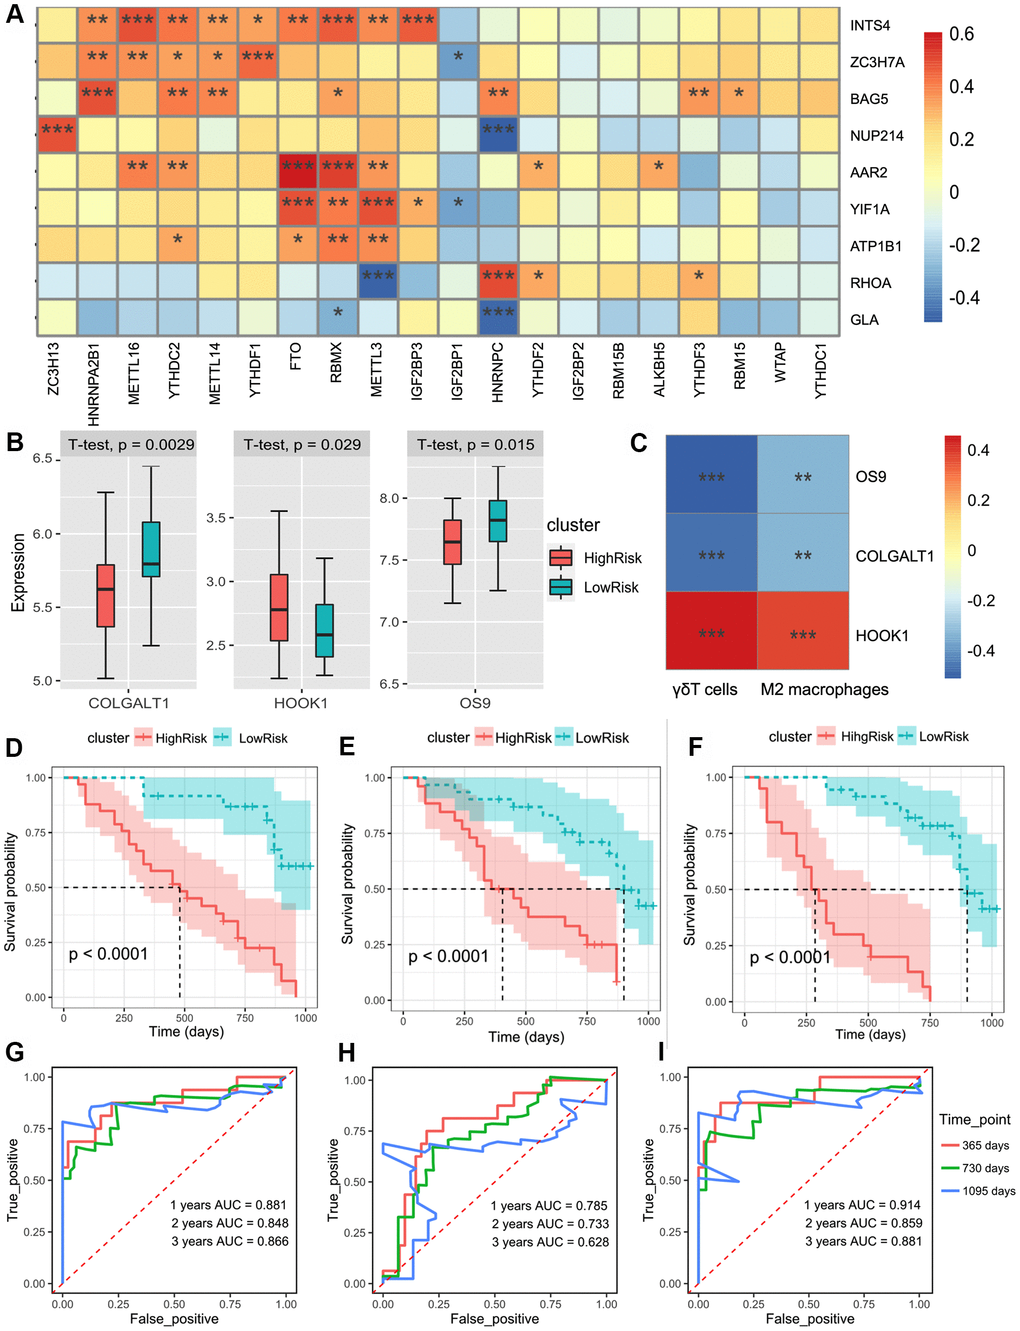
Figure 4. (A) The heatmap of the correlations between the m6A-related genes and 9 m6A-related-CoV genes in the whole blood of IPF. (B) Patients were divided into the low-risk group and high-risk group according to the infiltration of γδT cells and M2 macrophages. The box plot showed the difference of the COLGALT1, HOOK1, and OS9 between low-risk and high-risk groups. (C) The heatmap of the correlations between the 2 immune cell composition and 3 SARS-CoV-2 related DEGs. (D) Kaplan–Meier plot of overall survival in two clusters based on the risk models of m6A-related-CoV genes (Score 1). (E) Kaplan–Meier plot of overall survival in two clusters based on the risk models of the immune infiltration patterns (Score 2). (F) Kaplan–Meier plot of the overall survival in two clusters based on the risk models of the combined Cox regression model. (G) The ROC curve in the risk models of m6A-related-CoV genes (Score 1). (H) The ROC curve in the risk models of the immune infiltration patterns (Score 2). (I) The ROC curve in the risk models of the combined Cox regression model.
Univariate Cox regression showed that γδT cells and M2 macrophages were significantly correlated with the survival of patients with IPF (p < 0.01). LASSO-Cox analysis showed that γδT cells and M2 macrophages were positively correlated with the risk of poor prognosis. We included two immune cells in the multivariate Cox regression model to estimate the risk score: Score 2 = 14.4 × composition of γδT cells + 24.7 × composition of M2 macrophages. Based on Score 2, we divided the patients into two groups, and three differentially expressed SARS-CoV2-related DEGs were obtained (Figure 4B). The co-expression patterns of SARS-CoV2-related genes and immune cell infiltration are shown in Figure 4C.
Based on the risk models of m6A-related-CoV genes (Score 1), the SARS-CoV-2 related immune infiltration patterns (Score 2), and the multivariate Cox regression model was used to establish the combined model: Score-combined = 1.0217 × Score 1 + 1.0217 × Score 2. Prognostic validations of the two independent models and the combined model were performed. The results demonstrated that the group survival verifications of the two models and the combined model were significant (Figure 4D–4F). The AUC of the combined model within 1–3 years was greater than that of the two independent models (Figure 4H, 4I).
The networks of m6A-SARS-CoV-2 related genes and immune infiltration patterns in peripheral blood mononuclear cells (PBMC) of the IPF
We verified the above prediction method in the external dataset “GSE28221,” which included 120 IPF patients’ peripheral blood mononuclear cells. Similarly, we screened seven m6A-related-CoV genes (Figure 5A). Meanwhile, there were 5 m6A-CoV related lncRNAs extract from the datasets. The alluvial diagram showed a correlation between m6A-CoV related lncRNAs and m6A related genes and SARS-CoV-2 related genes (Figure 5B). LASSO-Cox analysis suggested that the composition of naïve CD4+ T cells was significantly correlated with the survival of the IPF patients, which could be seen as a protective factor (p < 0.01). HOOK1 expression correlated with the infiltration of naïve CD4+ T cells, showing a co-expression pattern. Therefore, the expression of HOOK1 and infiltration of naïve CD4+ T cells were combined to build a model. After the multivariate Cox regression analysis, Figure 5C, 5D plots the discrepancy between HOOK1 expression and naïve CD4+ T cell infiltration in the high-risk and low-risk groups.
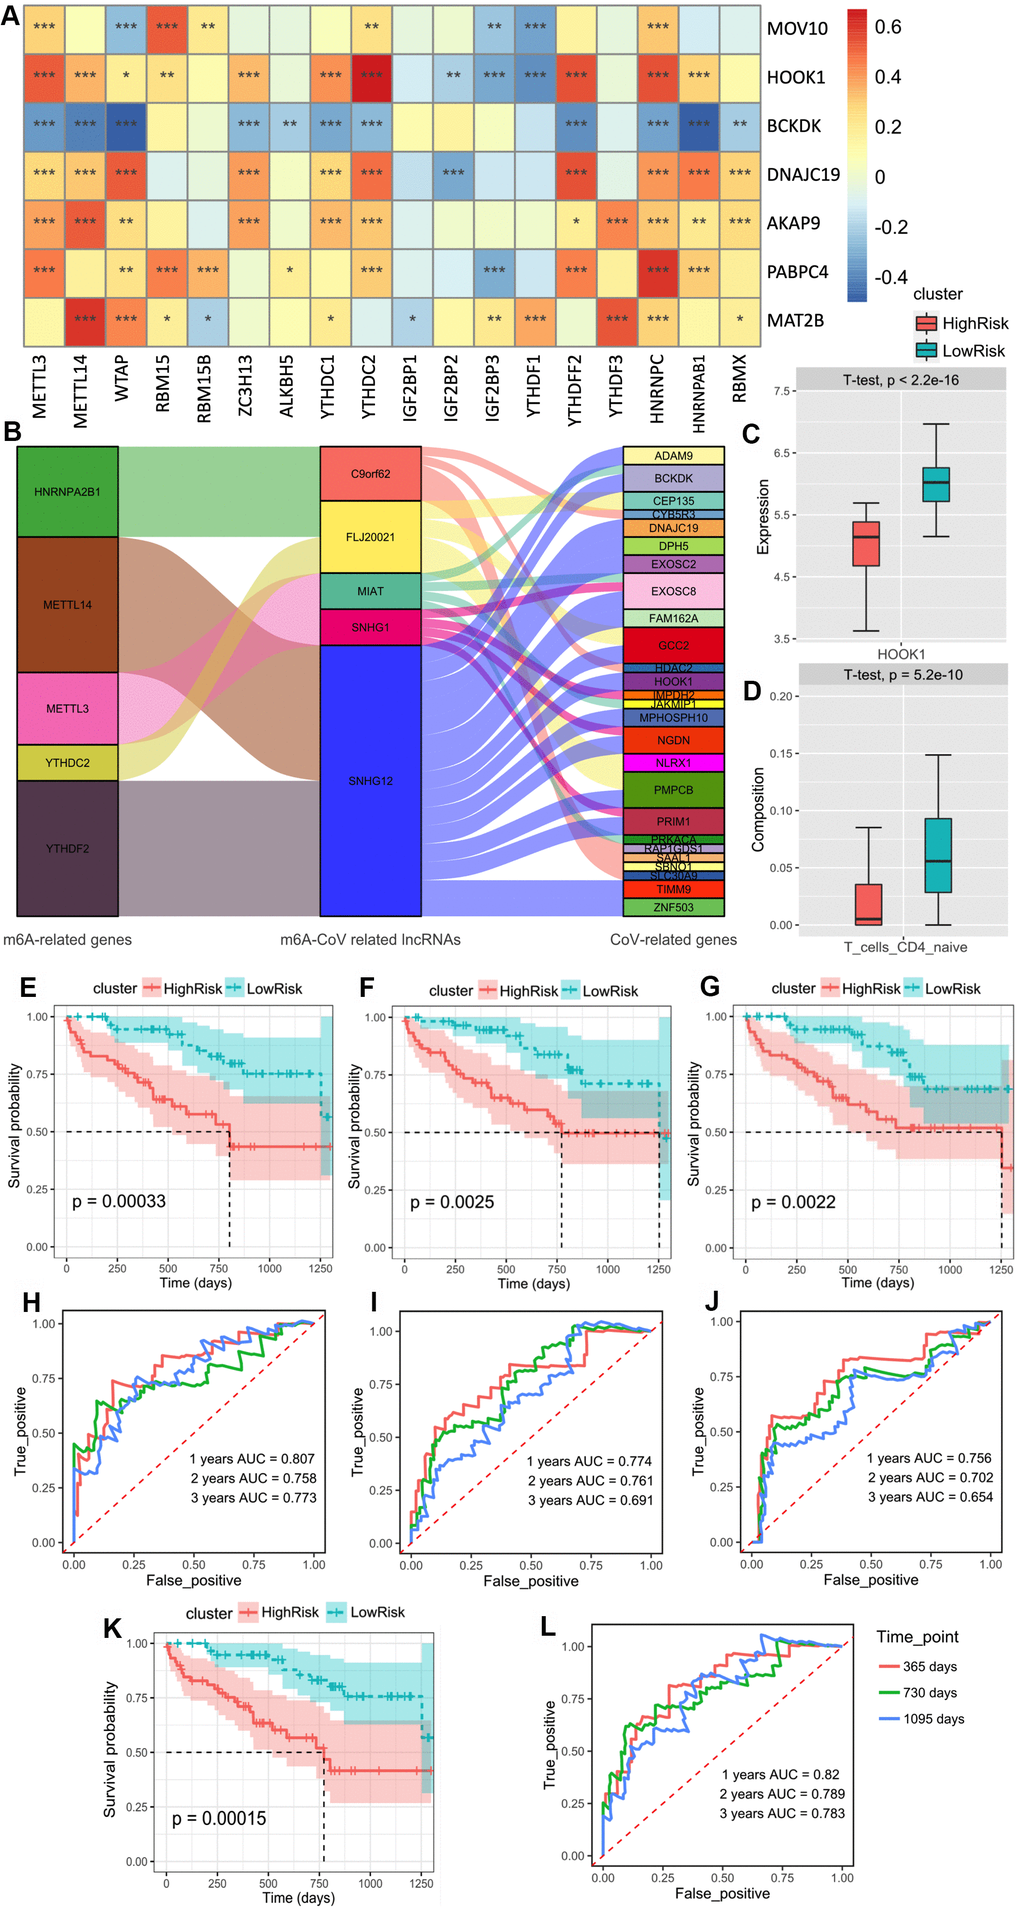
Figure 5. (A) The heatmap of the correlations between the m6A-related genes and 9 m6A-related-CoV genes in the peripheral blood mononuclear cell of IPF. (B) The alluvial diagram of the correlation between m6A-CoV related lncRNAs, m6A related genes, and SARS-COV-2 related genes. (C) The box plot of the discrepancy of the HOOK1 expression in two clusters based on the risk models of SARS-CoV-2 related immune infiltration patterns (Score 3). (D) The box plot of the discrepancy of the infiltration of the naïve CD4+ T cells in two clusters based on the risk models of SARS-CoV-2 related immune infiltration patterns (Score 3). (E) Kaplan–Meier plot of the overall survival in two clusters based on the risk models of m6A-related-CoV genes (Score 1). (F) Kaplan–Meier plot of the overall survival in two clusters based on the risk models of m6A-CoV related lncRNAs (Score 2). (G). Kaplan–Meier plot of the overall survival in two clusters based on the risk models of SARS-CoV-2 related immune infiltration patterns (Score 3). (H) The ROC curve in the risk models of m6A-related-CoV genes (Score 1). (I) The ROC curve in the risk models of m6A-CoV related lncRNAs (Score 2). (J) The ROC curve in the risk models of SARS-CoV-2 related immune infiltration patterns (Score 3). (K) Kaplan–Meier plot of the overall survival in two clusters based on the risk models of the combined Cox regression model. (L) The ROC curve in the risk models of the combined Cox regression model.
Therefore, based on the risk models of m6A-related-CoV genes (Score 1), m6A-CoV related lncRNAs (Score 2), and SARS-CoV-2 related immune infiltration patterns (Score 3), a multivariate Cox regression model was used to establish the combined model: Score-combined = 0.73795 × Score 1 + 0.09324 × Score 2 + 0.09324 × Score 3. The group survivorship curve and ROC curve of the three models and the combined model are shown in Figure 5E–5L. The group survival verifications of these three independent models and the combined model were remarkable. The AUC of the combined model within 1–3 years was greater than that of the three independent models.
Validation of the prognostic prediction of pulmonary function in IPF
Lastly, we verified the correlation between our prediction method and pulmonary function in patients with IPF. We screened five m6A-CoV related genes that were significantly related to forced vital capacity (FVC) and carbon monoxide diffusing capacity (DLCO). The correlations between the 5 m6A-CoV related genes and FVC/DLCO are plotted in Figure 6A. LARP7 and CHPF levels were significantly correlated with DLCO. LARP7 was identified as a protective gene, and CHPF was considered a dangerous gene. GRPEL1, DNAJC11, and SEPSECS were significantly correlated with FVC, which were both identified as protective genes. Based on the expression of LARP7 and CHPF, patients were divided into high and low DLCO clusters. Meanwhile, based on the expression of GRPEL1, DNAJC11, and SEPSECS, patients were divided into high FVC and low FVC groups. The discrepancies in DLCO and FVC in different clusters are plotted in Figure 6B, 6D, and the different expressions of the above-described genes in different groups are shown in Figure 6C, 6E. In addition, Table 1 summarizes the networks of m6A-SARS-CoV-2 related genes and the immune infiltration patterns of patients with IPF.
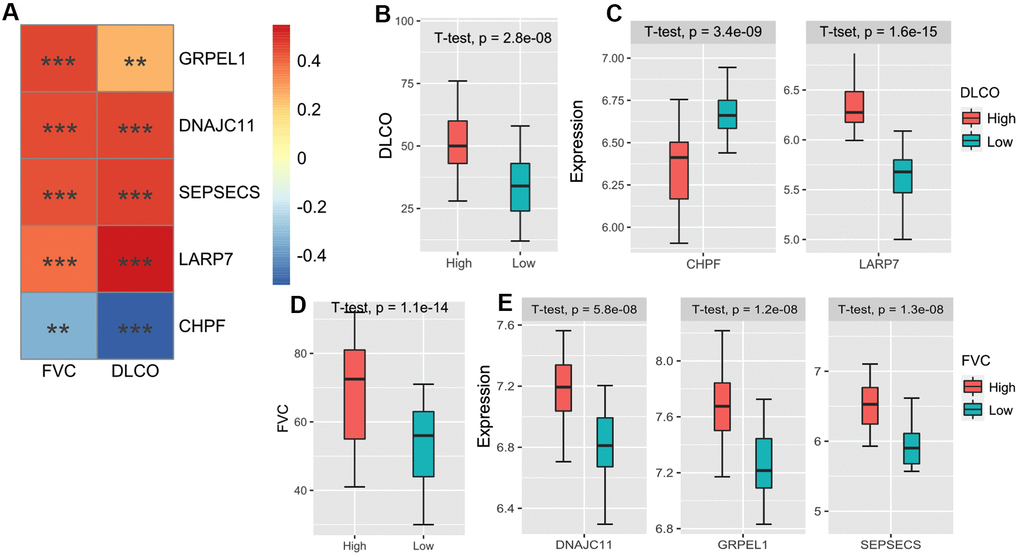
Figure 6. (A) The heatmap of the correlations between the 5 m6A-related-CoV genes and FVC/DLCO in the GSE38958 validation cohort. (B) The box plot shows the difference of the DLCO between high DLCO and low DLCO clusters. (C) The box plot shows the different expressions of LARP7 and CHPF between high DLCO and low DLCO clusters. (D) The box plot shows the difference of FVC between high FVC and low FVC clusters. (E) The box plot shows the different expressions of GRPEL1, DNAJC11, and SEPSECS between high FVC and low FVC clusters.
Table 1. The network of m6A-SARS-Cov-2 related genes and immune infiltration patterns IPF patients' different organizations.
| Series | Cell type / Tissue | IPF patients | Score1 (m6A-related CoV genes) | Score2 (m6A-CoV related lncRNAs) | Score3 (SARS-CoV-2 related immune infiltration) | Clinical information for validation |
| GSE70867 | Bronchoalveolar lavage cells | 176 | BRD4/REEP5/ATP13A3/REEP6/PPIL3/POR/MARK3/ACAD9 | MGC4859/HYMAI | NK cells/DC cells/Mast cells NINL/SLC27A2/F2RL1/FBLN5 | Survival status and time |
| GSE28221 | Peripheral blood mononuclear cells | 120 | MOV10/HOOK1/BCKDK/DNAJC19/AKAP9/PABPC4/MAT2B | SNHG1/SNHG12/MIAT/FLJ20021/C9orf62 | Naive CD4+ T cells HOOK1 | Survival status and time |
| GSE93606 | Whole blood | 56 | ZC3H7A/YIF1A/BAG5/RHOA/NUP214/INTS4/GLA/AAR2/ATP1B1 | / | γδT cells/M2 Macrophages OS9/COLGALT1/HOOK1 | Survival status and time |
| GSE38958 | Peripheral blood mononuclear cells | 60 | GRPEL1/DNAJC11/SEPSECS/LARP7/CHPF | / | / | FVC/DLCO |
Discussion
There is some overlap in the progress between COVID-19 and pulmonary fibrosis [10–12]. In addition, IPF is a risk factor for COVID-19 as IPF patients have a higher expression of some SARS-CoV-2 related genes, which may play a crucial role in SARS-CoV-2 entry, processing, and attachment [13, 14]. Considering the connections between these two diseases, researchers have identified common differentially expressed genes, pathogenic pathways, and candidate drug targets for IPF and COVID-19 [14]. Here, we identified the association between m6A methylation regulators, COVID-19 infection pathways, and immune responses in IPF.
Our results suggest that some SARS-CoV-2 related genes in IPF are broadly regulated by m6A. Increasing evidence has shown a relationship between m6A RNA modification and antiviral responses [15–17]. Among the eight m6A-SARS-CoV-2 related genes in BAL cells, BRD4 appears to be the most promising drug target for pulmonary fibrosis [18]. Emerging evidence has revealed the role of BRD4 in fibrosis and airway remodeling. It was found that BRD4 was involved in pulmonary fibrosis by downregulating signals after growth factor stimulation [19], driving TGF-β-induced NOX4 expression in human lung fibroblasts [20], and mediating NF-kappaB-dependent epithelial-mesenchymal transition of airway epithelium [21]. In COVID-19, BRD4, ubiquitous hubs commonly found in multiple tissues, is also expected to be drug targets for rescuing multiple organ injuries and dealing with inflammation [22]. As another risk gene, RHOA encodes a member of the Rho family of small GTPases, which cycles between inactive GDP-bound and active GTP-bound states and functions as a molecular switch in signal transduction cascades [23]. RHOA signaling can regulate cyclin D1 expression and activate proliferation in IPF lung fibroblasts [24]. In summary, patients with high expression levels of these risk genes should be considered. For IPF patients, more attention should be paid to prevent viral infection. For COVID-19 patients, the possible development of fibrosis should be prevented in advance.
In addition, the role of immune cells in the pathogenesis of IPF has attracted increasing attention. Our study found six types of immune cells and their co-expression patterns with SARS-CoV-2 related genes that significantly affected the prognosis of IPF. High infiltration of activated NK cells, activated mast cells, γδT cells, and M2 macrophages were risk factors, while naive CD4+T cells and resting DCs were protective factors. This suggests that the high activation state of immune cells in IPF is detrimental to patient prognosis.
NK cells play a role in blocking fibrotic liver diseases [25]; however, their role in the lung is still under debate [26]. Our study showed that activated NK cells had high infiltration in the high-risk group, which might be associated with infection and inflammation in patients. Compared with other pulmonary fibrosis diseases, more mast cells and a high level of TGF-β were found in patients with IPF [27]. Mast cells not only secrete TGF-β, a profibrotic mediator that contributes to fibroblast proliferation, but also enhances their response [28]. Moreover, mast cells and fibroblasts are closely related and may promote the development of pulmonary fibrosis through synergistic action [29–31]. Our study also suggests that activated CD4+ T cells may be a risk factor. T-helper (Th) 1 secretes IFN-γ to reduce pulmonary fibrosis, whereas Th2 cytokines IL-4, IL-5, and IL-13 stimulate fibroblast proliferation, collagen production, and fibroblast activation [32]. Th17 has a pro-fibrotic effect by promoting fibroblast proliferation and cytokine secretion in a bleomycin-induced systemic sclerosis mouse model [33]. Th9 cells, which produce IL-9, also play dual roles in pulmonary fibrosis. Overexpression of IL-9 in vivo leads to the accumulation of collagen and laminin in bronchial tubes, resulting in a pro-fibrotic effect [34]. M2 macrophages had recognized pro-fibrotic effects. The M2-type macrophage marker CCL18 was significantly increased in the serum and BAL of IPF patients, involved in the formation of fibrosis [35]; M2 macrophages can also produce TGF-β and PDGF to continuously activate fibroblasts and promote myofibroblast proliferation [36].The role of γδT cells in pulmonary fibrosis remains controversial. A recent study showed that pulmonary inflammation and fibrosis were promoted by PM2.5-induced secretion of IL-17A, which inhibits autophagy in bronchial epithelial cells [37]. In contrast, a previous study also suggested that pulmonary γδT cells seemed to play a regulatory role in suppressing fibrosis via the suppression of IL-17A production and IL-17A(+) CD4(+) T cells. The results of our study support this former viewpoint.
Therefore, high immune infiltration in the lung microenvironment is a risk factor for poor prognosis. At the same time, these immune cells may be widely associated with SARS-CoV-2 and fibrosis-related genes. The control of pulmonary inflammation has clinical significance in relieving the symptoms of IPF or COVID-19 patients.
In conclusion, we identified SARS-CoV-2 related genes associated with IPF prognosis and lung function and demonstrated that their expression was widely regulated by m6A regulators. In addition, we found some characteristic co-expression networks of immune cells and SARS-CoV-2 related genes that were thought to mediate special immune response patterns in IPF. Our research is important for further understanding the genetic and cellular links between IPF and SARS-CoV-2 infection in the context of the COVID-19 pandemic. These associations could also be beneficial for the management of IPF and COVID-19.
Materials and Methods
The general ideas and methodologies used in this study are drawn as a flow chart (Figure 7).
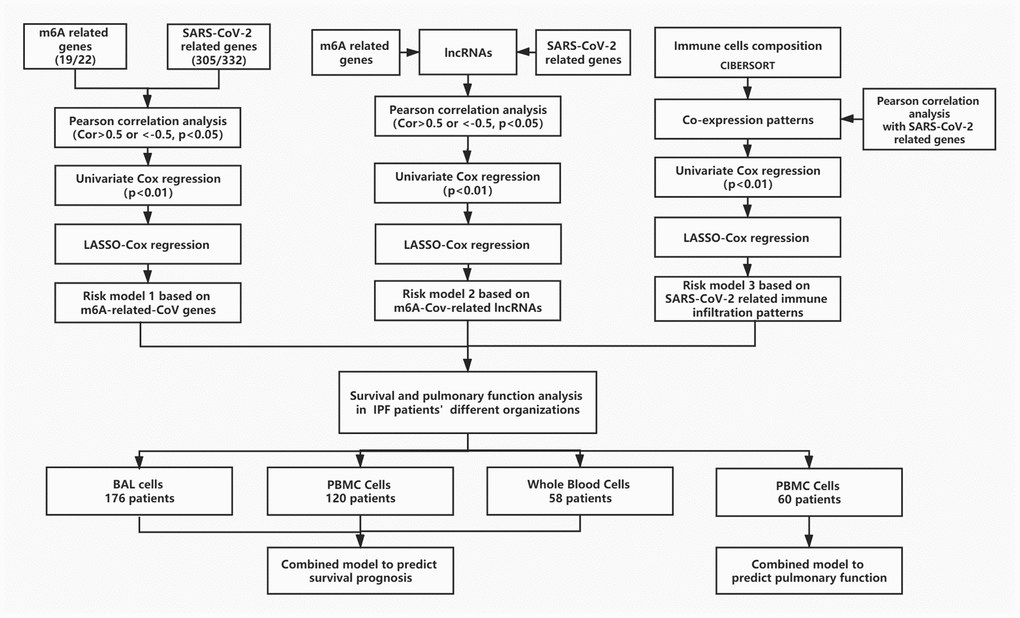
Figure 7. The flow chart of the general idea and methodologies used in this study.
Patient cohort and data preparation
The discovery cohort of the study contained 176 IPF patients from the Gene Expression Omnibus (GEO, available at: https://www.ncbi.nlm.nih.gov/geo/) database (GSE70867), including 176 IPF patients’ BAL cells. Three validation cohorts were used for the external validation (GSE93606, GSE28221, and GSE38958) to examine the predictive effect of the prediction method. The microarray data of GSE93606 included 57 patients with IPF and peripheral whole blood samples. The microarray data of GSE28221 included 120 peripheral blood mononuclear cells from patients with IPF. The microarray data of GSE38958 included 60 IPF patients’ peripheral whole blood samples. All procedures in this study complied with the protocol. For analyses of data from a public database, approval and informed consent from the local ethics committee were not required.
Identification of immune infiltration patterns in IPF
The ESTIMATE algorithm was applied to identify the degree of immune cell infiltration and to predict the immune status [39]. Furthermore, the CIBERSORT algorithm was utilized to assess the infiltration of 22 types of immune cells in IPF [40]. Only those samples with a CIBERSORT output of p < 0.05 were deemed worthy of further analysis.
Prognosis prediction model of IPF based on multiple factors
Potential prognostic factors (such as genes, lncRNAs, and cells) were screened using univariate Cox analysis, and factors with p < 0.01 were retained. The least absolute shrinkage and selection operator (LASSO) was applied to select the optimal variables, which is a type of linear regression using shrinkage [41]. Then, we created a prognosis prediction model of IPF using the selected prognostic factors.
For each patient, the formula for calculating the risk score was as follows: Score=∑i=1nCoefi*xi, where Coefi indicates that the coefficient is derived from the multivariate Cox regression, and xi is the value of each factor. According to the risk scores, the optimal cutting point was identified using the maximally selected rank method, and a prognosis prediction model of IPF was developed.
The Kaplan–Meier method was employed to examine the survival curves and compare the differences in survival across different scoring subgroups. The ROC curve of the risk score model was constructed to evaluate the impact of different factors in patients with IPF.
Analysis of differentially expressed genes and functional enrichment
The limma algorithm was used to identify differentially expressed genes (DEGs) between the two groups. Genes with an FDR adjusted p-value < 0.0001 and an absolute value of log2 (fold change) > 1 were considered immune-related DEGs.
GO analysis was used to evaluate the degree of enrichment of DEGs in biological processes, cellular components, and molecular functions. Those with p < 0.05 and count (the number of enriched genes) ≥3 were considered as the cutoff criterion. GSEA was used to determine the functional or pathway enrichment under the proportion of genes with a log2FC greater than 1 (or lower than −1) within a given gene set.
Statistical analysis
All analyses were performed with R version 4.0.2 (https://www.r-project.org/) and the corresponding packages.
Data availability
Data analyzed in this manuscript is already publicly available from the following GEO (https://www.ncbi.nlm.nih.gov/geo/) accession numbers: GSE70867, GSE93606, GSE28221, and GSE38958.
Author Contributions
Study was conceived and designed by Q.Z. Statistical analyses were performed by X.L. and C.P. Software package was prepared by Z.Z. and H.C. Manuscript was written by X.L. and C.P. X.L. and C.P. are joint first authors.
Conflicts of Interest
The authors declare that they have no conflicts of interest.
Funding
This study was supported by grants of the National Natural Science Foundation of China (81700658) and the Hunan Provincial Natural Science Foundation-Outstanding Youth Foundation (2020JJ3058).
References
- 1. Raghu G, Chen SY, Yeh WS, Maroni B, Li Q, Lee YC, Collard HR. Idiopathic pulmonary fibrosis in US medicare beneficiaries aged 65 years and older: incidence, prevalence, and survival, 2001-11. Lancet Respir Med. 2014; 2:566–72. https://doi.org/10.1016/S2213-2600(14)70101-8 [PubMed]
- 2. Zhao BS, Roundtree IA, He C. Post-transcriptional gene regulation by mRNA modifications. Nat Rev Mol Cell Biol. 2017; 18:31–42. https://doi.org/10.1038/nrm.2016.132 [PubMed]
- 3. Batista PJ, Molinie B, Wang J, Qu K, Zhang J, Li L, Bouley DM, Lujan E, Haddad B, Daneshvar K, Carter AC, Flynn RA, Zhou C, et al. m(6)A RNA modification controls cell fate transition in mammalian embryonic stem cells. Cell Stem Cell. 2014; 15:707–19. https://doi.org/10.1016/j.stem.2014.09.019 [PubMed]
- 4. Lu M, Zhang Z, Xue M, Zhao BS, Harder O, Li A, Liang X, Gao TZ, Xu Y, Zhou J, Feng Z, Niewiesk S, Peeples ME, et al. N6-methyladenosine modification enables viral RNA to escape recognition by RNA sensor RIG-I. Nat Microbiol. 2020; 5:584–98. https://doi.org/10.1038/s41564-019-0653-9 [PubMed]
- 5. Wang H, Deng Q, Lv Z, Ling Y, Hou X, Chen Z, Dinglin X, Ma S, Li D, Wu Y, Peng Y, Huang H, Chen L. N6-methyladenosine induced miR-143-3p promotes the brain metastasis of lung cancer via regulation of VASH1. Mol Cancer. 2019; 18:181. https://doi.org/10.1186/s12943-019-1108-x [PubMed]
- 6. Tu Z, Wu L, Wang P, Hu Q, Tao C, Li K, Huang K, Zhu X. N6-methylandenosine-related lncRNAs are potential biomarkers for predicting the overall survival of lower-grade glioma patients. Front Cell Dev Biol. 2020; 8:642. https://doi.org/10.3389/fcell.2020.00642 [PubMed]
- 7. Fan L, Lin Y, Lei H, Shu G, He L, Yan Z, Rihan H, Yin G. A newly defined risk signature, consisting of three m6A RNA methylation regulators, predicts the prognosis of ovarian cancer. Aging (Albany NY). 2020; 12:18453–75. https://doi.org/10.18632/aging.103811 [PubMed]
- 8. Han B, Chu C, Su X, Zhang N, Zhou L, Zhang M, Yang S, Shi L, Zhao B, Niu Y, Zhang R. N6-methyladenosine-dependent primary microRNA-126 processing activated PI3K-AKT-mTOR pathway drove the development of pulmonary fibrosis induced by nanoscale carbon black particles in rats. Nanotoxicology. 2020; 14:1–20. https://doi.org/10.1080/17435390.2019.1661041 [PubMed]
- 9. Gordon DE, Jang GM, Bouhaddou M, Xu J, Obernier K, White KM, O’Meara MJ, Rezelj VV, Guo JZ, Swaney DL, Tummino TA, Hüttenhain R, Kaake RM, et al. A SARS-CoV-2 protein interaction map reveals targets for drug repurposing. Nature. 2020; 583:459–68. https://doi.org/10.1038/s41586-020-2286-9 [PubMed]
- 10. Zhang C, Wu Z, Li JW, Tan K, Yang W, Zhao H, Wang GQ. Discharge may not be the end of treatment: Pay attention to pulmonary fibrosis caused by severe COVID-19. J Med Virol. 2021; 93:1378–86. https://doi.org/10.1002/jmv.26634 [PubMed]
- 11. George PM, Wells AU, Jenkins RG. Pulmonary fibrosis and COVID-19: the potential role for antifibrotic therapy. Lancet Respir Med. 2020; 8:807–15. https://doi.org/10.1016/S2213-2600(20)30225-3 [PubMed]
- 12. Pehote G, Vij N. Autophagy augmentation to alleviate immune response dysfunction, and resolve respiratory and COVID-19 exacerbations. Cells. 2020; 9:1952. https://doi.org/10.3390/cells9091952 [PubMed]
- 13. Maremanda KP, Sundar IK, Li D, Rahman I. Age-Dependent Assessment of Genes Involved in Cellular Senescence, Telomere, and Mitochondrial Pathways in Human Lung Tissue of Smokers, COPD, and IPF: Associations With SARS-CoV-2 COVID-19 ACE2-TMPRSS2-Furin-DPP4 Axis. Front Pharmacol. 2020; 11:58463. https://doi.org/10.3389/fphar.2020.584637 [PubMed]
- 14. Taz TA, Ahmed K, Paul BK, Kawsar M, Aktar N, Mahmud SM, Moni MA. Network-based identification genetic effect of SARS-CoV-2 infections to idiopathic pulmonary fibrosis (IPF) patients. Brief Bioinform. 2020. [Epub ahead of print]. https://doi.org/10.1093/bib/bbaa235 [PubMed]
- 15. Li HB, Tong J, Zhu S, Batista PJ, Duffy EE, Zhao J, Bailis W, Cao G, Kroehling L, Chen Y, Wang G, Broughton JP, Chen YG, et al. m6A mRNA methylation controls T cell homeostasis by targeting the IL-7/STAT5/SOCS pathways. Nature. 2017; 548:338–42. https://doi.org/10.1038/nature23450 [PubMed]
- 16. Zhang Y, Wang X, Zhang X, Wang J, Ma Y, Zhang L, Cao X. RNA-binding protein YTHDF3 suppresses interferon-dependent antiviral responses by promoting FOXO3 translation. Proc Natl Acad Sci USA. 2019; 116:976–81. https://doi.org/10.1073/pnas.1812536116 [PubMed]
- 17. Liu Y, You Y, Lu Z, Yang J, Li P, Liu L, Xu H, Niu Y, Cao X. N6-methyladenosine RNA modification-mediated cellular metabolism rewiring inhibits viral replication. Science. 2019; 365:1171–76. https://doi.org/10.1126/science.aax4468 [PubMed]
- 18. Belkina AC, Denis GV. BET domain co-regulators in obesity, inflammation and cancer. Nat Rev Cancer. 2012; 12:465–77. https://doi.org/10.1038/nrc3256 [PubMed]
- 19. Tang X, Peng R, Ren Y, Apparsundaram S, Deguzman J, Bauer CM, Hoffman AF, Hamilton S, Liang Z, Zeng H, Fuentes ME, Demartino JA, Kitson C, et al. BET bromodomain proteins mediate downstream signaling events following growth factor stimulation in human lung fibroblasts and are involved in bleomycin-induced pulmonary fibrosis. Mol Pharmacol. 2013; 83:283–93. https://doi.org/10.1124/mol.112.081661 [PubMed]
- 20. Stock CJ, Michaeloudes C, Leoni P, Durham AL, Mumby S, Wells AU, Chung KF, Adcock IM, Renzoni EA, Lindahl GE. Bromodomain and extraterminal (BET) protein inhibition restores redox balance and inhibits myofibroblast activation. Biomed Res Int. 2019; 2019:1484736. https://doi.org/10.1155/2019/1484736 [PubMed]
- 21. Tian B, Zhao Y, Sun H, Zhang Y, Yang J, Brasier AR. BRD4 mediates NF-κB-dependent epithelial-mesenchymal transition and pulmonary fibrosis via transcriptional elongation. Am J Physiol Lung Cell Mol Physiol. 2016; 311:L1183–201. https://doi.org/10.1152/ajplung.00224.2016 [PubMed]
- 22. Feng L, Yin YY, Liu CH, Xu KR, Li QR, Wu JR, Zeng R. Proteome-wide data analysis reveals tissue-specific network associated with SARS-CoV-2 infection. J Mol Cell Biol. 2020. [Epub ahead of print]. https://doi.org/10.1093/jmcb/mjaa033 [PubMed]
- 23. Pertz O, Hodgson L, Klemke RL, Hahn KM. Spatiotemporal dynamics of RhoA activity in migrating cells. Nature. 2006; 440:1069–72. https://doi.org/10.1038/nature04665 [PubMed]
- 24. Watts KL, Cottrell E, Hoban PR, Spiteri MA. RhoA signaling modulates cyclin D1 expression in human lung fibroblasts; implications for idiopathic pulmonary fibrosis. Respir Res. 2006; 7:88. https://doi.org/10.1186/1465-9921-7-88 [PubMed]
- 25. Tian Z, Chen Y, Gao B. Natural killer cells in liver disease. Hepatology. 2013; 57:1654–62. https://doi.org/10.1002/hep.26115 [PubMed]
- 26. Monnier J, Zabel BA. Anti-asialo GM1 NK cell depleting antibody does not alter the development of bleomycin induced pulmonary fibrosis. PLoS One. 2014; 9:e99350. https://doi.org/10.1371/journal.pone.0099350 [PubMed]
- 27. Cha SI, Chang CS, Kim EK, Lee JW, Matthay MA, Golden JA, Elicker BM, Jones K, Collard HR, Wolters PJ. Lung mast cell density defines a subpopulation of patients with idiopathic pulmonary fibrosis. Histopathology. 2012; 61:98–106. https://doi.org/10.1111/j.1365-2559.2012.04197.x [PubMed]
- 28. Lindstedt KA, Wang Y, Shiota N, Saarinen J, Hyytiäinen M, Kokkonen JO, Keski-Oja J, Kovanen PT. Activation of paracrine TGF-beta1 signaling upon stimulation and degranulation of rat serosal mast cells: a novel function for chymase. FASEB J. 2001; 15:1377–88. https://doi.org/10.1096/fj.00-0273com [PubMed]
- 29. Moiseeva EP, Roach KM, Leyland ML, Bradding P. CADM1 is a key receptor mediating human mast cell adhesion to human lung fibroblasts and airway smooth muscle cells. PLoS One. 2013; 8:e61579. https://doi.org/10.1371/journal.pone.0061579 [PubMed]
- 30. Wygrecka M, Dahal BK, Kosanovic D, Petersen F, Taborski B, von Gerlach S, Didiasova M, Zakrzewicz D, Preissner KT, Schermuly RT, Markart P. Mast cells and fibroblasts work in concert to aggravate pulmonary fibrosis: role of transmembrane SCF and the PAR-2/PKC-α/Raf-1/p44/42 signaling pathway. Am J Pathol. 2013; 182:2094–108. https://doi.org/10.1016/j.ajpath.2013.02.013 [PubMed]
- 31. Veerappan A, O'Connor NJ, Brazin J, Reid AC, Jung A, McGee D, Summers B, Branch-Elliman D, Stiles B, Worgall S, Kaner RJ, Silver RB. Mast cells: a pivotal role in pulmonary fibrosis. DNA Cell Biol. 2013; 32:206–18. https://doi.org/10.1089/dna.2013.2005 [PubMed]
- 32. Zhang M, Zhang S. T cells in fibrosis and fibrotic diseases. Front Immunol. 2020; 11:1142. https://doi.org/10.3389/fimmu.2020.01142 [PubMed]
- 33. Lei L, Zhao C, Qin F, He ZY, Wang X, Zhong XN. Th17 cells and IL-17 promote the skin and lung inflammation and fibrosis process in a bleomycin-induced murine model of systemic sclerosis. Clin Exp Rheumatol. 2016 (Suppl 100); 34:14–22. [PubMed]
- 34. van den Brûle S, Heymans J, Havaux X, Renauld JC, Lison D, Huaux F, Denis O. Profibrotic effect of IL-9 overexpression in a model of airway remodeling. Am J Respir Cell Mol Biol. 2007; 37:202–09. https://doi.org/10.1165/rcmb.2006-0397OC [PubMed]
- 35. Prasse A, Pechkovsky DV, Toews GB, Jungraithmayr W, Kollert F, Goldmann T, Vollmer E, Müller-Quernheim J, Zissel G. A vicious circle of alveolar macrophages and fibroblasts perpetuates pulmonary fibrosis via CCL18. Am J Respir Crit Care Med. 2006; 173:781–92. https://doi.org/10.1164/rccm.200509-1518OC [PubMed]
- 36. Zhang L, Wang Y, Wu G, Xiong W, Gu W, Wang CY. Macrophages: friend or foe in idiopathic pulmonary fibrosis? Respir Res. 2018; 19:170. https://doi.org/10.1186/s12931-018-0864-2 [PubMed]
- 37. Cong LH, Li T, Wang H, Wu YN, Wang SP, Zhao YY, Zhang GQ, Duan J. IL-17A-producing T cells exacerbate fine particulate matter-induced lung inflammation and fibrosis by inhibiting PI3K/Akt/mTOR-mediated autophagy. J Cell Mol Med. 2020; 24:8532–44. https://doi.org/10.1111/jcmm.15475 [PubMed]
- 38. Liu L, Liu X, Dong Z, Li J, Yu Y, Chen X, Ren F, Cui G, Sun R. N6-methyladenosine-related genomic targets are altered in breast cancer tissue and associated with poor survival. J Cancer. 2019; 10:5447–59. https://doi.org/10.7150/jca.35053 [PubMed]
- 39. Yoshihara K, Shahmoradgoli M, Martínez E, Vegesna R, Kim H, Torres-Garcia W, Treviño V, Shen H, Laird PW, Levine DA, Carter SL, Getz G, Stemke-Hale K, et al. Inferring tumour purity and stromal and immune cell admixture from expression data. Nat Commun. 2013; 4:2612. https://doi.org/10.1038/ncomms3612 [PubMed]
- 40. Newman AM, Liu CL, Green MR, Gentles AJ, Feng W, Xu Y, Hoang CD, Diehn M, Alizadeh AA. Robust enumeration of cell subsets from tissue expression profiles. Nat Methods. 2015; 12:453–57. https://doi.org/10.1038/nmeth.3337 [PubMed]
- 41. Liu XY, Liang Y, Xu ZB, Zhang H, Leung KS. Adaptive L1/2 shooting regularization method for survival analysis using gene expression data. ScientificWorldJournal. 2013; 2013:475702. https://doi.org/10.1155/2013/475702 [PubMed]