


Introduction
Hepatocellular carcinoma (HCC) is among the most common malignancies worldwide, and is associated with extremely high mortality with a rising trend [1]. Currently, the treatment options for patients with HCC mainly include partial hepatectomy, liver transplantation, systemic therapy, and interventional operations [2]. However, most of these treatments are limited to early-stage patients. Thus, there is a lack of effective therapies for patients in advanced stages, and this results in poor long-term outcomes for patients with HCC [3]. Moreover, clinicopathological features such as TNM staging can provide only ambiguous prognostic prediction abilities. Thus, there is an urgent need to develop an effective tool based on molecular biomarkers to identify and predict high-risk patients with HCC, who may have a poor prognosis.
The liver is a central metabolic coordinator that is specialized in regulating glucose metabolism [4]. One of the hallmarks of HCC cell metabolic aberrations is the increase in glycolysis rate with consequent lactate production, which is known as Warburg effect or aerobic glycolysis [5]. This phenomenon occurs even in the presence of mitochondria and oxygen [6]. It is widely observed that increased glycolysis is closely related to higher tumor invasion and proliferation as it provides energy to tumor cells [7]. Furthermore, interfering with metabolism of oncocytes promotes apoptosis by increasing the sensitivity to chemotherapeutic drugs, thereby suppressing tumorigenesis. This indicates that targeting glycolysis is a meaningful strategy in cancer treatment [8]. However, systematic investigation of the multiomics feature of glycolysis-associated molecules in predicting prognosis of patients with HCC is still insufficient. Therefore, exploring the relationship between glycolysis status and HCC development, and establishing a precise predictive model based on glycolysis-associated molecules, has the potential to improve personalized treatment design [9].
To address this gap in research, patients with HCC from The Cancer Genome Atlas (TCGA) were clustered into the following subgroups: Glycolysis-H, Glycolysis-M, and Glycolysis-L. Furthermore, the clinicopathological features were assessed, and their correlation with glycolysis status was investigated. We systematically explored the multiomics differences between the subgroups with respect to cancer stemness characteristics, immune infiltration states, somatic mutations, and copy number variations (CNVs). Importantly, we constructed a glycolysis-associated multiomics prognostic model and demonstrated its predictive performance.
Results
Identification of HCC phenotype based on glycolysis-associated genes
A total of 288 genes involved in glycolysis and glycolysis-related signaling pathways in KEGG were extracted (Supplementary Table 1). The expression profiles of these 288 glycolysis-associated genes were downloaded from TCGA-LIHC for hierarchical clustering analysis. According to elbow plot, 3 cluster stratification were adopted to classify patients from two independent cohort (Supplementary Figure 1). The analysis clustered the patients with HCC into three subgroups, Glycolysis-H, Glycolysis-M, and Glycolysis-L, on the basis of different expression patterns (Figure 1A, 1B). The Kaplan–Meier method was used to investigate the OS of the three glycolysis subgroups, and we observed that the subgroup Glycolysis-H combined with Glycolysis-M (Glycolysis-H+M) had worse OS than the Glycolysis-L subgroup (p < 0.001; Figure 1C).
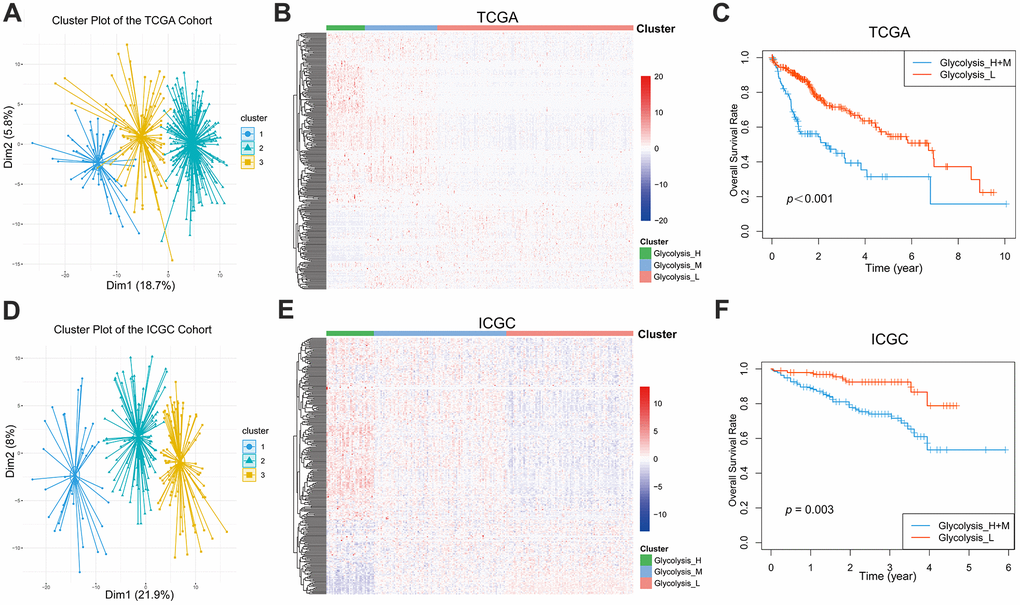
Figure 1. Glycolysis-associated genes identified distinct HCC clusters with different OS. (A, B) Three distinct clusters were generated by hierarchical clustering analysis based on the expression level of the 288 glycolysis-associated genes in the TCGA. (D, E) Three glycolysis-associated clusters were generated in the ICGC. (C, F) Kaplan-Meier survival curves of different glycolysis subtypes in the TCGA and ICGC. The Glycolysis-H+M subgroup had a worse OS than the Glycolysis-L subgroup (TCGA cohort: log-rank p<0.001; ICGC cohort: log-rank p= 0.003). HCC, hepatocellular carcinoma; OS, overall survival.
We additionally extracted and analyzed the gene expression profiles of 288 glycolysis-associated genes from the LIRI-JP dataset in ICGC. Here as well, patients with HCC could be classified into three distinct glycolysis subgroups (Figure 1D, 1E). Further, the Kaplan–Meier plot showed a significant difference (p = 0.003) in the OS between the different glycolysis subgroups in the ICGC cohort as well (Figure 1F).
Furthermore, the clinicopathological features of these three glycolysis subgroups were compared, and the results confirmed significant differences in majority of the clinicopathological characteristics (Table 1). Patients in the Glycolysis-H and Glycolysis-M subgroups were associated with increased tumor grade (p < 0.001) and T-stage (p < 0.001).
Table 1. The comparison of clinical characteristics among different glycolysis subgroups of HCC patients in TCGA (n=363).
| Clinicopathological variables | Glycolysis-H (n = 15) | Glycolysis-M (n = 93) | Glycolysis-L (n = 255) | P-value |
| Age (years) | 0.002 | |||
| < 65 | 13 (86.7) | 64 (69.6) | 136 (53.3) | |
| ≥ 65 | 2 (13.3) | 28 (30.4) | 119 (46.7) | |
| Gender | 0.014 | |||
| Male | 5 (33.3) | 65 (69.9) | 176 (69.0) | |
| Female | 10 (66.7) | 28 (30.1) | 79 (31.0) | |
| T-stage | < 0.001 | |||
| T1+T2 | 8 (53.3) | 56 (60.2) | 204 (80.6) | |
| T3+T4 | 7 (46.7) | 37 (39.8) | 49 (19.4) | |
| N-stage | 0.898 | |||
| N0 | 11 (73.3) | 62 (67.4) | 173 (67.8) | |
| N1 + NX | 4 (26.7) | 30 (32.6) | 82 (32.2) | |
| M-stage | 0.234 | |||
| M0 | 12 (80.0) | 72 (77.4) | 176 (69.0) | |
| M1 + MX | 3 (20.0) | 21 (22.6) | 79 (31.0) | |
| AJCC stage | < 0.001 | |||
| I + II | 6 (42.9) | 51 (58.6) | 194 (81.5) | |
| III + IV | 8 (57.1) | 36 (41.4) | 44 (18.5) | |
| AFP (ng/ml) | < 0.001 | |||
| < 400 | 7 (87.5) | 33 (51.6) | 168 (84.0) | |
| ≥ 400 | 1 (12.5) | 31 (48.4) | 32 (16.0) | |
| ECOG Performance Status | ||||
| 0 | 4 (44.4) | 26 (41.9) | 132 (62.0) | < 0.001 |
| 1 | 1 (11.1) | 15 (24.2) | 65 (30.5) | |
| 2 | 2 (22.2) | 11 (17.7) | 13 (6.1) | |
| 3 | 1 (11.1) | 8 (12.9) | 3 (1.4) | |
| 4 | 1 (11.1) | 2 (3.2) | 0 | |
| Family history of cancer | 0.058 | |||
| No | 12 (85.7) | 57 (72.2) | 135 (61.4) | |
| Yes | 2 (14.3) | 22 (27.8) | 85 (38.6) | |
| Grade | < 0.001 | |||
| G1-2 | 6 (42.9) | 41 (44.1) | 177 (70.5) | |
| G3-4 | 8 (57.1) | 52 (55.9) | 74 (29.5) | |
| Hepatitis C | 0.967 | |||
| No | 13 (86.7) | 80 (86.0) | 217 (86.1) | |
| Yes | 2 (13.3) | 13 (14.0) | 38 (14.9) | |
| Hepatitis B | 0.042 | |||
| No | 15 (100) | 70 (75.3) | 181 (71.0) | |
| Yes | 0 | 23 (24.6) | 74 (29.0) | |
| Surgical margin resection status | 0.002 | |||
| R0 | 12 (85.7) | 74 (80.4) | 233 (93.2) | |
| Non-R0 | 2 (14.3) | 18 (19.6) | 17 (6.8) | |
| Vascular invasion | 0.006 | |||
| None | 6 (66.7) | 36 (51.4) | 159 (69.7) | |
| Micro | 3 (33.3) | 25 (35.7) | 62 (27.2) | |
| Macro | 0 | 9 (12.9) | 7 (3.1) |
Cancer stem cell characteristics and immune infiltration evaluation in patients with different glycolysis subgroups
mRNAsi and mDNAsi are the two main indices that reflect the stemness of samples based on gene expression and epigenetic features, respectively [10]. As shown in Figure 2A, the Glycolysis-H+M subgroup had a significantly higher stemness index in mRNAsi (p < 0.01) and, a lower epigenetic level (p < 0.05). The regulatory network of stem cell index and glycolysis-associated genes showed that mRNAsi negatively regulated PFKFB3 and VCAN, while it positively regulated CENPA. Further, mDNAsi negatively regulated QSX1, GPC4, and TGFA (Supplementary Figure 2A).
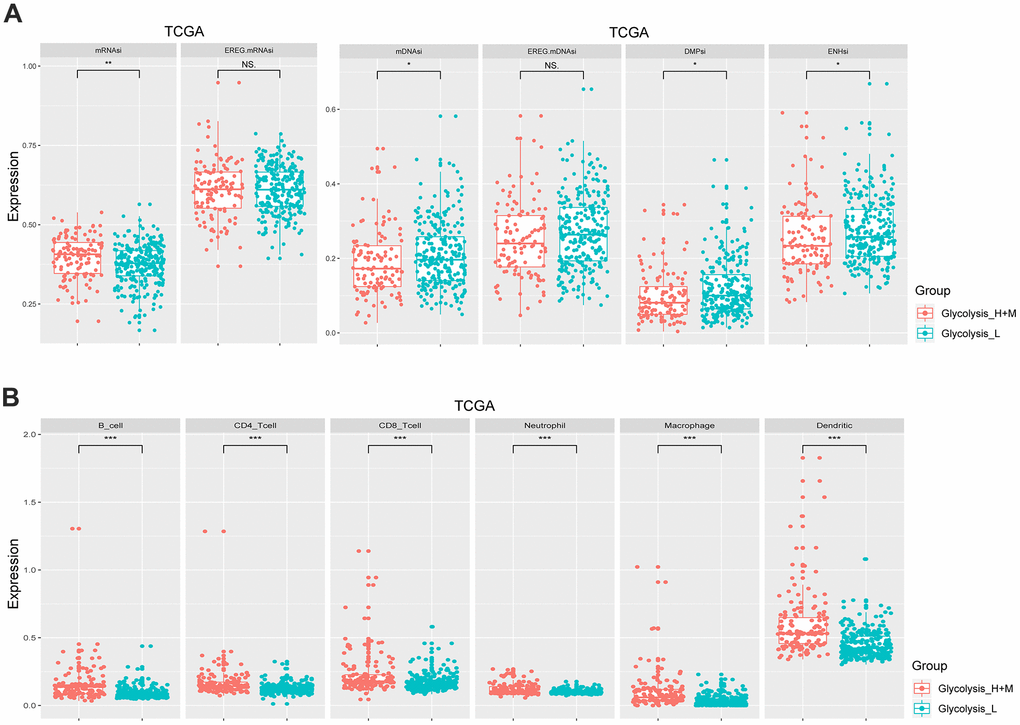
Figure 2. Different glycolysis-associated HCC subtypes varied in cancer stemness and immune infiltration. (A) Stemness indices of TCGA cohort. The Glycolysis-H+M subtype had a higher expression level of mRNAsi (p< 0.01), while the Glycolysis-L subtype had a higher expression level of mDNAsi (p< 0.05). (B) Immune cells with a significantly different proportion between Glycolysis-H+M and Glycolysis-L subgroups in the TCGA. *p< 0.05, **p< 0.01, ***p < 0.001.
The results of CIBERSORT showed significant differences in infiltrating immune cell types between the Glycolysis-H+M and Glycolysis-L subgroups including more abundant proportions of B cells, CD4+ and CD8+ T cells, neutrophils, macrophages, and dendritic cells in Glycolysis-H+M subgroup than the Glycolysis-L subgroup (p < 0.001; Figure 2B). Thus, Glycolysis-H+M subgroups showed a distinct immune infiltration pattern from Glycolysis-L subgroup. Moreover, in the regulatory network, macrophages and dendritic cells were closely related to the glycolysis-associated genes (Supplementary Figure 2B).
Analysis of multiomics in patients with distinct glycolysis-associated subgroup
We further explored the glycolysis-associated HCC subgroups through multiomics profiles. The mutation profiles of patients with HCC were investigated, and the top 30 frequently somatically mutated genes in different glycolysis subgroups are presented in Figure 3A. Higher somatic mutation frequencies of TP53 and RB1 were observed in the Glycolysis-H+M subgroup. In contrast, somatic mutations in CTNNB1 and APOB were significantly enriched in the Glycolysis-L subgroup (Figure 3A and Supplementary Figure 3).
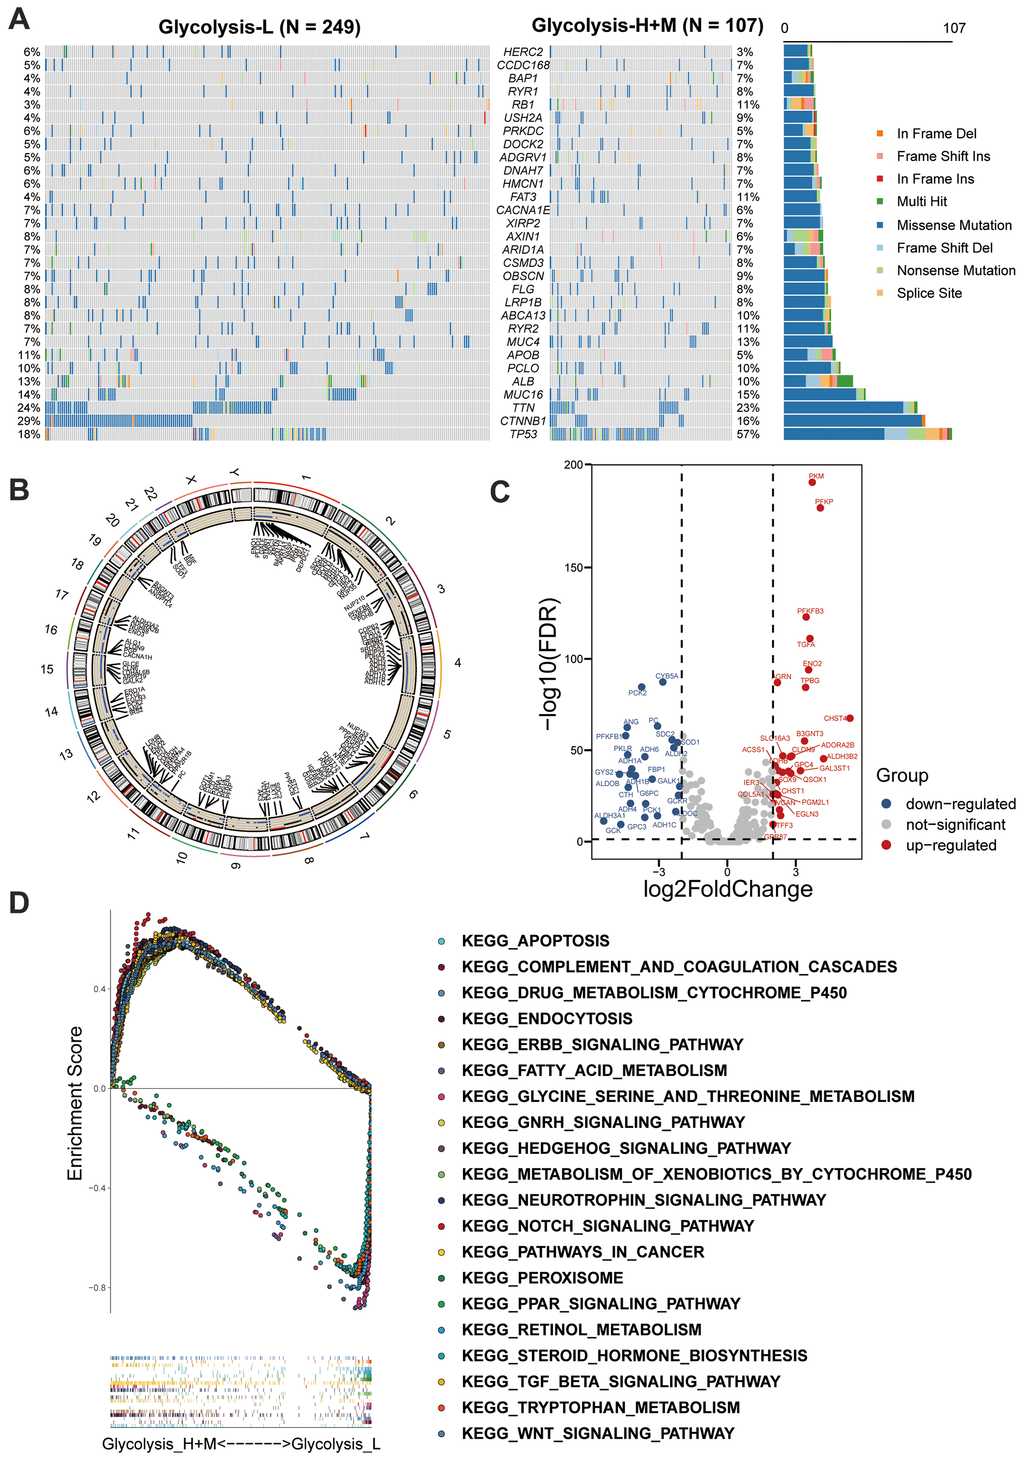
Figure 3. Multi-omics analysis among glycolysis-associated HCC subgroups. (A) The waterfall plot showed the mutation type of each patient and the proportion of mutation in each subgroup. 30 genes with the most frequent somatic mutation in HCC patients from TCGA were listed. (B) Differences in CNV profiles of the different glycolysis-associated HCC subtypes were visualized, gains of CNVs shown in black, and losses in blue. (C) Volcano plot showed the between Glycolysis-H+M subgroups and Glycolysis-L subgroup (FDR < 0.05 and |log2fold-change (FC)| > 1). (D) GSEA analysis of Glycolysis-H+M subgroups and Glycolysis-L subgroup. CNV, copy number variation; DEGs, differentially expressed genes; GSEA, Gene-set enrichment and functional enrichment analyses.
Additionally, CNVs on chromosomal level were investigated, and their differences between the three glycolysis subgroups are displayed in Figure 3B. Glycolysis-H+M subgroup had CNVs on almost all chromosomes except sex chromosomes, and chromosomes 5 and 18. As illustrated, chromosomes 2, 3, 7, 10, 12, and 17 were mainly amplified, whereas chromosomes 4, 6, 11, 14, 15, 16, 21, and 22 were dominated by deletions.
Further, Volcano plot revealed 53 significant DEGs between the Glycolysis-H+M and Glycolysis-L subgroups, in which 27 genes were upregulated and 26 genes were downregulated (Figure 3C). GSEA-based KEGG analysis was used to investigate the underlying biological mechanisms related to the glycolysis-associated subgroups. The results revealed that “Notch signaling pathway,” “Wnt signaling pathway,” and “TGFβ signaling pathway” were enriched in the Glycolysis-H+M subgroup (Figure 3D).
GSEA-based KEGG analysis and GO analysis
Intersection of 53 DEGs and 175 genes with different CNV statuses between the Glycolysis-H+M and Glycolysis-L subgroups in TCGA resulted in 36 multiomics glycolysis-associated differentially expressed genes (MOG-DEGs; Figure 4A).
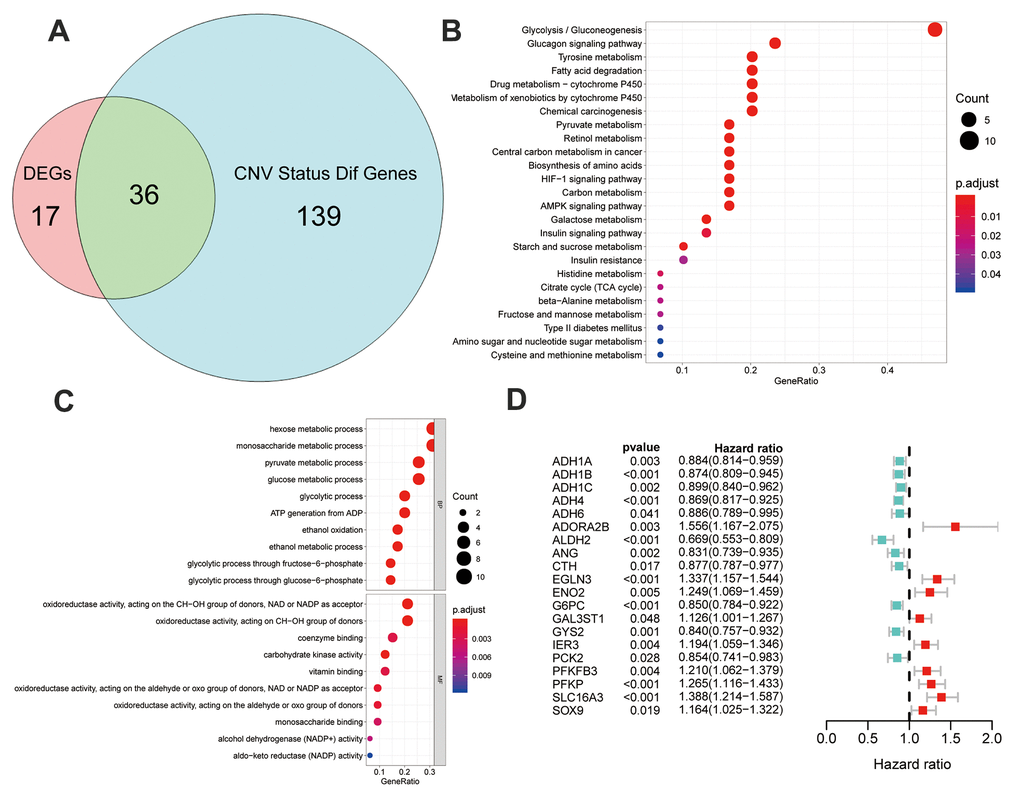
Figure 4. Identification and analysis of different status genes among glycolysis subgroups based on multi-omics data. (A) Venn diagram showed 36 overlapped genes in DEGs and genes with differently CNV status. (B) The results of gene ontology functions analysis of the 36 multi-omics based different status glycolysis genes. (C) KEGG pathways enrichment analysis of the 36 multi-omics based different status glycolysis genes. (D) 20 MOG-DEGs with a significant correlation with OS by univariable Cox analyses in the TCGA.
KEGG-based pathway enrichment analysis of these 36 MOG-DEGs showed the highest enrichment in “glycolysis,” “gluconeogenesis,” “glucagon signaling pathway,” “tyrosine metabolism,” and “fatty acid degradation” (Figure 4B). “Glucose metabolism,” “oxidoreductase activity,” and “glycolysis/gluconeogenesis” were the most enriched terms in BP, MF, and CC, respectively (Figure 4C). These results clarified that these 36 MOG-DEGs were indeed involved in glycolysis.
To further validate the prognosis predictive potential of the MOG-DEGs in the OS of the patients with HCC, a univariable Cox regression analysis showed that 20 out of 36 MOG-DEGs had significant prognostic potential (p < 0.05; Figure 4D).
Development and independent validation of GMPM
LASSO regression analysis screened out 19 MOG-DEGs with the most predictive potential from the 36 MOG-DEGs and constructed the GMPM (Figure 5A, 5B). A receiver operating characteristic curve showed that the area under the curve (AUC) of the GMPM signature in predicting the OS of patients with HCC at 1, 3, and 5 years was 0.778, 0.745, and 0.748, respectively (Figure 5C). We further investigated the coexpression levels of these 19 genes and found a weak to moderate correlation, where PCK2 was significantly positively correlated with ALDH2 and GYS2 (r > 0.7; Figure 5D, 5E).
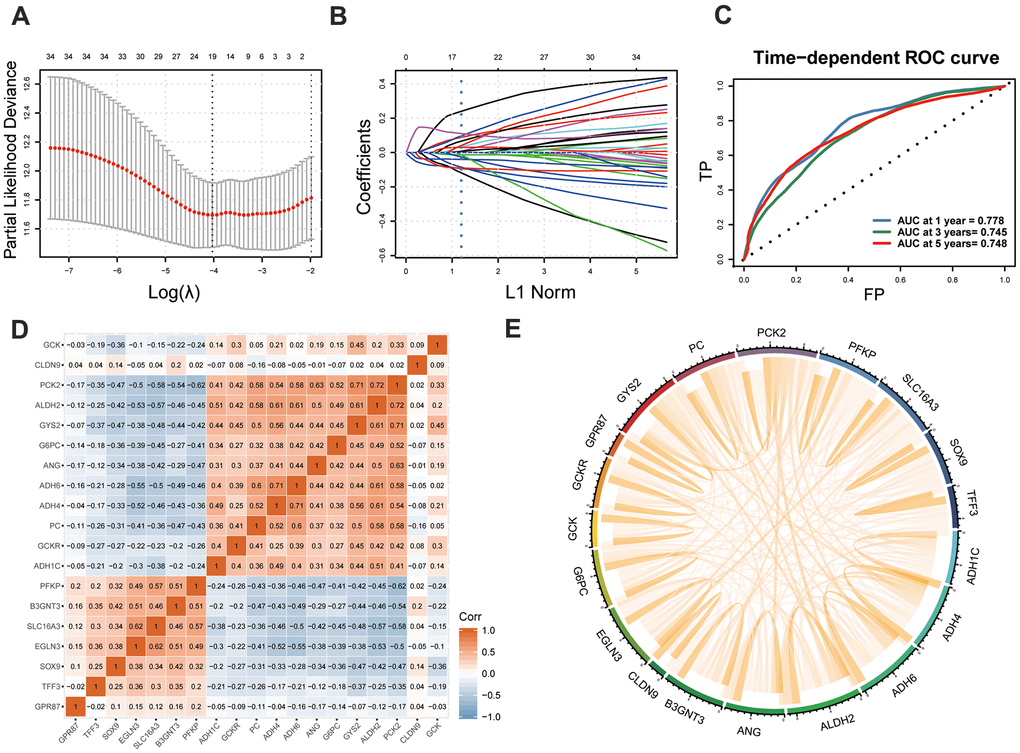
Figure 5. Development of GMPM. (A, B) LASSO regression analysis identified the 19 key MOG-DEGs in TCGA. (C) Time-dependent ROC curve analysis was performed to evaluate the diagnostic efficacy of GMPM. (D, E) The co-expression correlation between 19 key MOG-DEGs was showed. MOG-DEGs, multi-omics glycolysis-associated differentially expressed genes. ROC, receiver operating characteristic; GMPM, glycolysis-associated multi-omics prognostic model.
Using the GMPM signature and formula, the risk score of each patient in TCGA cohort was calculated. The coefficients of each gene in the GMPM are listed in Table 2. We used the median value (median = 0.28) of the risk score as the cutoff level to categorize the patients with HCC into high- and low-risk groups (Figure 6A). The relationship between the risk scores and OS was investigated, and the results indicated that patients in the high-risk group had a worse survival than those in the low-risk group (Figure 6C). The expression levels of GCKR, ADH6, PC, ADH4, ADH1C, G6PC, ANG, ALDH2, and PCK2 were downregulated and those of GCK, GPR87, GYS2, SOX9, B3GNT3, CLDN9, TFF3, EGLN3, PFKP, and SLC16A3 were upregulated in the high-risk group (Figure 6B).
Table 2. The coefficients of the risk score in GMPM.
| Gene | Coef | Gene | Coef | Gene | Coef |
| ADH1C | -0.0136 | EGLN3 | 0.117536 | PC | 0.284064 |
| ADH4 | -0.10821 | G6PC | -0.04209 | PCK2 | 0.102078 |
| ADH6 | 0.067533 | GCK | 0.105903 | PFKP | 0.149495 |
| ALDH2 | -0.18404 | GCKR | 0.031161 | SLC16A3 | 0.095468 |
| ANG | -0.00241 | GPR87 | -0.09511 | SOX9 | 0.019108 |
| B3GNT3 | -0.05977 | GYS2 | -0.12435 | TFF3 | -0.09511 |
| CLDN9 | 0.043918 |
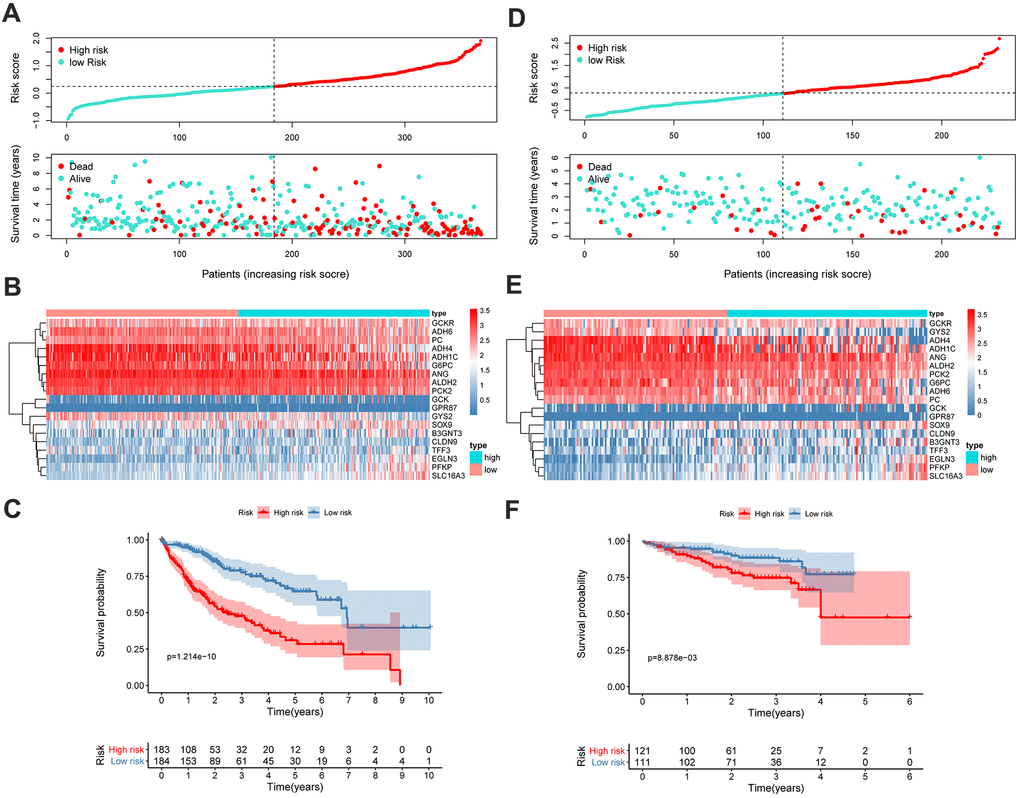
Figure 6. GMPM predicts OS in HCC patients. The distribution of survival status and risk scores in TCGA (A) and ICGC (D), respectively. The expression difference between high- and low-risk groups in TCGA (B) and ICGC (E). Kaplan-Meier survival curves to verify the predictive effect of GMPM in TCGA (C) and ICGC (F). GMPM, glycolysis-associated multi-omics prognostic model; OS, overall survival.
We further validated and confirmed the prediction capability of the GMPM signature with the ICGC cohort. Using the same formula and cutoff value as that in TCGA cohort, the LIRI-JP cohort was also stratified into high- and low-risk groups. The results of the survival plot showed a poorer survival in the high-risk group than its counterpart, which was consistent with the results from TCGA cohort (Figure 6D–6F).
GMPM risk score as an independent factor in predicting OS of patients with HCC
To investigate whether the GMPM risk score was an independent risk factor for HCC prognosis prediction, we conducted univariable and multivariable Cox regression analyses. The results of the univariable analysis showed a significant hazard ratio of tumor stage, ECOG performance status, HBV infection status, platelet count, surgical margin status in resection, cluster and riskscore in the OS of patients with HCC (p < 0.05; Figure 7A). Furthermore, multivariable analysis demonstrated that GMPM and HBV infection status was an independent predictive factor of OS in HCC (p < 0.001; Figure 7B). These results further confirmed the prognostic potential of the GMPM signature in predicting OS in patients with HCC.
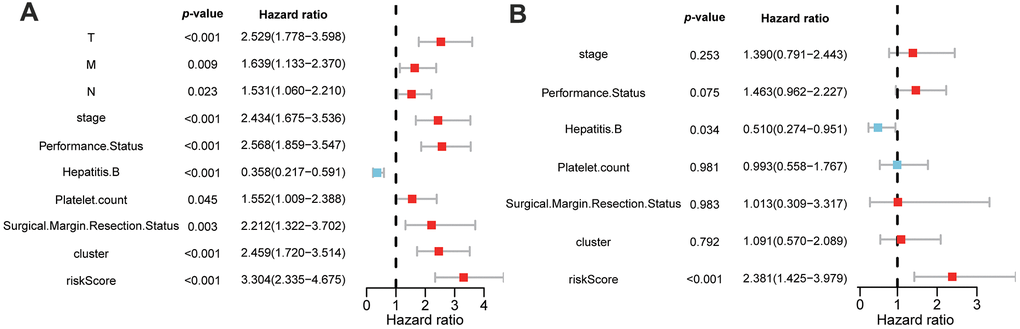
Figure 7. Univariable and multivariable Cox regression analyses of clinicopathological characteristics and GMPM for HCC patient’s prognosis. Univariable analyses of clinicopathological features and GMPM in TCGA (A). Multivariable analyses of clinicopathological features and GMPM in TCGA (B). GMPM, glycolysis-associated multi-omics prognostic model.
Discussion
In this study, we established subtype-stratification models based on multiomics glycolytic-associated gene status. We stratified patients with HCC into Glycolysis-H, Glycolysis-M, and Glycolysis-L subgroups, which were associated with different expression patterns based on glycolysis-related genes. Further, the Glycolysis-H+M subgroup presented with a significantly worse OS than its counterpart, and this result is consistent with those of previous studies [11]. Notably, the Glycolysis-H+M subgroup had a higher T-stage and pathological grade. Thus, it may be speculated that undifferentiated tumors with high T-stage may possess distinct glycolysis-associated gene expression patterns that possibly exacerbate tumor progression and promote poor prognosis.
The degree of malignancy in HCC is inevitably correlated with energy metabolism, as the liver vitally acts as the coordinator of maintaining energy metabolism homeostasis. Metabolism reprogramming is closely correlated with tumorigenesis. Our GSEA-based KEGG enrichment analysis also revealed pathways previously been identified as abnormal signaling pathways in HCC [12]. In fact, Warburg effect is characterized in many malignancies by the shift of the glycometabolic pathway from oxidative phosphorylation to aerobic glycolysis in mitochondria even with a sufficient supply of oxygen. Although this shift lowers the efficacy of ATP supply, it also reduces the dependence of tumor cells on oxygen [13]. Further, its intermediate metabolites also support the protein, lipid, and nucleic acid synthesis pathways and pentose phosphate pathway of tumors. Such metabolism also supports the rapid proliferation and metabolism of tumor cells [14]. Thus, the activity of the glycolysis pathway may be closely linked to the malignancy of tumors and further affect the survival of patients, especially in patients with HCC. In such cases, predictive models can help us understand the underlying mechanisms of HCC and improve prognosis prediction of individual patients.
To further investigate the differences among the subgroups, a multiomics analysis was carried out. Although liver cancer stem cells account for a small proportion of all tumor cell types, they maintain tumorigenic and metastatic properties of the tumor by their genetic and epigenetic factors [15, 16]. In our study, high mRNAsi index in the Glycolysis-H+M subgroup suggested that the glycolysis-related gene expression pattern with poor prognosis had higher tumor stemness, and this may have further resulted in poor patient prognosis. Stem cell characteristics acquisition strongly influences tumor progression [17], which is in accordance with the increase in mRNAsi during progression as previously described [10]. To the best of our knowledge, this study is the first to analyze the correlation between stemness characteristics of cancer and glycolysis-related gene expression.
Tumor microenvironment (TME) contributes largely to the development of tumor heterogeneity and the development of tumors [18]. In the TME, immune infiltration patterns are valuable for prognostic assessment in HCC [19]. The interdependent relationship between tumor metabolism and immune infiltration has been reported in previous studies as well [20]. Our results showed significantly elevated B cells, CD4+ and CD8+ T cells, neutrophils, macrophages, and dendritic cells in the Glycolysis-H+M subgroup than in Glycolysis-L subgroup; this indicates that the immune patterns tend to be closely related to the glycolytic state of a tumor. This result was consistent with previous reports [21], suggesting that these subgroups of glycolysis could be used to preliminarily evaluate the immune characteristics of cancer. Furthermore, the use of immunotherapy in the Glycolysis-H+M subgroup may be more effective.
In addition, investigation of the somatic mutation landscape among the glycolysis subgroups revealed significantly higher TP53 and RB1 mutational burdens in the Glycolysis-H+M subgroup. TP53 and RB1 are believed to be tumor-suppressor genes in multiple tumors [22, 23]. In fact, TP53 has the highest mutation frequency in HCC, and its functional loss enables survival of DNA-damaged cells and escape of apoptosis, thereby affecting the progression of HCC patients [22]. Moreover, RB1 is a known tumor-suppressor gene [24], and the loss of RB1 is the main mechanism of acquired resistance in HCC [23].
In recent years, glycolysis-related genes have caused widespread concern for its association with tumors. Jiang et al. first identified and validated a six-mRNA glycolysis-related signature for predicting outcomes for patients with HCC [21]. However, they only analyzed gene expression profiles in their study. To make our prediction model more robust, we conducted a multiomics analysis for glycolysis-related genes, and included CNVs, gene mutations, and gene expression levels to build a novel, glycolysis-associated predictive model for HCC. Consequently, our GMPM had a stable and steady prediction accuracy at 1-, 3-, and 5-years with AUC values above 0.745 for all. Thus, this model may provide a more efficient way of screening high-risk patients with HCC associated with poor prognosis. Further, the genes included in the GMPM have been correlated with tumorigenesis and aggressiveness of HCC. For instance, ANG plays a critical role in angiogenesis in HCC, and is involved in the regulation of immune response [25]. CLDN9 is an HCC proto-oncogene that increases the invasiveness and migration capability of cancer cells by affecting the STAT3 signaling pathway [26]. G6PC is a hepatocyte terminal differentiation marker, and Yan et al. demonstrated that the overexpression of GPR87 could upregulate CD133 expression to promote tumor initiation [27]. High expression of SOX9 is closely related to the poor prognosis in patients with HCC [28]. Elevated expression of TFF3 has been found in HCC, and it is associated with poor patient survival outcomes and clinical features [29]. ADH is known to be repressed in the HepG2 human hepatoma cell line [30]. Furthermore, some genes were associated with glucose metabolism as well. GCK plays a vital role in liver and pancreatic beta cells to regulate glucose distribution and synthesis, and its activity is competitively inhibited by GCKR [31]. Chen et al. found significant downregulation of GYS2 through the HBx/GYS2/p53 pathway in HCC, which results in the deregulation of glycogen metabolism [32]. PCK is a protein in the hepatic gluconeogenesis pathway whose low expression is associated with poor prognosis in patients with HCC [33]. Thus, our strategy screened out glycolysis-related gene panels with robust prognosis predictive ability, and may guide the investigation of underlying mechanisms in glycolysis-associated HCC tumorigenesis. Although this study provides a new perspective of glycolysis-related genes in molecular subtyping and prognostic prediction of HCC based on integrative multiomics analyses, its limitations must be acknowledged. First, the prognostic value of our risk stratification model needs to be validated in more patients with HCC with multicentered data to further increase its credibility. Second, the molecular understanding of glycolysis-associated genes used in the risk stratification model needs further investigation with functional experiments to unravel the role of glycolysis in HCC.
Conclusions
To conclude, by stratifying the patients with HCC with glycolysis-associated genes, we identified different prognostic, clinical, and immune features between patients with different glycolysis patterns. Consequently, we used this novel approach to identify key glycolysis-related genes by developing a GMPM, which presented as an independent risk factor with robust prognostic predictive ability for HCC. Taken together, this study provides a guide for the clinical management of patients with HCC, and genes related to our model may provide promising targets for HCC treatment.
Materials and Methods
Data acquisition and preprocessing
Transcriptome profiles, masked somatic mutation data, CNV files, and clinicopathological information of 374 patients with HCC were acquired from TCGA-liver hepatocellular carcinoma (LIHC) program in TCGA (https://portal.gdc.cancer.gov/). Additionally, we obtained gene expression files and clinicopathological data of 232 patients with HCC from the LIRI-JP project in the International Cancer Genomics Consortium (ICGC; https://icgc.org/) database. The gene expression data were normalized and log2-transformed for subsequent analyses. The samples that lacked important clinicopathological or survival information were excluded from further analyses.
Clustering analysis of glycolysis-associated genes
Genes involved in glycolysis and glycolysis-related signaling pathways were downloaded via the Kyoto Encyclopedia of Genes and Genomes (KEGG) from Gene Set Enrichment Analysis (GSEA; http://software.broadinstitute.org/gsea/index.jsp). Based on the expression levels of the glycolysis-associated genes, patients with HCC from TCGA and ICGC were stratified into different subgroups using hierarchical clustering analysis. Furthermore, Kaplan-Meier method was employed to analyze and compare the overall survival (OS) in the different glycolysis-associated subgroups.
Evaluation of cancer stem cells characteristics
To calculate the mRNA expression and DNA methylation status-based stemness indices of the samples, a predictive model, previously reported by one-class logistic regression (OCLR), was adopted. OCLR was calculated using pluripotent stem cell samples from the Progenitor Cell Biology Consortium dataset [10]. The stemness indices ranged from low (zero) to high (one) to scale the stemness features of the samples. The differences in stemness indices between different glycolysis subgroups were analyzed using Wilcoxon rank-sum test. Further, we conducted a correlation analysis between the expression levels of the glycolysis-associated genes and stemness indices. Genes with an absolute value of correlation coefficient r > 0.4 and p < 0.001 were plotted using Cytoscape [34] (Version:3.8.1, https://cytoscape.org/).
Analysis of immune infiltration
CIBERSORT algorithm was used to calculate the relative abundance of 22 immune cell types according to a previously reported procedure [35]. The proportion of each immune cell was evaluated and compared across the groups using Wilcoxon rank-sum test. Similarly, we conducted a correlation analysis between the glycolysis-associated gene expression levels and immune cell abundance. The correlations with |r| > 0.4 and p < 0.001 were plotted using Cytoscape.
Multiomics analysis of different glycolysis-associated subgroups
Mutation data of patients with HCC from TCGA were analyzed and visualized using maftools package in R software [36]. Genes with the highest tumor mutation frequencies and their percentages in different glycolysis-associated subgroups were displayed using a waterfall plot. Chi-square test was employed to screen significantly different CNVs (adjusted p < 0.05) among the different glycolysis-associated subgroups.
Using RNA-sequencing data of patients with HCC in TCGA, we compared the expression level of each gene among the different glycolysis-associated subgroups using the limma R package [37]. A false discovery rate (FDR) < 0.05 and |log2fold change (FC) |> 1 was set as the threshold to identify differentially expressed genes (DEGs). GSEA was carried out to identify significantly upregulated and downregulated KEGG pathways among the glycolysis subgroups with an FDR < 0.05 [38, 39].
Identification and analysis of different CNV status genes among glycolysis subgroups based on multiomics data
Genes with different expression levels and CNV statuses were obtained by taking the intersection of the DEGs and genes with different CNV statuses among the different glycolysis-associated subgroups. These genes were subjected to gene ontology (GO) and pathway analyses. For the GO analysis, we identified enriched terms related to biological processes (BP), molecular functions (MF), and cell components (CC). Terms with FDR < 0.05 in GO and pathway analyses were visualized [40]. Furthermore, we conducted a univariable Cox regression analysis to evaluate the correlation of the expression levels of these genes and OS of the patients with HCC.
Construction and validation of a glycolysis-associated prognostic model
A least absolute shrinkage and selection operator (LASSO) regression model was used to extract key glycolysis-associated genes based on the DEGs and CNV statuses to construct a glycolysis-associated multiomics prognostic model (GMPM) using glmnet R package [41]. Next, the risk score of each patient with HCC in TCGA and ICGC was calculated by adding the multiplication of each glycolysis-associated gene expression level with its corresponding regression coefficients. Correlation analysis between key glycolysis-associated genes was further conducted.
Using the median value of the GMPM risk score in TCGA as the cutoff value, patients with HCC (in both TCGA and ICGC cohorts) were stratified into high- and low-risk subgroups, separately. The OS of patients was calculated and compared using the Kaplan-Meier method, and the heatmap of genes used in the GMPM was plotted. Finally, univariable and multivariable Cox regression analyses were conducted to identify independent prognostic predictors associated with the OS of patients with HCC in TCGA.
Author Contributions
Conception and design: Y.W. and G.C.; collection and assembly of data: C.J., K.C, J.Y., Z.C., and M.W.; data analysis and interpretation: X.Y., T.D., and Q.Y.; funding acquisition, Y.W., and G.C. Manuscript writing: all authors; final approval of manuscript: all authors.
Acknowledgments
The results shown here are in whole or part based upon data generated by the TCGA Research Network (https://www.cancer.gov/tcga), as well as ICGC (https://daco.icgc.org/).
Conflicts of Interest
The authors have no conflicts of interest to declare.
Funding
This study was supported by the Natural Science Foundation of Zhejiang Province, Grant/Award Number: LY17H160047; Public Projects of Zhejiang Province, Grant/Award Numbers: 2016C37127, 2018C37114; National Natural Science Foundation of China, Grant/Award Numbers: 81772628, 81703310, 82072685. the Research Foundation of the National Health Commission of China- Major Medical and Health Technology Project for Zhejiang Province (WKJ-ZJ-1706).
References
- 1. Siegel RL, Miller KD, Jemal A. Cancer statistics, 2020. CA Cancer J Clin. 2020; 70:7–30. https://doi.org/10.3322/caac.21590 [PubMed]
- 2. Hua S, Liu C, Liu L, Wu D. miR-142-3p inhibits aerobic glycolysis and cell proliferation in hepatocellular carcinoma via targeting LDHA. Biochem Biophys Res Commun. 2018; 496:947–54. https://doi.org/10.1016/j.bbrc.2018.01.112 [PubMed]
- 3. Forner A, Reig M, Bruix J. Hepatocellular carcinoma. Lancet. 2018; 391:1301–14. https://doi.org/10.1016/S0140-6736(18)30010-2 [PubMed]
- 4. Ferrarini A, Di Poto C, He S, Tu C, Varghese RS, Kara Balla A, Jayatilake M, Li Z, Ghaffari K, Fan Z, Sherif ZA, Kumar D, Kroemer A, et al. Metabolomic analysis of liver tissues for characterization of hepatocellular carcinoma. J Proteome Res. 2019; 18:3067–76. https://doi.org/10.1021/acs.jproteome.9b00185 [PubMed]
- 5. Liberti MV, Locasale JW. The warburg effect: how does it benefit cancer cells? Trends Biochem Sci. 2016; 41:211–18. https://doi.org/10.1016/j.tibs.2015.12.001 [PubMed]
- 6. DeBerardinis RJ, Chandel NS. Fundamentals of cancer metabolism. Sci Adv. 2016; 2:e1600200. https://doi.org/10.1126/sciadv.1600200 [PubMed]
- 7. Kitamura K, Hatano E, Higashi T, Narita M, Seo S, Nakamoto Y, Yamanaka K, Nagata H, Taura K, Yasuchika K, Nitta T, Uemoto S. Proliferative activity in hepatocellular carcinoma is closely correlated with glucose metabolism but not angiogenesis. J Hepatol. 2011; 55:846–57. https://doi.org/10.1016/j.jhep.2011.01.038 [PubMed]
- 8. Hay N. Reprogramming glucose metabolism in cancer: can it be exploited for cancer therapy? Nat Rev Cancer. 2016; 16:635–49. https://doi.org/10.1038/nrc.2016.77 [PubMed]
- 9. Noh SH, Park SR, Yang HK, Chung HC, Chung IJ, Kim SW, Kim HH, Choi JH, Kim HK, Yu W, Lee JI, Shin DB, Ji J, et al, and CLASSIC trial investigators. Adjuvant capecitabine plus oxaliplatin for gastric cancer after D2 gastrectomy (CLASSIC): 5-year follow-up of an open-label, randomised phase 3 trial. Lancet Oncol. 2014; 15:1389–96. https://doi.org/10.1016/S1470-2045(14)70473-5 [PubMed]
- 10. Malta TM, Sokolov A, Gentles AJ, Burzykowski T, Poisson L, Weinstein JN, Kamińska B, Huelsken J, Omberg L, Gevaert O, Colaprico A, Czerwińska P, Mazurek S, et al, and Cancer Genome Atlas Research Network. Machine learning identifies stemness features associated with oncogenic dedifferentiation. Cell. 2018; 173:338–54.e15. https://doi.org/10.1016/j.cell.2018.03.034 [PubMed]
- 11. Ma R, Zhang W, Tang K, Zhang H, Zhang Y, Li D, Li Y, Xu P, Luo S, Cai W, Ji T, Katirai F, Ye D, Huang B. Switch of glycolysis to gluconeogenesis by dexamethasone for treatment of hepatocarcinoma. Nat Commun. 2013; 4:2508. https://doi.org/10.1038/ncomms3508 [PubMed]
- 12. Khemlina G, Ikeda S, Kurzrock R. The biology of hepatocellular carcinoma: implications for genomic and immune therapies. Mol Cancer. 2017; 16:149. https://doi.org/10.1186/s12943-017-0712-x [PubMed]
- 13. Abaza M, Luqmani YA. The influence of pH and hypoxia on tumor metastasis. Expert Rev Anticancer Ther. 2013; 13:1229–42. https://doi.org/10.1586/14737140.2013.843455 [PubMed]
- 14. Feng Y, Zhang Y, Cai Y, Liu R, Lu M, Li T, Fu Y, Guo M, Huang H, Ou Y, Chen Y. A20 targets PFKL and glycolysis to inhibit the progression of hepatocellular carcinoma. Cell Death Dis. 2020; 11:89. https://doi.org/10.1038/s41419-020-2278-6 [PubMed]
- 15. Lu H, Ju DD, Yang GD, Zhu LY, Yang XM, Li J, Song WW, Wang JH, Zhang CC, Zhang ZG, Zhang R. Targeting cancer stem cell signature gene SMOC-2 overcomes chemoresistance and inhibits cell proliferation of endometrial carcinoma. EBioMedicine. 2019; 40:276–89. https://doi.org/10.1016/j.ebiom.2018.12.044 [PubMed]
- 16. Zhu YJ, Zheng B, Luo GJ, Ma XK, Lu XY, Lin XM, Yang S, Zhao Q, Wu T, Li ZX, Liu XL, Wu R, Liu JF, et al. Circular RNAs negatively regulate cancer stem cells by physically binding FMRP against CCAR1 complex in hepatocellular carcinoma. Theranostics. 2019; 9:3526–40. https://doi.org/10.7150/thno.32796 [PubMed]
- 17. Chang JC. Cancer stem cells: role in tumor growth, recurrence, metastasis, and treatment resistance. Medicine (Baltimore). 2016; 95:S20–25. https://doi.org/10.1097/MD.0000000000004766 [PubMed]
- 18. Reina-Campos M, Moscat J, Diaz-Meco M. Metabolism shapes the tumor microenvironment. Curr Opin Cell Biol. 2017; 48:47–53. https://doi.org/10.1016/j.ceb.2017.05.006 [PubMed]
- 19. Sang X, Wu F, Wu D, Lin S, Li J, Zhao N, Chen X, Xu A. Human hepatic cancer stem cells (HCSCs) markers correlated with immune infiltrates reveal prognostic significance of hepatocellular carcinoma. Front Genet. 2020; 11:112. https://doi.org/10.3389/fgene.2020.00112 [PubMed]
- 20. Chang CH, Qiu J, O’Sullivan D, Buck MD, Noguchi T, Curtis JD, Chen Q, Gindin M, Gubin MM, van der Windt GJ, Tonc E, Schreiber RD, Pearce EJ, Pearce EL. Metabolic competition in the tumor microenvironment is a driver of cancer progression. Cell. 2015; 162:1229–41. https://doi.org/10.1016/j.cell.2015.08.016 [PubMed]
- 21. Jiang Z, Liu Z, Li M, Chen C, Wang X. Increased glycolysis correlates with elevated immune activity in tumor immune microenvironment. EBioMedicine. 2019; 42:431–42. https://doi.org/10.1016/j.ebiom.2019.03.068 [PubMed]
- 22. Long J, Wang A, Bai Y, Lin J, Yang X, Wang D, Yang X, Jiang Y, Zhao H. Development and validation of a TP53-associated immune prognostic model for hepatocellular carcinoma. EBioMedicine. 2019; 42:363–74. https://doi.org/10.1016/j.ebiom.2019.03.022 [PubMed]
- 23. Bollard J, Miguela V, Ruiz de Galarreta M, Venkatesh A, Bian CB, Roberto MP, Tovar V, Sia D, Molina-Sánchez P, Nguyen CB, Nakagawa S, Llovet JM, Hoshida Y, Lujambio A. Palbociclib (PD-0332991), a selective CDK4/6 inhibitor, restricts tumour growth in preclinical models of hepatocellular carcinoma. Gut. 2017; 66:1286–96. https://doi.org/10.1136/gutjnl-2016-312268 [PubMed]
- 24. Tang J, Xie Y, Xu X, Yin Y, Jiang R, Deng L, Tan Z, Gangarapu V, Tang J, Sun B. Bidirectional transcription of Linc00441 and RB1 via H3K27 modification-dependent way promotes hepatocellular carcinoma. Cell Death Dis. 2017; 8:e2675. https://doi.org/10.1038/cddis.2017.81 [PubMed]
- 25. Pestana RC, Hassan MM, Abdel-Wahab R, Abugabal YI, Girard LM, Li D, Chang P, Raghav K, Morris J, Wolff RA, Rashid A, Amin HM, Kaseb A. Clinical and prognostic significance of circulating levels of angiopoietin-1 and angiopoietin-2 in hepatocellular carcinoma. Oncotarget. 2018; 9:37721–32. https://doi.org/10.18632/oncotarget.26507 [PubMed]
- 26. Liu H, Wang M, Liang N, Guan L. Claudin-9 enhances the metastatic potential of hepatocytes via Tyk2/Stat3 signaling. Turk J Gastroenterol. 2019; 30:722–31. https://doi.org/10.5152/tjg.2019.18513 [PubMed]
- 27. Yan M, Li H, Zhu M, Zhao F, Zhang L, Chen T, Jiang G, Xie H, Cui Y, Yao M, Li J. G protein-coupled receptor 87 (GPR87) promotes the growth and metastasis of CD133+ cancer stem-like cells in hepatocellular carcinoma. PLoS One. 2013; 8:e61056. https://doi.org/10.1371/journal.pone.0061056 [PubMed]
- 28. Richtig G, Aigelsreiter A, Schwarzenbacher D, Ress AL, Adiprasito JB, Stiegelbauer V, Hoefler G, Schauer S, Kiesslich T, Kornprat P, Winder T, Eisner F, Gerger A, et al. SOX9 is a proliferation and stem cell factor in hepatocellular carcinoma and possess widespread prognostic significance in different cancer types. PLoS One. 2017; 12:e0187814. https://doi.org/10.1371/journal.pone.0187814 [PubMed]
- 29. You ML, Chen YJ, Chong QY, Wu MM, Pandey V, Chen RM, Liu L, Ma L, Wu ZS, Zhu T, Lobie PE. Trefoil factor 3 mediation of oncogenicity and chemoresistance in hepatocellular carcinoma is AKT-BCL-2 dependent. Oncotarget. 2017; 8:39323–44. https://doi.org/10.18632/oncotarget.16950 [PubMed]
- 30. Dannenberg LO, Chen HJ, Tian H, Edenberg HJ. Differential regulation of the alcohol dehydrogenase 1B (ADH1B) and ADH1C genes by DNA methylation and histone deacetylation. Alcohol Clin Exp Res. 2006; 30:928–37. https://doi.org/10.1111/j.1530-0277.2006.00107.x [PubMed]
- 31. Da Silva MS, Chartrand D, Vohl MC, Barbier O, Rudkowska I. Dairy product consumption interacts with glucokinase (GCK) gene polymorphisms associated with insulin resistance. J Pers Med. 2017; 7:8. https://doi.org/10.3390/jpm7030008 [PubMed]
- 32. Chen SL, Zhang CZ, Liu LL, Lu SX, Pan YH, Wang CH, He YF, Lin CS, Yang X, Xie D, Yun JP. A GYS2/p53 negative feedback loop restricts tumor growth in HBV-related hepatocellular carcinoma. Cancer Res. 2019; 79:534–45. https://doi.org/10.1158/0008-5472.CAN-18-2357 [PubMed]
- 33. Liu MX, Jin L, Sun SJ, Liu P, Feng X, Cheng ZL, Liu WR, Guan KL, Shi YH, Yuan HX, Xiong Y. Metabolic reprogramming by PCK1 promotes TCA cataplerosis, oxidative stress and apoptosis in liver cancer cells and suppresses hepatocellular carcinoma. Oncogene. 2018; 37:1637–53. https://doi.org/10.1038/s41388-017-0070-6 [PubMed]
- 34. Shannon P, Markiel A, Ozier O, Baliga NS, Wang JT, Ramage D, Amin N, Schwikowski B, Ideker T. Cytoscape: a software environment for integrated models of biomolecular interaction networks. Genome Res. 2003; 13:2498–504. https://doi.org/10.1101/gr.1239303 [PubMed]
- 35. Newman AM, Liu CL, Green MR, Gentles AJ, Feng W, Xu Y, Hoang CD, Diehn M, Alizadeh AA. Robust enumeration of cell subsets from tissue expression profiles. Nat Methods. 2015; 12:453–57. https://doi.org/10.1038/nmeth.3337 [PubMed]
- 36. Mayakonda A, Lin DC, Assenov Y, Plass C, Koeffler HP. Maftools: efficient and comprehensive analysis of somatic variants in cancer. Genome Res. 2018; 28:1747–56. https://doi.org/10.1101/gr.239244.118 [PubMed]
- 37. Ritchie ME, Phipson B, Wu D, Hu Y, Law CW, Shi W, Smyth GK. Limma powers differential expression analyses for RNA-sequencing and microarray studies. Nucleic Acids Res. 2015; 43:e47. https://doi.org/10.1093/nar/gkv007 [PubMed]
- 38. Subramanian A, Tamayo P, Mootha VK, Mukherjee S, Ebert BL, Gillette MA, Paulovich A, Pomeroy SL, Golub TR, Lander ES, Mesirov JP. Gene set enrichment analysis: a knowledge-based approach for interpreting genome-wide expression profiles. Proc Natl Acad Sci USA. 2005; 102:15545–50. https://doi.org/10.1073/pnas.0506580102 [PubMed]
- 39. Yu G, Wang LG, Han Y, He QY. clusterProfiler: an R package for comparing biological themes among gene clusters. OMICS. 2012; 16:284–87. https://doi.org/10.1089/omi.2011.0118 [PubMed]
- 40. Walter W, Sánchez-Cabo F, Ricote M. GOplot: an R package for visually combining expression data with functional analysis. Bioinformatics. 2015; 31:2912–14. https://doi.org/10.1093/bioinformatics/btv300 [PubMed]
- 41. Tibshirani R. The lasso method for variable selection in the cox model. Stat Med. 1997; 16:385–95. https://doi.org/10.1002/(sici)1097-0258(19970228)16:4<385::aid-sim380>3.0.co;2-3 [PubMed]