


Introduction
Lung cancer is the second most common malignant tumor and the leading cause of death in all carcinomas [1]. Nearly 85% of lung cancer patients have non-small-cell lung cancer (NSCLC) [2]. Lung adenocarcinoma (LUAD) is the primary histological subtype in NSCLC and is more likely in young, female patients [3, 4]. In recent years, LUAD morbidity has been increasing, with a five-year survival rate below 15% [5]. Although LUAD pathogenesis studies have shown significant progress, there are still several problems that need to be resolved. Therefore, there is an urgent need to identify new diagnoses and therapeutic molecular markers of LUAD.
Glucosamine-phosphate N-acetyltransferase 1 (GNPNAT1) is a key enzyme associated with uridine diphosphate-N-acetylglucosamine biosynthesis. It can participate in insulin secretion and also influence cell cycle progression and cell apoptosis [6]. If GNPNAT1 is deficient or inactivated, the cell cycle is delayed, and subsequently cells die [7]. One of the hallmarks of tumor cells is increased metabolism, included glucose metabolism, fatty acid metabolism, amino acid metabolism, and nucleotide synthesis metabolism [8]. Zhao et al. reported that underexpression of GNPNAT1 in lung cancer A549 cells resulted in inhibited tumor cell adhesion and infiltration [9]. However, further research is needed to explore the role of GNPNAT1 as a tumor metabolism gene, whether it is an influencing factor in LUAD progression, and the related mechanisms.
Our study aimed to elucidate the potential role of GNPNAT1 in the occurrence and development of LUAD. Moreover, we aimed to provide new insights to support diagnosis and therapy for LUAD.
Results
The expression of GNPNAT1 in LUAD
We obtained data regarding the expression of GNPNAT1 in LUAD and normal lung tissues from the Cancer Genome Atlas (TCGA) and the Gene Expression Omnibus (GEO) database. There were five cohort meta-analyses of the differential expression of GNPNAT1 in the Lung Cancer Explorer (LCE) database, showing that the mRNA GNPNAT1 expression level was significantly higher in LUAD tumor tissues than in normal tissues (Figure 1A). We obtained similar results for the mRNA GNPNAT1 expression features using the Gene Expression Profiling Interactive Analysis (GEPIA) database (Figure 1B) and Oncomine database (Figure 1C).
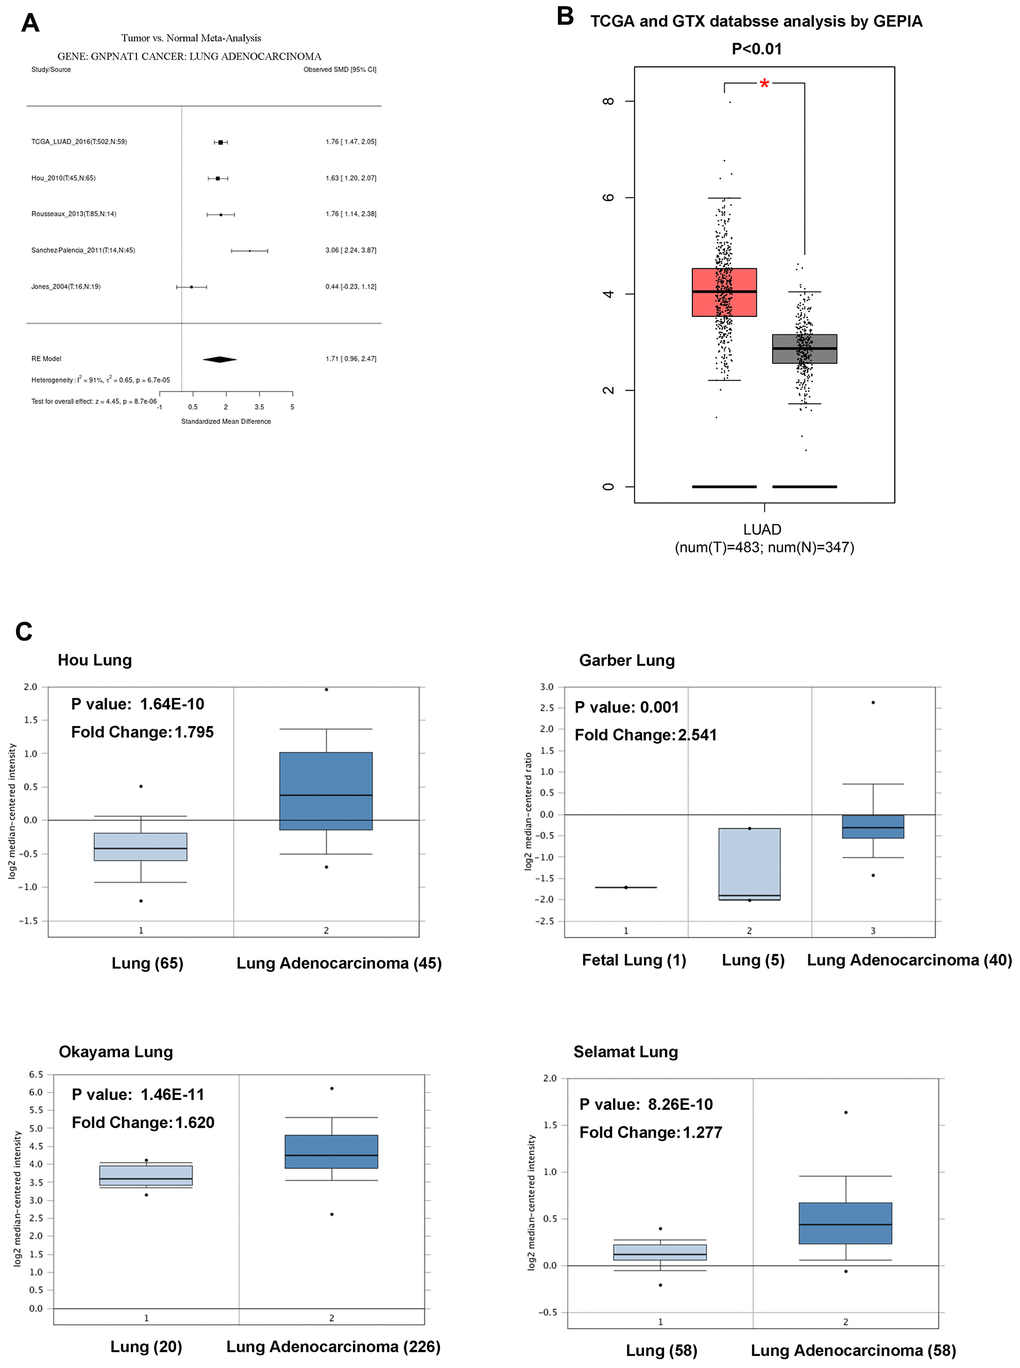
Figure 1. GNPNAT1 transcription level in LUAD. (A) The forest plot shows GNPNAT1 expression level meta-analysis of LUAD tumor tissues and normal tissues in five different LUAD cohorts (LCE). (B) The box plot shows GNPNAT1 mRNA expression levels of LUAD tumor tissues and normal tissues in the TCGA (GEPIA) datasets. (C) The box plot shows GNPNAT1 mRNA expression levels of LUAD tumor tissues and normal tissues in the Garber Lung, Okayama Lung, Selamat Lung, and Hou Lung datasets (Oncomine), respectively.
We used the UALCAN database to identify the mRNA GNPNAT1 expression in TCGA LUAD samples, grouped by characteristics such as age, sex, stage, race, and smoking status. (Figure 2A). In all subgroups, the mRNA GNPNAT1 expression level was higher in LUAD tumor tissues than in normal tissues. Therefore, GNPNAT1 might be a potential biomarker for the diagnosis of LUAD.
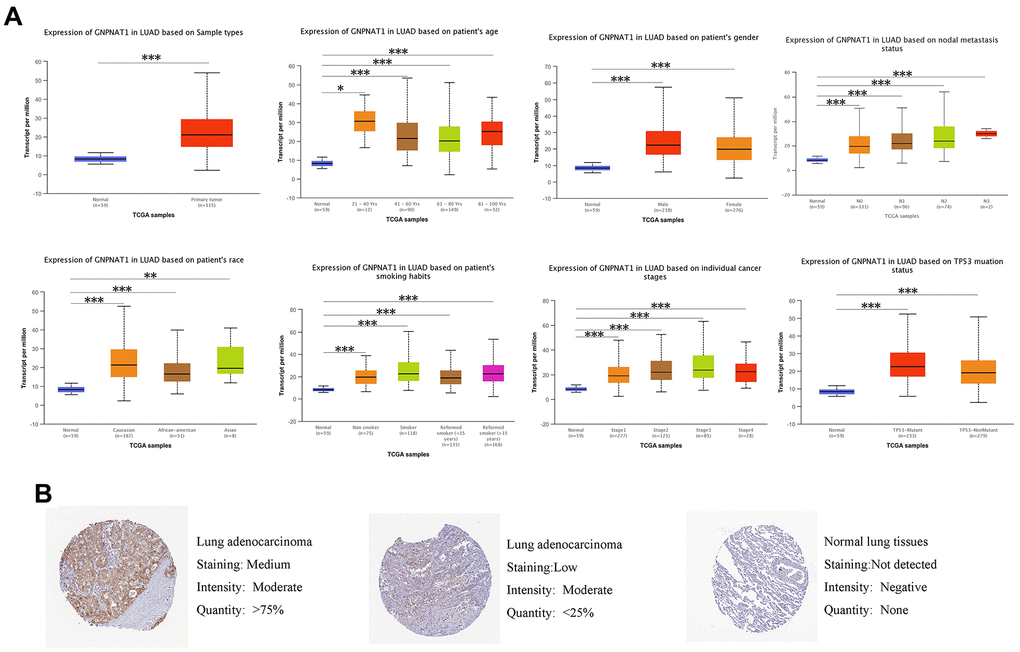
Figure 2. GNPNAT1 transcription and proteomics level in LUAD patients. (A) GNPNAT1 transcription level in normal and LUAD samples, and in subgroups of LUAD patients stratified by age, nodal metastasis, gender, race, smoking status, stage, and TP53 mutant status (UALCAN). The central mark is the median; the edges of the box are the 25th and 75th percentiles. The t-test was used to estimate the significance of difference in gene expression levels between groups. *, p < 0.05; **, p < 0.01; ***, p < 0.001. (B) Expression of GNPNAT1 in LUAD tumor specimens and normal specimens from the human protein profiles database (HPA).
To further assess GNPNAT1 expression levels in LUAD, we also detected GNPNAT1 protein levels in LUAD tissues and normal tissues by immunohistochemical staining in the Human Protein Atlas (HPA) database. As shown in Figure 2B, GNPNAT1 protein expression in cell cytoplasmic/membranous staining intensity was moderate or low in LUAD tissues, but it was not detected in normal tissues.
GNPNAT1 expression associated with survival in LUAD
This study aimed to determine the GNPNAT1 expression associated with survival in patients with LUAD. Kaplan-Meier survival curves were used to identify survival outcomes in the multiple LUAD cohorts. The median value of GNPNAT1 expression was the cutoff value, and each LUAD cohort was divided into a high and a low GNPNAT1 expression group. Compared to the low GNPNAT1 expression group, the high GNPNAT1 expression group had significantly poorer overall survival (OS) (log-rank test, p < 0.05) in the LUAD TCGA cohort (Figure 3A) and in the GSE72094 cohort (Figure 3B). From the LCE database, we got a 17 cohorts meta-analysis of GNPNAT1 expression associated with survival in LUAD; Figure 3C shows that the high GNPNAT1 expression group had poorer OS (test for all cohorts, p < 0.01, HR = 1.27) compared to the low GNPNAT1 expression group.
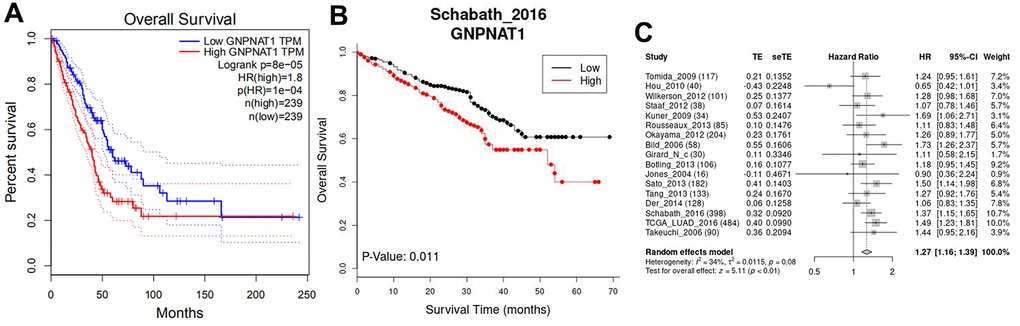
Figure 3. GNPNAT1 expression was associated with the survival in LUAD. (A) Overall survival (OS) in the TCGA cohort (GEPIA). (B) OS in GSE72094 (Schabath_2016) cohort (LCE). (C) The forest plot shows 17 cohorts meta-analysis OS (LCE).
The co-expression networks of GNPNAT1 in LUAD
We used LinkedOmics to obtain the GNPNAT1 co-expression networks in the LUAD TCGA cohorts. There were 4039 positively co-expressed genes and 6654 negatively co-expressed genes with GNPNAT1 (FDR < 0.01); in Figure 4A, the dark red dots represent positively correlated genes and the dark green dots represent negatively correlated genes. We drew heatmaps with the 50 most significant positively and negatively co-expressed genes, respectively (Figure 4B). All these significantly correlated genes are shown in Supplementary Table 1.
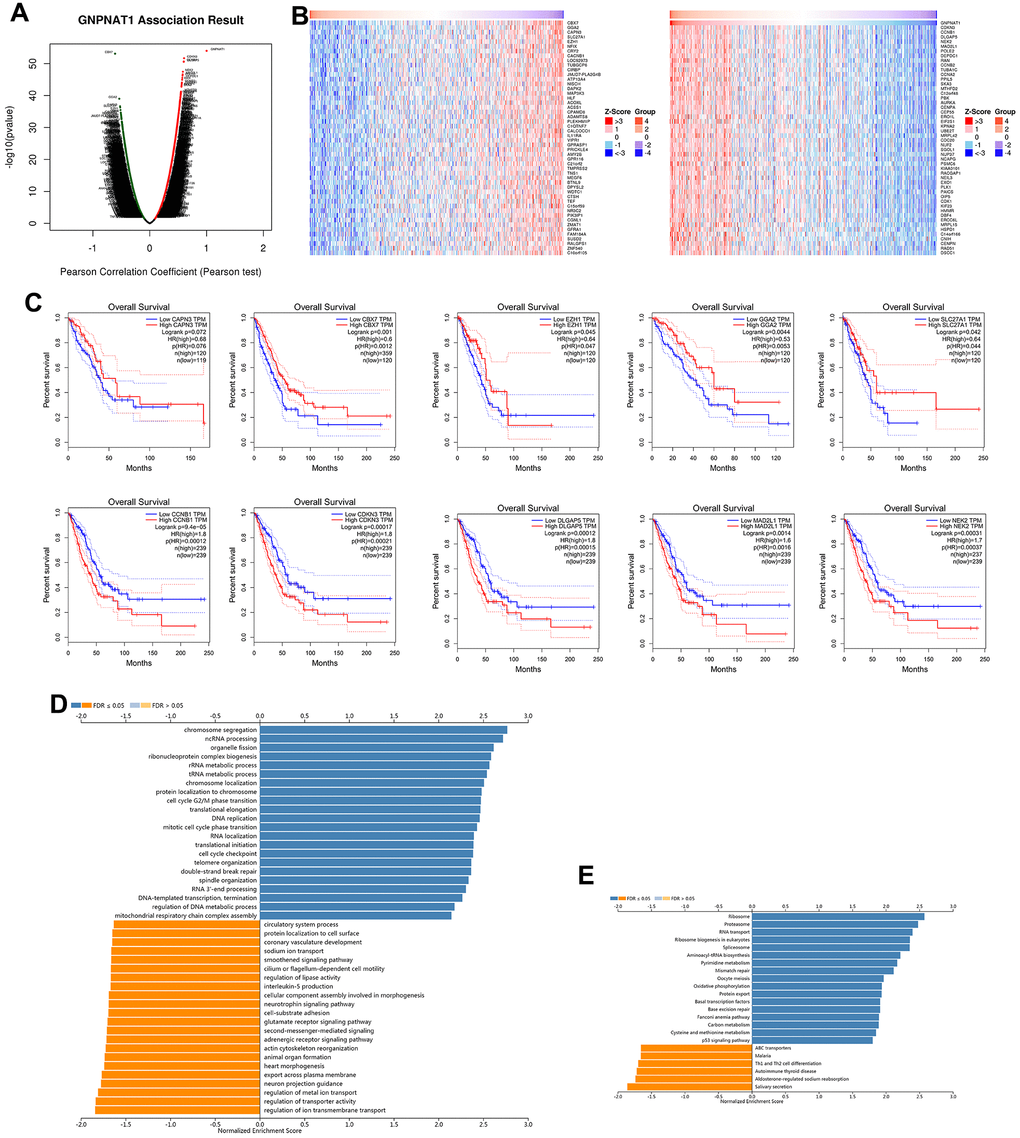
Figure 4. GNPNAT1 co-expressed genes in LUAD (LinkedOmics). (A) The volcano plot shows the GNPNAT1 highly correlated genes identified by the Pearson test in the LUAD cohort. (B) The heat maps show the top 50 genes positively and negatively correlated with GNPNAT1 in LUAD. (C) Top five genes positively and negatively correlated with GNPNAT1 associated with survival in LUAD. (D) Significantly enriched GO annotations of GNPNAT1 in the LUAD cohort. (E) Significantly enriched KEGG pathways of GNPNAT1 in the LUAD cohort.
The five most significant genes positively associated with GNPNAT1 expression were cyclin dependent kinase inhibitor 3 (CDKN3), cyclin B1 (CCNB1), DLG associated protein 5 (DLGAP5), NIMA related kinase 2 (NEK2), and mitotic arrest deficient 2 like 1 (MAD2L1). The five most significant negatively associated genes were chromobox 7(CBX7), Golgi-associated, gamma adaptin ear-containing, and ARF-binding protein 2 (GGA2), calpain 3 (CAPN3), solute carrier family 27 member 1 (SLC27A1), and enhancer of zeste 1 polycomb repressive complex 2 subunit (EZH1). We used GEPIA to identify the 10 genes associated with OS in LUAD. Kaplan-Meier survival curves are shown in Figure 4C. All the five positive high expressions showed significant risk genes in LUAD (p < 0.05); conversely, the five negative high expressions showed protective genes in LUAD (p < 0.05; except CAPN3, p = 0.072).
We used gene set enrichment analysis (GSEA) to annotate GNPNAT1 co-expressed genes with a significant GO term. It showed that GNPNAT1 co-expressed genes are mainly involved in chromosome segregation, ncRNA processing, organelle fission, ribonucleoprotein complex biogenesis, rRNA and tRNA metabolic process, etc., and in inhibited ion transmembrane transport, transporter activity, metal ion transport, neuron projection guidance, export across plasma membrane, and so forth (Figure 4D and Supplementary Table 2). KEGG pathway analysis showed enrichment in the ribosome, proteasome, RNA transport, ribosome biogenesis in eukaryotes, spliceosome, and so forth (Figure 4E and Supplementary Table 3).
GNPNAT1 networks of kinase, miRNA, and transcription factor targets in LUAD
To further explore the targets of GNPNAT1 in LUAD, we analyzed the kinase, miRNA, and transcription factor target networks of GNPNAT1 co-expressed genes. The top five most significant kinase-target networks were cyclin-dependent kinase 1 (CDK1), polo-like kinase 1 (PLK1), Aurora kinase B (AURKB), cyclin-dependent kinase 2 (CDK2), and Aurora kinase A (AURKA) (Table 1 and Supplementary Table 4). Except for CDK2, the expression of these genes in LUAD tissue was higher compared with that in normal tissue. Furthermore, except for CDK2, for all the kinase genes, higher expression was associated with poor OS of LUAD (Supplementary Figure 1). CDK1 is a diagnostic biomarker and a prognostic biomarker in LUAD [10, 11].
Table 1. The kinase, miRNA and transcription factor targets of GNPNAT1 in LUAD.
| Enriched category | Geneset | LeadingEdge Num | FDR |
| Kinase Target | Kinase_CDK1 | 84 | 0 |
| Kinase_PLK1 | 30 | 0 | |
| Kinase_AURKB | 34 | 0 | |
| Kinase_CDK2 | 90 | 0 | |
| Kinase_AURKA | 14 | 0.00018945 | |
| miRNA Target | GGGGCCC,MIR-296 | 27 | 0.085139 |
| CCTGTGA,MIR-513 | 47 | 0.10451 | |
| CCCAGAG,MIR-326 | 49 | 0.12147 | |
| GAGCCTG,MIR-484 | 40 | 0.14007 | |
| AGCGCTT,MIR-518F, MIR-518E,MIR-518A | 7 | 0.1568 | |
| Transcription Target | V$E2F_Q6 | 81 | 0 |
| V$E2F1_Q6 | 85 | 0 | |
| V$E2F_Q4 | 81 | 0 | |
| V$E2F1DP1_01 | 82 | 0 | |
| V$E2F1DP2_01 | 82 | 0 |
We obtained miRNA-target networks of GNPNAT1 co-expressed genes by GSEA, but there was no statistical significance. (Supplementary Table 5). The transcription factor-target networks related primarily to the E2F transcription factor family, including E2F-Q6, E2F1-Q6, E2F-Q4, E2F1DP1_01, and E2F1DP2_01 (Supplementary Table 6). High expression levels of E2F family genes are associated with an unfavorable prognosis in LUAD [12, 13].
Genomic alterations of GNPNAT1 in LUAD
We used the cBioPortal to determine the types and frequency of GNPNAT1 alterations in LUAD based on sequencing data from LUAD patients in the TCGA database. There were 39 out of 522 (7.47%) LUAD patients with GNPNAT1 alterations (Figure 5A). The alterations were mRNA upregulation in 23 cases (4.41%), amplification in 11 cases (2.11%), mutation in 1 case (0.19%), deep deletion in 1 case (0.19%), and multiple alterations in 3 cases (0.57%). Although GNPNAT1 alterations in LUAD were not frequent, mRNA upregulation and amplification were the most common types of GNPNAT1 copy number variation (CNV) in LUAD. We estimated the frequency distribution of GNPNAT1 CNV patients in different stage groups; as shown in Figure 5B, stage I and stage II patients had a high occurrence of GNPNAT1 CNV alteration in LUAD. We divided the patients with LUAD into a GNPNAT1 CNV alteration group and a no GNPNAT1 CNV alteration group; GNPNAT1 CNV alteration group patients had poorer OS than patients in the no GNPNAT1 CNV alteration group (p < 0.05) (Figure 5C). The median survival time was 32.82 months and 49.31 months, respectively.
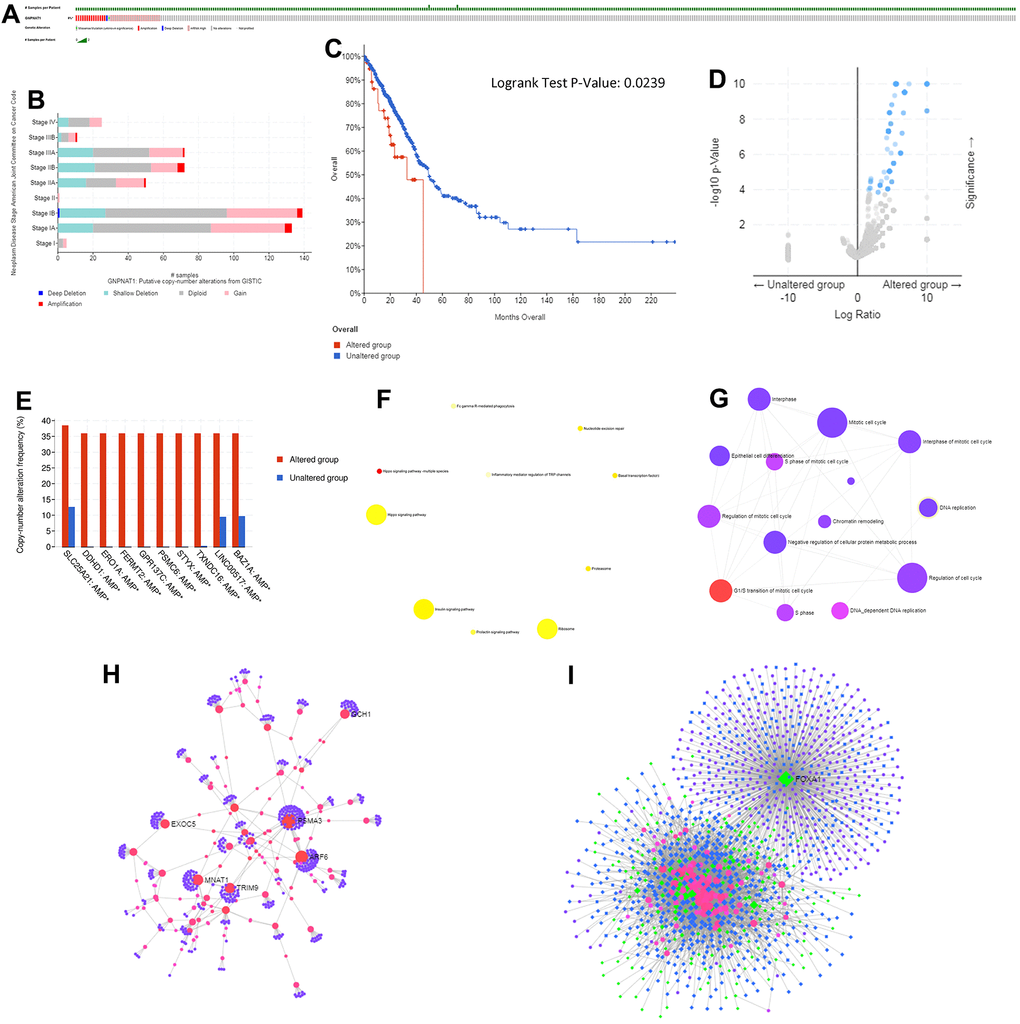
Figure 5. Genomic alterations of GNPNAT1 in LUAD (cBioPortal).GNPNAT1 alterations in the LUAD cohort. The different types of genetic alterations highlighted in different colors. (A) There were 39 out of 522 (7.47%) LUAD patients with GNPNAT1 alterations. (B) GNPNAT1 CNV frequency distribution in different stage subgroups. (C) GNPNAT1 CNV affected OS in LUAD. (D) The volcano plot shows genes co-occurring with GNPNAT1 amplification. (E) The bar plot shows the top 10 GNPNAT1 co-occurrent alteration genes. (F) KEGG pathway analysis of significant GNPNAT1 co-occurrent genes. (G) GO_BP terms of significantly GNPNAT1 co-occurrent genes. (H) The lung-specific PPI network of significant GNPNAT1 co-occurrent genes. (I) Transcription factor-miRNA (TF-miRNA) coregulatory network of significant GNPNAT1 co-occurrent genes.
Gene co-occurrence of GNPNAT1 alterations in LUAD
Gene co-occurrence reflected common genetic risk factors constituting functional relationships. We subsequently identified the co-occurrence genes with GNPNAT1 amplification in LUAD. There were 120 significant co-occurrences with GNPNAT1 amplification genes, as shown in Figure 5D (Supplementary Table 7). The top 10 alterations were solute carrier family 25 member 21 (SLC25A21), DDHD domain containing 1(DDHD1), endoplasmic reticulum oxidoreductase 1 alpha (ERO1A), fermitin family member 2 (FERMT2), G-protein-coupled receptor 137C (GPR137C), proteasome 26S subunit, ATPase 6 (PSMC6), serine/threonine/tyrosine interacting protein (STYX), thioredoxin domain containing 16 (TXNDC16), long intergenic non-protein coding RNA 517 (LINC00517), bromodomain adjacent to zinc finger domain 1A (BAZ1A), shown in Figure 5E. Enriched KEGG pathway analysis indicated that these co-occurrent genes were mainly enriched in Hippo signaling pathway-multiple species (Figure 5F). This signal pathway is primarily associated with the proliferation and apoptosis of tumor cells. GO term analysis of these genes showed enrichment in the G1/S transition of the mitotic cell cycle (Figure 5G and Supplementary Table 8), which also indicated that these genes participate in the growth of tumors.
Moreover, we constructed a GNPNAT1 co-occurrence gene protein-protein interaction (PPI) network using lung-specific data collected from the DifferentialNet database (Figure 5H). Proteasome 20S subunit alpha (PSMA) 3, PSMA4, PSMA5, tripartite motif containing 9 (TRIM9), and GTP cyclohydrolase 1(GCH1) were the top 5 hub genes. PSMA is a proteasome subunit alpha type associated with the occurrence and development of multiple cancers [14, 15].
Finally, we constructed the GNPNAT1 co-occurrence genes TF-miRNA coregulatory interactions using the RegNetwork repository (Figure 5I). Forkhead box A1(FOXA1), Kelch-like family member 28 (KLHL28), cofilin 2 (CFL2), SIX homeobox 4 (SIX4), and glia maturation factor beta (GMFB) were the top five TFs. Many studies have shown that FOXA1 participates in the development of lung cancer, prostate cancer, and several other types of cancers [16–19].
Association between GNPNAT1 expression and immune infiltration level in LUAD
We used the TISIDB database to assess whether GNPNAT1 expression was significantly correlated with immune cell infiltration level in LUAD, as shown in Table 2 (Figure 6). There were 20/28 significantly correlated immune cells, including B cells, CD4 T cells, CD8 T cells, CD56dim cells, eosinophils, IMM B cells, macrophages, mast cells, MDSC cells, neutrophils, NK cells, NKT cells, pDC cells, Tem CD8 cells, Tfh cells, Tgd cells, Th1 cells, Th2 cells, Th17 cells, and Treg cells. We also observed associations between GNPNAT1 expression and immune cell infiltration levels across different cancer types (Supplementary Figure 2A).
Table 2. Correlation analysis between GNPNAT1 expression and immune cells infiltration level in LUAD.
| Immune cell | Correlation coefficient | P value | |||||||||||||||||||||||||||||||||||||||||||||||||||||||||||||||||||||||||||||||||||||||||||||||||
| Activated B cell | -0.262 | 1.64e-09*** | |||||||||||||||||||||||||||||||||||||||||||||||||||||||||||||||||||||||||||||||||||||||||||||||||
| Activated CD4 T cell | 0.31 | 7.82e-13*** | |||||||||||||||||||||||||||||||||||||||||||||||||||||||||||||||||||||||||||||||||||||||||||||||||
| Activated CD8 T cell | 0.09 | 0.0419* | |||||||||||||||||||||||||||||||||||||||||||||||||||||||||||||||||||||||||||||||||||||||||||||||||
| Activated dendritic cell | 0.024 | 0.589 | |||||||||||||||||||||||||||||||||||||||||||||||||||||||||||||||||||||||||||||||||||||||||||||||||
| CD56bright natural killer cell | 0.024 | 0.586 | |||||||||||||||||||||||||||||||||||||||||||||||||||||||||||||||||||||||||||||||||||||||||||||||||
| CD56dim natural killer cell | 0.196 | 7.86e-06*** | |||||||||||||||||||||||||||||||||||||||||||||||||||||||||||||||||||||||||||||||||||||||||||||||||
| Eosinophil cell | -0.504 | <2.2e-16*** | |||||||||||||||||||||||||||||||||||||||||||||||||||||||||||||||||||||||||||||||||||||||||||||||||
| Immature dendritic cell | -0.063 | 0.154 | |||||||||||||||||||||||||||||||||||||||||||||||||||||||||||||||||||||||||||||||||||||||||||||||||
| Immature B cell | -0.317 | 1.98e-13*** | |||||||||||||||||||||||||||||||||||||||||||||||||||||||||||||||||||||||||||||||||||||||||||||||||
| Macrophage cell | -0.203 | 3.28e-06*** | |||||||||||||||||||||||||||||||||||||||||||||||||||||||||||||||||||||||||||||||||||||||||||||||||
| Mast cell | -0.397 | <2.2e-16*** | |||||||||||||||||||||||||||||||||||||||||||||||||||||||||||||||||||||||||||||||||||||||||||||||||
| Myeloid derived suppressor cell | -0.156 | 0.000375*** | |||||||||||||||||||||||||||||||||||||||||||||||||||||||||||||||||||||||||||||||||||||||||||||||||
| Memory B cell | 0.007 | 0.876 | |||||||||||||||||||||||||||||||||||||||||||||||||||||||||||||||||||||||||||||||||||||||||||||||||
| Monocyte | 0.014 | 0.746 | |||||||||||||||||||||||||||||||||||||||||||||||||||||||||||||||||||||||||||||||||||||||||||||||||
| Neutrophil | -0.111 | 0.0112* | |||||||||||||||||||||||||||||||||||||||||||||||||||||||||||||||||||||||||||||||||||||||||||||||||
| Natural killer cell | -0.282 | 8.41e-11*** | |||||||||||||||||||||||||||||||||||||||||||||||||||||||||||||||||||||||||||||||||||||||||||||||||
| Natural killer T cell | -0.112 | 0.011* | |||||||||||||||||||||||||||||||||||||||||||||||||||||||||||||||||||||||||||||||||||||||||||||||||
| Plasmacytoid dendritic cell | -0.261 | 1.87e-09*** | |||||||||||||||||||||||||||||||||||||||||||||||||||||||||||||||||||||||||||||||||||||||||||||||||
| Central memory CD4 T cell | 0.002 | 0.964 | |||||||||||||||||||||||||||||||||||||||||||||||||||||||||||||||||||||||||||||||||||||||||||||||||
| Central memory CD8 T cell | -0.016 | 0.708 | |||||||||||||||||||||||||||||||||||||||||||||||||||||||||||||||||||||||||||||||||||||||||||||||||
| Effector memory CD4 T cell | -0.017 | 0.707 | |||||||||||||||||||||||||||||||||||||||||||||||||||||||||||||||||||||||||||||||||||||||||||||||||
| Effector memory CD8 T cell | -0.274 | 2.7e-10*** | |||||||||||||||||||||||||||||||||||||||||||||||||||||||||||||||||||||||||||||||||||||||||||||||||
| T follicular helper cell | -0.249 | 1.1e-08*** | |||||||||||||||||||||||||||||||||||||||||||||||||||||||||||||||||||||||||||||||||||||||||||||||||
| Gamma delta T cell | 0.098 | 0.0264* | |||||||||||||||||||||||||||||||||||||||||||||||||||||||||||||||||||||||||||||||||||||||||||||||||
| Type 1 T helper cell | -0.148 | 0.000751*** | |||||||||||||||||||||||||||||||||||||||||||||||||||||||||||||||||||||||||||||||||||||||||||||||||
| Type 2 T helper cell | 0.119 | 0.00658** | |||||||||||||||||||||||||||||||||||||||||||||||||||||||||||||||||||||||||||||||||||||||||||||||||
| Type 17 T helper cell | -0.304 | 2.23e-12*** | |||||||||||||||||||||||||||||||||||||||||||||||||||||||||||||||||||||||||||||||||||||||||||||||||
| Regulatory T cell | -0.143 | 0.00115** | |||||||||||||||||||||||||||||||||||||||||||||||||||||||||||||||||||||||||||||||||||||||||||||||||
| *, p < 0.05; **, p < 0.01; ***, p < 0.001. | |||||||||||||||||||||||||||||||||||||||||||||||||||||||||||||||||||||||||||||||||||||||||||||||||||
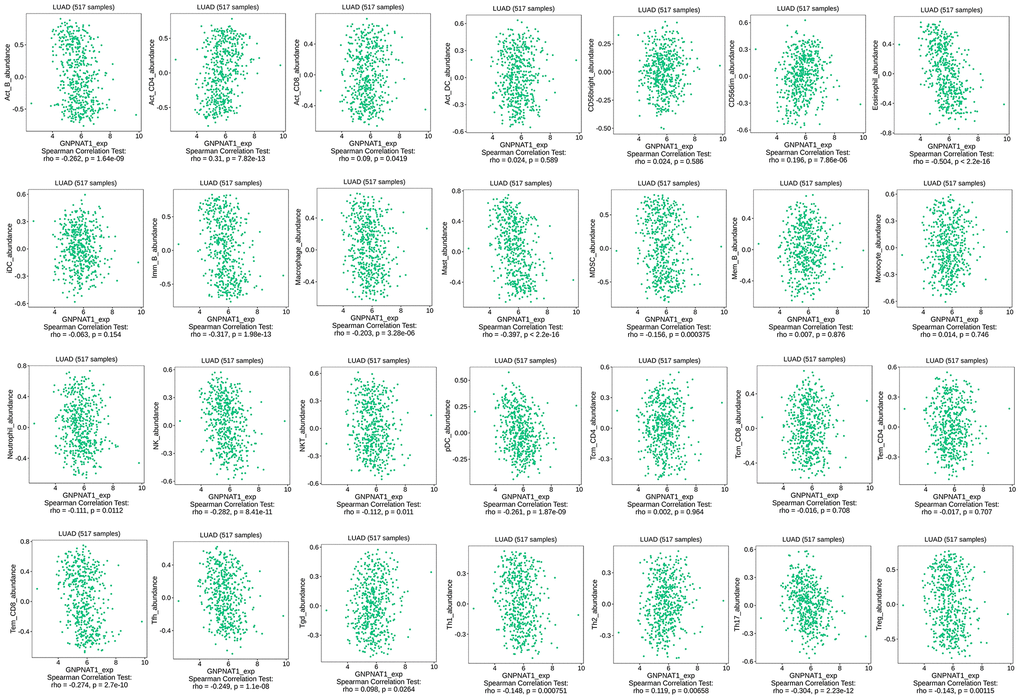
Figure 6. GNPNAT1 expression had a significant correlation with immune cells infiltration level in LUAD.
Immunomodulators included immunoinhibitors, immunostimulators, and MHC molecules, which regulate immune system functions. We found that GNPNAT1 expression was significantly negatively correlated with immunomodulators (Table 3). The five most highly correlated immunoinhibitors (Figure 7A) were galectin 9 (LGALS9), adenosine A2a receptor (ADORA2A), transforming growth factor beta 1 (TGFB1), colony-stimulating factor 1 receptor (CSF1R), B and T lymphocyte associated (BTLA). The five most highly correlated immunostimulators (Figure 7B) were transmembrane protein 173 (TMEM173), TNF receptor superfamily member 14 (TNFRSF14), CD40 ligand (CD40LG), TNF receptor superfamily member 13B (TNFRSF13B), and PVR cell adhesion molecule (PVR). The five most highly correlated MHC molecules (Figure 7C) were major histocompatibility complex, class II, DP beta 1 (HLA-DPB1), major histocompatibility complex, class II, DO alpha (HLA-DOA), major histocompatibility complex, class II, DM alpha (HLA-DMA), major histocompatibility complex, class II, DR beta 1 (HLA-DRB1), and major histocompatibility complex, class II, DP alpha 1 (HLA-DPA1). We also observed associations between GNPNAT1 expression and immunomodulators across different cancer types (Supplementary Figure 2B–2D).
Table 3. Correlation analysis between GNPNAT1 expression and immunomodulators expression in LUAD.
| Immunomodulators | Geneset | Correlation coefficient | P value | ||||||||||||||||||||||||||||||||||||||||||||||||||||||||||||||||||||||||||||||||||||||||||||||||
| Immunoinhibitors | ADORA2A | -0.273 | 3.3e-10*** | ||||||||||||||||||||||||||||||||||||||||||||||||||||||||||||||||||||||||||||||||||||||||||||||||
| BTLA | -0.226 | 2.25e-07*** | |||||||||||||||||||||||||||||||||||||||||||||||||||||||||||||||||||||||||||||||||||||||||||||||||
| CSF1R | -0.251 | 7.64e-09*** | |||||||||||||||||||||||||||||||||||||||||||||||||||||||||||||||||||||||||||||||||||||||||||||||||
| LGALS9 | -0.323 | 6.98e-14*** | |||||||||||||||||||||||||||||||||||||||||||||||||||||||||||||||||||||||||||||||||||||||||||||||||
| TGFB1 | -0.253 | 5.94e-09*** | |||||||||||||||||||||||||||||||||||||||||||||||||||||||||||||||||||||||||||||||||||||||||||||||||
| Immunostimulators | CD40LG | -0.382 | <2.2e-16*** | ||||||||||||||||||||||||||||||||||||||||||||||||||||||||||||||||||||||||||||||||||||||||||||||||
| PVR | 0.352 | 1.58e-16*** | |||||||||||||||||||||||||||||||||||||||||||||||||||||||||||||||||||||||||||||||||||||||||||||||||
| TMEM173 | -0.436 | <2.2e-16*** | |||||||||||||||||||||||||||||||||||||||||||||||||||||||||||||||||||||||||||||||||||||||||||||||||
| TNFRSF13B | -0.353 | 1.21e-16*** | |||||||||||||||||||||||||||||||||||||||||||||||||||||||||||||||||||||||||||||||||||||||||||||||||
| TNFRSF14 | -0.411 | <2.2e-16*** | |||||||||||||||||||||||||||||||||||||||||||||||||||||||||||||||||||||||||||||||||||||||||||||||||
| MHC molecules | HLA-DMA | -0.404 | <2.2e-16*** | ||||||||||||||||||||||||||||||||||||||||||||||||||||||||||||||||||||||||||||||||||||||||||||||||
| HLA-DOA | -0.414 | <2.2e-16*** | |||||||||||||||||||||||||||||||||||||||||||||||||||||||||||||||||||||||||||||||||||||||||||||||||
| HLA-DPA1 | -0.37 | <2.2e-16*** | |||||||||||||||||||||||||||||||||||||||||||||||||||||||||||||||||||||||||||||||||||||||||||||||||
| HLA-DPB1 | -0.419 | <2.2e-16*** | |||||||||||||||||||||||||||||||||||||||||||||||||||||||||||||||||||||||||||||||||||||||||||||||||
| HLA-DRB1 | -0.386 | <2.2e-16*** | |||||||||||||||||||||||||||||||||||||||||||||||||||||||||||||||||||||||||||||||||||||||||||||||||
| ***, p < 0.001. | |||||||||||||||||||||||||||||||||||||||||||||||||||||||||||||||||||||||||||||||||||||||||||||||||||
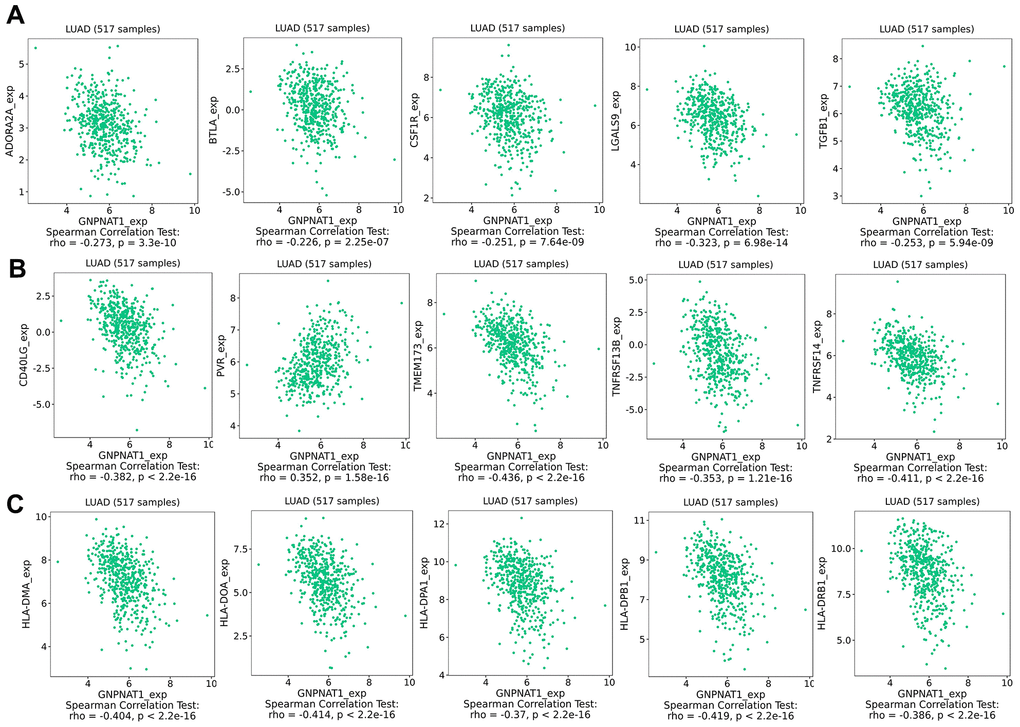
Figure 7. GNPNAT1 expression associated with immunomodulators in LUAD. (A) Top five immunoinhibitors correlated with GNPNAT1 expression in LUAD. (B) Top five immunostimulators correlated with GNPNAT1 expression in LUAD. (C) Top five MHC molecules correlated with GNPNAT1 expression in LUAD.
Chemokines expression levels are key factors in controlling immune cell infiltration. We identified the correlation between GNPNAT1 expression and chemokines (Table 4). The five most highly correlated chemokines (Figure 8A) were C-C motif chemokine ligand (CCL)-14, C-X3-C motif chemokine ligand 1 (CX3CL1), CXC motif chemokine ligand 8 (CXCL8), CCL17, CCL19. The top five chemokine receptors (Figure 8B) were C-X3-C motif chemokine receptor 1 (CX3CR1), CC motif chemokine receptor (CCR)-6, CCR7, CCR4, CXC motif chemokine receptor 5 (CXCR5). Moreover, we described the correlation of GNPNAT1 expression with chemokines or receptors across different cancer types (Supplementary Figure 3).
Table 4. Correlation analysis between GNPNAT1 expression and chemokines expression in LUAD.
| Chemokines | Geneset | Correlation coefficient | P value | ||||||||||||||||||||||||||||||||||||||||||||||||||||||||||||||||||||||||||||||||||||||||||||||||
| Chemokines | CCL14 | -0.384 | <2.2e-16*** | ||||||||||||||||||||||||||||||||||||||||||||||||||||||||||||||||||||||||||||||||||||||||||||||||
| CCL17 | -0.307 | 1.34e-12*** | |||||||||||||||||||||||||||||||||||||||||||||||||||||||||||||||||||||||||||||||||||||||||||||||||
| CCL19 | -0.296 | 8.88e-12*** | |||||||||||||||||||||||||||||||||||||||||||||||||||||||||||||||||||||||||||||||||||||||||||||||||
| CX3CL1 | -0.328 | 2.81e-14*** | |||||||||||||||||||||||||||||||||||||||||||||||||||||||||||||||||||||||||||||||||||||||||||||||||
| CXCL8 | 0.324 | 5.5e-14*** | |||||||||||||||||||||||||||||||||||||||||||||||||||||||||||||||||||||||||||||||||||||||||||||||||
| Chemokine receptors | CCR4 | -0.295 | 9.1e-12*** | ||||||||||||||||||||||||||||||||||||||||||||||||||||||||||||||||||||||||||||||||||||||||||||||||
| CCR6 | -0.398 | <2.2e-16*** | |||||||||||||||||||||||||||||||||||||||||||||||||||||||||||||||||||||||||||||||||||||||||||||||||
| CCR7 | -0.316 | 2.69e-13*** | |||||||||||||||||||||||||||||||||||||||||||||||||||||||||||||||||||||||||||||||||||||||||||||||||
| CX3CR1 | -0.427 | <2.2e-16*** | |||||||||||||||||||||||||||||||||||||||||||||||||||||||||||||||||||||||||||||||||||||||||||||||||
| CXCR5 | -0.249 | 1.05e-08*** | |||||||||||||||||||||||||||||||||||||||||||||||||||||||||||||||||||||||||||||||||||||||||||||||||
| ***, p < 0.001. | |||||||||||||||||||||||||||||||||||||||||||||||||||||||||||||||||||||||||||||||||||||||||||||||||||
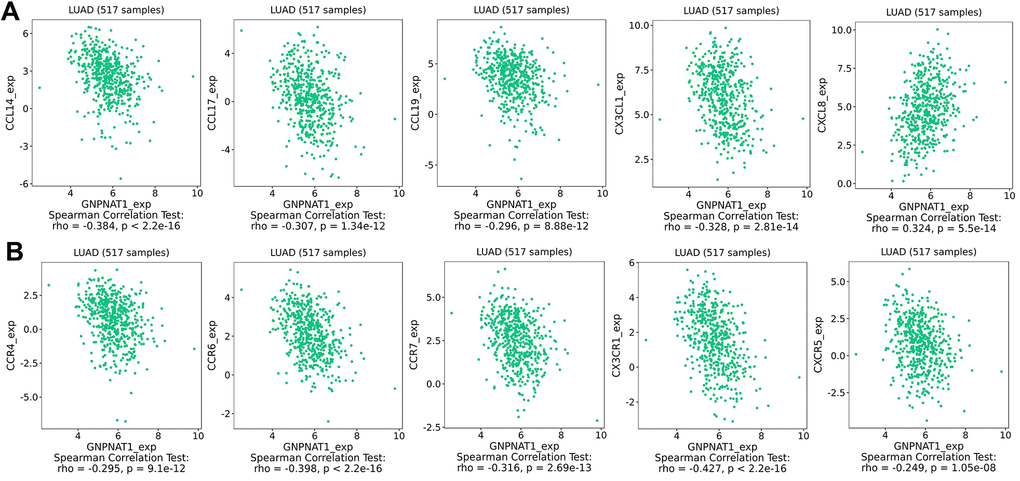
Figure 8. Correlation between GNPNAT1 expression and chemokines in LUAD. (A) Top five chemokines correlated with GNPNAT1 expression in LUAD. (B) Top five chemokine receptors correlated with GNPNAT1 expression in LUAD.
We evaluated these 25 immune genes correlated with GNPNAT1, including 23 negatively correlated genes and 2 positively correlated genes, and we found that higher expression of 18/23 negatively correlated genes was associated with favorable prognosis in patients with LUAD, while higher expression of 2/2 positively correlated genes was associated with unfavorable prognosis. (Table 5 and Figure 9).
Table 5. The prognosis of the top 25 immune genes correlative with GNPNAT1 in LUAD.
| Geneset | Hazards ratio(high) | P value | |||||||||||||||||||||||||||||||||||||||||||||||||||||||||||||||||||||||||||||||||||||||||||||||||
| Negatively correlative gene | ADORA2A | 0.64 | 0.045* | ||||||||||||||||||||||||||||||||||||||||||||||||||||||||||||||||||||||||||||||||||||||||||||||||
| BTLA | 0.6 | 0.018* | |||||||||||||||||||||||||||||||||||||||||||||||||||||||||||||||||||||||||||||||||||||||||||||||||
| CCL14 | 0.6 | 0.023* | |||||||||||||||||||||||||||||||||||||||||||||||||||||||||||||||||||||||||||||||||||||||||||||||||
| CCL17 | 0.64 | 0.04* | |||||||||||||||||||||||||||||||||||||||||||||||||||||||||||||||||||||||||||||||||||||||||||||||||
| CCL19 | 0.71 | 0.093 | |||||||||||||||||||||||||||||||||||||||||||||||||||||||||||||||||||||||||||||||||||||||||||||||||
| CCR4 | 0.51 | 0.0027** | |||||||||||||||||||||||||||||||||||||||||||||||||||||||||||||||||||||||||||||||||||||||||||||||||
| CCR6 | 0.52 | 0.0036** | |||||||||||||||||||||||||||||||||||||||||||||||||||||||||||||||||||||||||||||||||||||||||||||||||
| CCR7 | 0.57 | 0.012* | |||||||||||||||||||||||||||||||||||||||||||||||||||||||||||||||||||||||||||||||||||||||||||||||||
| CD40LG | 0.43 | 0.00016*** | |||||||||||||||||||||||||||||||||||||||||||||||||||||||||||||||||||||||||||||||||||||||||||||||||
| CSF1R | 0.89 | 0.58 | |||||||||||||||||||||||||||||||||||||||||||||||||||||||||||||||||||||||||||||||||||||||||||||||||
| CX3CL1 | 0.62 | 0.024* | |||||||||||||||||||||||||||||||||||||||||||||||||||||||||||||||||||||||||||||||||||||||||||||||||
| CX3CR1 | 0.58 | 0.018* | |||||||||||||||||||||||||||||||||||||||||||||||||||||||||||||||||||||||||||||||||||||||||||||||||
| CXCR5 | 0.91 | 0.66 | |||||||||||||||||||||||||||||||||||||||||||||||||||||||||||||||||||||||||||||||||||||||||||||||||
| HLA-DMA | 0.5 | 0.0021** | |||||||||||||||||||||||||||||||||||||||||||||||||||||||||||||||||||||||||||||||||||||||||||||||||
| HLA-DOA | 0.54 | 0.0046** | |||||||||||||||||||||||||||||||||||||||||||||||||||||||||||||||||||||||||||||||||||||||||||||||||
| HLA-DPA1 | 0.5 | 0.0031** | |||||||||||||||||||||||||||||||||||||||||||||||||||||||||||||||||||||||||||||||||||||||||||||||||
| HLA-DPB1 | 0.5 | 0.0024** | |||||||||||||||||||||||||||||||||||||||||||||||||||||||||||||||||||||||||||||||||||||||||||||||||
| HLA-DRB1 | 0.57 | 0.009** | |||||||||||||||||||||||||||||||||||||||||||||||||||||||||||||||||||||||||||||||||||||||||||||||||
| LGALS9 | 0.83 | 0.39 | |||||||||||||||||||||||||||||||||||||||||||||||||||||||||||||||||||||||||||||||||||||||||||||||||
| TGFB1 | 0.98 | 0.91 | |||||||||||||||||||||||||||||||||||||||||||||||||||||||||||||||||||||||||||||||||||||||||||||||||
| TMEM173 | 0.63 | 0.042* | |||||||||||||||||||||||||||||||||||||||||||||||||||||||||||||||||||||||||||||||||||||||||||||||||
| TNFRSF13B | 0.46 | 4e-04*** | |||||||||||||||||||||||||||||||||||||||||||||||||||||||||||||||||||||||||||||||||||||||||||||||||
| TNFRSF14 | 0.61 | 0.031* | |||||||||||||||||||||||||||||||||||||||||||||||||||||||||||||||||||||||||||||||||||||||||||||||||
| Positively correlative gene | CXCL8 | 1.6 | 0.028* | ||||||||||||||||||||||||||||||||||||||||||||||||||||||||||||||||||||||||||||||||||||||||||||||||
| PVR | 1.9 | 0.0013** | |||||||||||||||||||||||||||||||||||||||||||||||||||||||||||||||||||||||||||||||||||||||||||||||||
| *, p < 0.05; **, p < 0.01; ***, p < 0.001. | |||||||||||||||||||||||||||||||||||||||||||||||||||||||||||||||||||||||||||||||||||||||||||||||||||
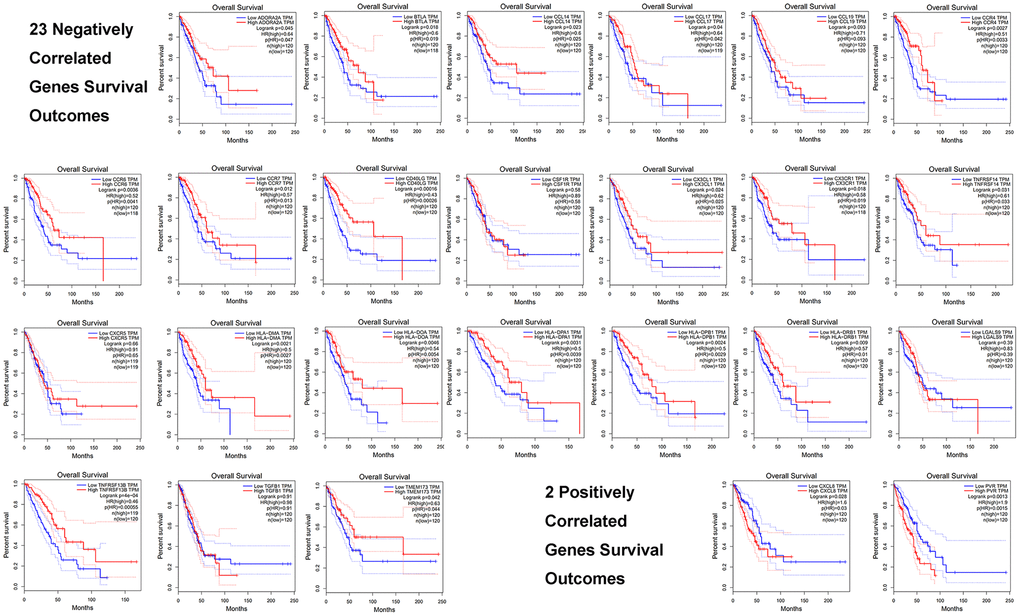
Figure 9. Prognosis of the top 25 immune genes correlated with GNPNAT1 in LUAD, including 23 negatively correlated genes and 2 positively correlated genes.
Discussion
Metabolic pathways, including glucose metabolism, amino acid metabolism, and fatty metabolism, participate in regulating tumor cell proliferation and progression, as reported by several researchers [20]. GNPNAT1, also called GNA1, is a protein with a crucial role in acetylglucosamine biosynthesis. Downregulation of GNPNAT1 expression has been found to be the key reason for the inhibition of lung cancer A549 cell proliferation and adhesion [9]. GNPNAT1 has also been reported to be a part of a metabolic gene signature in LUAD in six-gene and five-gene signatures [21, 22]. To obtain more detailed insights into GNPNAT1 potential functions and regulatory networks in LUAD and guide future LUAD research, we conducted a bioinformatics analysis of public data.
From the TCGA and GEO databases containing five LUAD study cohorts, we analyzed transcriptomes of more than 800 clinical samples and found that GNPNAT1 mRNA expression levels were higher in LUAD than in normal lung tissues (Figure 1). The analysis also confirmed that higher GNPNAT1 expression in LUAD was related to more unfavorable prognosis in multiple LUAD study cohorts. We analyzed our results, which indicated that overexpression of GNPNAT1 occurred in many patients with LUAD, and that further clinical and experimental validation was needed to investigate on its potential role as a diagnostic and prognostic marker.
The GNPNAT1 co-expression networks in LUAD are shown in Figure 4. The positively correlated genes with higher expression in LUAD were usually associated with worse survival outcomes, while the negatively correlated genes were associated with opposite outcomes. The overexpression of CDKN3 increased mitotic activity, resulting in more unfavorable prognosis in patients with LUAD [23]. Floriana Forzati and colleagues reported that CBX7 is a tumor suppressor, and its inactivation promotes LUAD progression [24]. We used GSEA to annotate the co-expressed genes; GO terms were mainly enriched in cell chromosome segregation and RNA metabolisms, etc., and KEGG pathways in ribosome and proteasome, etc. These enrichment functions commonly participate in cell proliferation and differentiation.
To identify the regulators that are potentially responsible for GNPNAT1 dysregulation, we revealed a network of kinases related to GNPNAT1 in LUAD, including CDK1, PLK1, AURKB, CDK2, and AURKA. These kinases target the regulation of genomic stability, mitosis progression, and cell cycle transition, which show differential expression and different prognoses in LUAD [11, 25–28]. CDK1 is mainly defined as a pivotal cell cycle regulator that not only participates in mitosis, but also in meiosis and protein synthesis [29]. Researchers have demonstrated that CDK1 inactivation influences multiple tumors cell cycle progression, thereby CDK1 might be a tumor therapeutic target. Many CDK1 inhibitors have been discovered and used in various tumors [30]. PLK1, AURKB, and AURKA are crucial factors not only in mitosis, but also in non-mitosis function and DNA damage response. For cancer therapies, these kinase inhibitors have been developed in diverse tumors [31–34]. In LUAD, GNPNAT1 deficiency results in cell cycle arrest, DNA damage, and repair response dysfunction, which might be due to the synergistic effects of these kinases. E2F family members are the key transcription factors of GNPNAT1 in LUAD. These E2F family genes mainly participate in cell cycle regulation, and uncontrolled cell cycle progression results in cancerous events [35]. Previous studies have shown that E2F transcription factors are significantly enriched in multiple tumor tissues and have verified that high E2F expression in hepatocellular carcinoma and LUAD is correlated to a worse prognosis [12, 13]. E2F1 is a key factor that prompts cell cycle transition in LUAD, and higher E2F1 expression in LUAD indicates unfavorable survival outcome [36]. Retinoblastoma (RB) protein and tumor protein P53 (TP53) participate in increasing E2F family gene expression in some particular tumors, and GNPNAT1 might also be a targeted gene in LUAD. Though, further research is required to prove this [37, 38].
Genomic alteration is frequently detected in patients with LUAD, and this alteration might predict unfavorable prognosis. CNVs might have significant genomic influence, disrupt genes, and change genetic content, leading to phenotypic differences [39, 40]. Our analysis results showed that the CNV of GNPNAT1 in LUAD had increased, and mRNA upregulation and amplification were the main types of GNPNAT1 alterations associated with unfavorable prognosis. By analyzing GNPNAT1 co-occurrence gene function, we found that GNPNAT1 might participate in multiple tumor cell cycle progression, further influencing tumor cell proliferation and apoptosis.
Malignant tumors are composed of not only tumor cells, but also non-tumor cells, such as immune cells, stromal cells, and normal epithelial cells, which are also called tumor micro-environment (TME) [41]. These cells in the TME can promote or inhibit tumor cell growth [42]. In TME, with the occurrence and development of tumors, abnormal tumor metabolism might lead to immunosuppression, and tumor cells might evade the immune response [43]. In this study, the tumor metabolism gene GNPNAT1 expression was closely related to immune cell infiltration in LUAD and was correlated with immunomodulators and chemokines. These immune factors were significantly associated with the prognosis of LUAD. In recent years, immunotherapy for LUAD has progressed significantly, and more research is needed to assess whether GNPNAT1 may be an immunotherapy critical factor in the future.
In this study, we found that GNPNAT1 is an important gene in the development and progression of LUAD by multi-omics analyses. GNPNAT1 was expressed at higher levels in LUAD tumor tissues than in normal tissues, which makes GNPNAT1 a potential biomarker in LUAD. GNPNAT1 overexpression in LUAD predicts a worse prognosis, which might be caused by the disruption of RNA metabolism and transport, and by that of mitotic cell cycle progression. We also found that GNPNAT1 has a potential novel immunomodulatory role in LUAD tumor immunity, and it might be a new target for lung cancer immunotherapy in the future. Nonetheless, all our findings need to be verified by further LUAD genomics research and subsequent functional studies.
Materials and Methods
LCE database analysis
LCE is a lung cancer-specific database including expression data and clinical data from over 6700 patients in 56 studies [44]. We could easily obtain an overview analysis of tumor versus non-malignant tissue (normal tissue) differential gene expression and expression–survival association by meta-analyses. In addition, we obtained an individual data set-based survival analysis, comparative analysis, and correlation analysis.
GEPIA database analysis
The GEPIA database (http://gepia.cancer-pku.cn/) is an interactive website that contains 9736 tumor samples and 8587 normal samples from TCGA and GTEx datasets [45]. We used GEPIA to generate OS curves, based on gene expression with the log-rank test and the Mantel-Cox test in LUAD. We obtained tumor versus non-malignant tissue (normal) gene differential expression map. The threshold values were p-value of 0.05 and fold change of 1.0.
Oncomine database analysis
The Oncomine database (https://www.oncomine.org/) is a cancer microarray database and web-based data-mining platform. The gene GNPNAT1 expression level in LUAD was examined in the Oncomine 4.5 database. We used a p-value of 0.05, fold change of 1.2, and gene ranking of all as the threshold values.
UALCAN database analysis
The UALCAN (http://ualcan.path.uab.edu) database is a comprehensive, user-friendly, and interactive web resource for analyzing cancer omics data [46]. We used the UALCAN database to obtain the gene GNPNAT1 expression analysis across LUAD and normal samples in various tumor sub-groups based on TCGA data.
HPA database analysis
The HPA (http://www.proteinatlas.org) database maps human proteins in cells, tissues, and organs using the integration of various omics technologies [47]. GNPNAT1 protein expression in LUAD tissues and normal lung tissues was mapped by immunohistochemistry.
LinkedOmics database analysis
The LinkedOmics database (http://www.linkedomics.org/login.php) is a publicly available portal that includes multi-omics data from all 32 TCGA cancer types [48]. We used LinkedOmics to gain the GNPNAT1 co-expression assessed by Pearson’s correlation coefficient statistical analysis, presented in volcano plots and heat maps. We used the GSEA function modules in the LinkedOmics database to obtain Gene Ontology biological process (GO_BP), KEGG pathways, kinase-target enrichment, miRNA-target enrichment, and transcription factor-target enrichment analysis. FDR < 0.05 and 1000 simulations were the standard in this enrichment analysis.
c-BioPortal database analysis
The cBioPortal (http://cbioportal.org) includes multidimensional cancer genomics [49]. We used the c-BioPortal tool to analyze GNPNAT1 mutation, gene co-occurrence, and CNV in LUAD (TCGA, Firehose Legacy). We also obtained the GNPNAT1 alterations overview per sample via this portal.
NetworkAnalyst database analysis
NetworkAnalyst 3.0 (https://www.networkanalyst.ca/) [50] is a tool that allows to create cell-type or tissue-specific PPI networks, gene regulatory networks, enrichment networks, and gene co-expression networks. All the GNPNAT1 co-occurrence gene networks were built using this tool.
TISIDB database analysis
TISIDB is a web portal for tumor and immune system interaction, which integrates data regarding 30 cancer types from TCGA (http://cis.hku.hk/TISIDB/) [51]. We used TISIDB tools to analyze the correlation of GNPNAT1 with 28 tumor-infiltrating lymphocytes (TILs), 45 immunostimulators, 24 immunoinhibitors, 21 MHC molecules, 41 chemokines, and 18 receptors.
Statistical analysis
We used Student’s t-tests to identify the different GNPNAT1 expression levels. Kaplan-Meier curves and the log-rank test were used to compare the OS of various gene expression subgroups. The correlation between GNPNAT1 expression, immune cell infiltration, and immune genes was evaluated by Spearman’s method. In these analyses, p < 0.05 was considered statistically significant.
Supplementary Materials
Author Contributions
Z-SQ performed data collection, data analysis, and manuscript writing. Z-HY participated data collection and manuscript writing. L-HW, G-JD and W-J participated in data collection and data analysis. Z-LY performed project development. All authors contributed to the article and approved the submitted version.
Conflicts of Interest
The authors declare no conflict of interest.
Funding
There is no fund supported for this research.
References
- 1. Siegel RL, Miller KD, Jemal A. Cancer statistics, 2020. CA Cancer J Clin. 2020; 70:7–30. https://doi.org/10.3322/caac.21590 [PubMed]
- 2. Shahabi S, Kumaran V, Castillo J, Cong Z, Nandagopal G, Mullen DJ, Alvarado A, Correa MR, Saizan A, Goel R, Bhat A, Lynch SK, Zhou B, et al. LINC00261 is an epigenetically regulated tumor suppressor essential for activation of the DNA damage response. Cancer Res. 2019; 79:3050–62. https://doi.org/10.1158/0008-5472.CAN-18-2034 [PubMed]
- 3. Lu X, Huang C, He X, Liu X, Ji J, Zhang E, Wang W, Guo R. A novel long non-coding RNA, SOX21-AS1, indicates a poor prognosis and promotes lung adenocarcinoma proliferation. Cell Physiol Biochem. 2017; 42:1857–69. https://doi.org/10.1159/000479543 [PubMed]
- 4. Fidler-Benaoudia MM, Torre LA, Bray F, Ferlay J, Jemal A. Lung cancer incidence in young women vs. Young men: a systematic analysis in 40 countries. Int J Cancer. 2020; 147:811–19. https://doi.org/10.1002/ijc.32809 [PubMed]
- 5. Chen W, Zheng R, Baade PD, Zhang S, Zeng H, Bray F, Jemal A, Yu XQ, He J. Cancer statistics in China, 2015. CA Cancer J Clin. 2016; 66:115–32. https://doi.org/10.3322/caac.21338 [PubMed]
- 6. Bacos K, Gillberg L, Volkov P, Olsson AH, Hansen T, Pedersen O, Gjesing AP, Eiberg H, Tuomi T, Almgren P, Groop L, Eliasson L, Vaag A, et al. Blood-based biomarkers of age-associated epigenetic changes in human islets associate with insulin secretion and diabetes. Nat Commun. 2016; 7:11089. https://doi.org/10.1038/ncomms11089 [PubMed]
- 7. Mio T, Kokado M, Arisawa M, Yamada-Okabe H. Reduced virulence of Candida albicans mutants lacking the GNA1 gene encoding glucosamine-6-phosphate acetyltransferase. Microbiology (Reading). 2000; 146:1753–58. https://doi.org/10.1099/00221287-146-7-1753 [PubMed]
- 8. El Hassouni B, Granchi C, Vallés-Martí A, Supadmanaba IG, Bononi G, Tuccinardi T, Funel N, Jimenez CR, Peters GJ, Giovannetti E, Minutolo F. The dichotomous role of the glycolytic metabolism pathway in cancer metastasis: interplay with the complex tumor microenvironment and novel therapeutic strategies. Semin Cancer Biol. 2020; 60:238–48. https://doi.org/10.1016/j.semcancer.2019.08.025 [PubMed]
- 9. Zhao M, Li H, Ma Y, Gong H, Yang S, Fang Q, Hu Z. Nanoparticle abraxane possesses impaired proliferation in A549 cells due to the underexpression of glucosamine 6-phosphate N-acetyltransferase 1 (GNPNAT1/GNA1). Int J Nanomedicine. 2017; 12:1685–97. https://doi.org/10.2147/IJN.S129976 [PubMed]
- 10. Liu WT, Wang Y, Zhang J, Ye F, Huang XH, Li B, He QY. A novel strategy of integrated microarray analysis identifies CENPA, CDK1 and CDC20 as a cluster of diagnostic biomarkers in lung adenocarcinoma. Cancer Lett. 2018; 425:43–53. https://doi.org/10.1016/j.canlet.2018.03.043 [PubMed]
- 11. Zhang L, He M, Zhu W, Lv X, Zhao Y, Yan Y, Li X, Jiang L, Zhao L, Fan Y, Su P, Gao M, Ma H, et al. Identification of a panel of mitotic spindle-related genes as a signature predicting survival in lung adenocarcinoma. J Cell Physiol. 2020; 235:4361–75. https://doi.org/10.1002/jcp.29312 [PubMed]
- 12. Wang H, Wang X, Xu L, Zhang J, Cao H. Integrated analysis of the E2F transcription factors across cancer types. Oncol Rep. 2020; 43:1133–46. https://doi.org/10.3892/or.2020.7504 [PubMed]
- 13. Sun CC, Zhou Q, Hu W, Li SJ, Zhang F, Chen ZL, Li G, Bi ZY, Bi YY, Gong FY, Bo T, Yuan ZP, Hu WD, et al. Transcriptional E2F1/2/5/8 as potential targets and transcriptional E2F3/6/7 as new biomarkers for the prognosis of human lung carcinoma. Aging (Albany NY). 2018; 10:973–87. https://doi.org/10.18632/aging.101441 [PubMed]
- 14. Ding XQ, Wang ZY, Xia D, Wang RX, Pan XR, Tong JH. Proteomic profiling of serum exosomes from patients with metastatic gastric cancer. Front Oncol. 2020; 10:1113. https://doi.org/10.3389/fonc.2020.01113 [PubMed]
- 15. Fu Z, Lu C, Zhang C, Qiao B. PSMA5 promotes the tumorigenic process of prostate cancer and is related to bortezomib resistance. Anticancer Drugs. 2019; 30:e0773. https://doi.org/10.1097/CAD.0000000000000773 [PubMed]
- 16. Mokhlesi A, Talkhabi M. Comprehensive transcriptomic analysis identifies novel regulators of lung adenocarcinoma. J Cell Commun Signal. 2020; 14:453–65. https://doi.org/10.1007/s12079-020-00565-4 [PubMed]
- 17. Chen D, Wang R, Yu C, Cao F, Zhang X, Yan F, Chen L, Zhu H, Yu Z, Feng J. FOX-A1 contributes to acquisition of chemoresistance in human lung adenocarcinoma via transactivation of SOX5. EBioMedicine. 2019; 44:150–61. https://doi.org/10.1016/j.ebiom.2019.05.046 [PubMed]
- 18. Parolia A, Cieslik M, Chu SC, Xiao L, Ouchi T, Zhang Y, Wang X, Vats P, Cao X, Pitchiaya S, Su F, Wang R, Feng FY, et al. Distinct structural classes of activating FOXA1 alterations in advanced prostate cancer. Nature. 2019; 571:413–18. https://doi.org/10.1038/s41586-019-1347-4 [PubMed]
- 19. Shou J, Lai Y, Xu J, Huang J. Prognostic value of FOXA1 in breast cancer: a systematic review and meta-analysis. Breast. 2016; 27:35–43. https://doi.org/10.1016/j.breast.2016.02.009 [PubMed]
- 20. Kreuzaler P, Panina Y, Segal J, Yuneva M. Adapt and conquer: metabolic flexibility in cancer growth, invasion and evasion. Mol Metab. 2020; 33:83–101. https://doi.org/10.1016/j.molmet.2019.08.021 [PubMed]
- 21. Zhang S, Lu Y, Liu Z, Li X, Wang Z, Cai Z. Identification six metabolic genes as potential biomarkers for lung adenocarcinoma. J Comput Biol. 2020; 27:1532–43. https://doi.org/10.1089/cmb.2019.0454 [PubMed]
- 22. Yu X, Zhang X, Zhang Y. Identification of a 5-gene metabolic signature for predicting prognosis based on an integrated analysis of tumor microenvironment in lung adenocarcinoma. J Oncol. 2020; 2020:5310793. https://doi.org/10.1155/2020/5310793 [PubMed]
- 23. Fan C, Chen L, Huang Q, Shen T, Welsh EA, Teer JK, Cai J, Cress WD, Wu J. Overexpression of major CDKN3 transcripts is associated with poor survival in lung adenocarcinoma. Br J Cancer. 2015; 113:1735–43. https://doi.org/10.1038/bjc.2015.378 [PubMed]
- 24. Forzati F, Federico A, Pallante P, Abbate A, Esposito F, Malapelle U, Sepe R, Palma G, Troncone G, Scarfò M, Arra C, Fedele M, Fusco A. CBX7 is a tumor suppressor in mice and humans. J Clin Invest. 2012; 122:612–23. https://doi.org/10.1172/JCI58620 [PubMed]
- 25. Kuang Y, Guo W, Ling J, Xu D, Liao Y, Zhao H, Du X, Wang H, Xu M, Song H, Wang T, Jing B, Li K, et al. Iron-dependent CDK1 activity promotes lung carcinogenesis via activation of the GP130/STAT3 signaling pathway. Cell Death Dis. 2019; 10:297. https://doi.org/10.1038/s41419-019-1528-y [PubMed]
- 26. Dalvi PS, Macheleidt IF, Lim SY, Meemboor S, Müller M, Eischeid-Scholz H, Schaefer SC, Buettner R, Klein S, Odenthal M. LSD1 inhibition attenuates tumor growth by disrupting PLK1 mitotic pathway. Mol Cancer Res. 2019; 17:1326–37. https://doi.org/10.1158/1541-7786.MCR-18-0971 [PubMed]
- 27. Vischioni B, Oudejans JJ, Vos W, Rodriguez JA, Giaccone G. Frequent overexpression of Aurora B kinase, a novel drug target, in non-small cell lung carcinoma patients. Mol Cancer Ther. 2006; 5:2905–13. https://doi.org/10.1158/1535-7163.MCT-06-0301 [PubMed]
- 28. Zheng X, Chi J, Zhi J, Zhang H, Yue D, Zhao J, Li D, Li Y, Gao M, Guo J. Aurora-A-mediated phosphorylation of LKB1 compromises LKB1/AMPK signaling axis to facilitate NSCLC growth and migration. Oncogene. 2018; 37:502–11. https://doi.org/10.1038/onc.2017.354 [PubMed]
- 29. Kalous J, Jansová D, Šušor A. Role of cyclin-dependent kinase 1 in translational regulation in the M-phase. Cells. 2020; 9:1568. https://doi.org/10.3390/cells9071568 [PubMed]
- 30. Wang Q, Su L, Liu N, Zhang L, Xu W, Fang H. Cyclin dependent kinase 1 inhibitors: a review of recent progress. Curr Med Chem. 2011; 18:2025–43. https://doi.org/10.2174/092986711795590110 [PubMed]
- 31. Ma HT, Poon RY. Aurora kinases and DNA damage response. Mutat Res. 2020; 821:111716. https://doi.org/10.1016/j.mrfmmm.2020.111716 [PubMed]
- 32. Borisa AC, Bhatt HG. A comprehensive review on Aurora kinase: small molecule inhibitors and clinical trial studies. Eur J Med Chem. 2017; 140:1–19. https://doi.org/10.1016/j.ejmech.2017.08.045 [PubMed]
- 33. Elsayed I, Wang X. PLK1 inhibition in cancer therapy: potentials and challenges. Future Med Chem. 2019; 11:1383–86. https://doi.org/10.4155/fmc-2019-0084 [PubMed]
- 34. Gatz SA, Aladowicz E, Casanova M, Chisholm JC, Kearns PR, Fulda S, Geoerger B, Schäfer BW, Shipley JM. A perspective on polo-like kinase-1 inhibition for the treatment of rhabdomyosarcomas. Front Oncol. 2019; 9:1271. https://doi.org/10.3389/fonc.2019.01271 [PubMed]
- 35. Polager S, Ginsberg D. E2F - at the crossroads of life and death. Trends Cell Biol. 2008; 18:528–35. https://doi.org/10.1016/j.tcb.2008.08.003 [PubMed]
- 36. Gao Z, Shi R, Yuan K, Wang Y. Expression and prognostic value of E2F activators in NSCLC and subtypes: a research based on bioinformatics analysis. Tumour Biol. 2016; 37:14979–87. https://doi.org/10.1007/s13277-016-5389-z [PubMed]
- 37. Narita M, Nũnez S, Heard E, Narita M, Lin AW, Hearn SA, Spector DL, Hannon GJ, Lowe SW. Rb-mediated heterochromatin formation and silencing of E2F target genes during cellular senescence. Cell. 2003; 113:703–16. https://doi.org/10.1016/s0092-8674(03)00401-x [PubMed]
- 38. Aksoy O, Chicas A, Zeng T, Zhao Z, McCurrach M, Wang X, Lowe SW. The atypical E2F family member E2F7 couples the p53 and RB pathways during cellular senescence. Genes Dev. 2012; 26:1546–57. https://doi.org/10.1101/gad.196238.112 [PubMed]
- 39. Urrutia E, Chen H, Zhou Z, Zhang NR, Jiang Y. Integrative pipeline for profiling DNA copy number and inferring tumor phylogeny. Bioinformatics. 2018; 34:2126–28. https://doi.org/10.1093/bioinformatics/bty057 [PubMed]
- 40. Lin Y, Liang R, Qiu Y, Lv Y, Zhang J, Qin G, Yuan C, Liu Z, Li Y, Zou D, Mao Y. Expression and gene regulation network of RBM8A in hepatocellular carcinoma based on data mining. Aging (Albany NY). 2019; 11:423–47. https://doi.org/10.18632/aging.101749 [PubMed]
- 41. Yoshihara K, Shahmoradgoli M, Martínez E, Vegesna R, Kim H, Torres-Garcia W, Treviño V, Shen H, Laird PW, Levine DA, Carter SL, Getz G, Stemke-Hale K, et al. Inferring tumour purity and stromal and immune cell admixture from expression data. Nat Commun. 2013; 4:2612. https://doi.org/10.1038/ncomms3612 [PubMed]
- 42. Aran D, Sirota M, Butte AJ. Systematic pan-cancer analysis of tumour purity. Nat Commun. 2015; 6:8971. https://doi.org/10.1038/ncomms9971 [PubMed]
- 43. Li X, Wenes M, Romero P, Huang SC, Fendt SM, Ho PC. Navigating metabolic pathways to enhance antitumour immunity and immunotherapy. Nat Rev Clin Oncol. 2019; 16:425–41. https://doi.org/10.1038/s41571-019-0203-7 [PubMed]
- 44. Cai L, Lin S, Girard L, Zhou Y, Yang L, Ci B, Zhou Q, Luo D, Yao B, Tang H, Allen J, Huffman K, Gazdar A, et al. LCE: an open web portal to explore gene expression and clinical associations in lung cancer. Oncogene. 2019; 38:2551–64. https://doi.org/10.1038/s41388-018-0588-2 [PubMed]
- 45. Tang Z, Li C, Kang B, Gao G, Li C, Zhang Z. GEPIA: a web server for cancer and normal gene expression profiling and interactive analyses. Nucleic Acids Res. 2017; 45:W98–102. https://doi.org/10.1093/nar/gkx247 [PubMed]
- 46. Chandrashekar DS, Bashel B, Balasubramanya SA, Creighton CJ, Ponce-Rodriguez I, Chakravarthi BV, Varambally S. UALCAN: a portal for facilitating tumor subgroup gene expression and survival analyses. Neoplasia. 2017; 19:649–58. https://doi.org/10.1016/j.neo.2017.05.002 [PubMed]
- 47. Uhlen M, Zhang C, Lee S, Sjöstedt E, Fagerberg L, Bidkhori G, Benfeitas R, Arif M, Liu Z, Edfors F, Sanli K, von Feilitzen K, Oksvold P, et al. A pathology atlas of the human cancer transcriptome. Science. 2017; 357:eaan2507. https://doi.org/10.1126/science.aan2507 [PubMed]
- 48. Vasaikar SV, Straub P, Wang J, Zhang B. LinkedOmics: analyzing multi-omics data within and across 32 cancer types. Nucleic Acids Res. 2018; 46:D956–63. https://doi.org/10.1093/nar/gkx1090 [PubMed]
- 49. Gao J, Aksoy BA, Dogrusoz U, Dresdner G, Gross B, Sumer SO, Sun Y, Jacobsen A, Sinha R, Larsson E, Cerami E, Sander C, Schultz N. Integrative analysis of complex cancer genomics and clinical profiles using the cBioPortal. Sci Signal. 2013; 6:pl1. https://doi.org/10.1126/scisignal.2004088 [PubMed]
- 50. Zhou G, Soufan O, Ewald J, Hancock RE, Basu N, Xia J. NetworkAnalyst 3.0: a visual analytics platform for comprehensive gene expression profiling and meta-analysis. Nucleic Acids Res. 2019; 47:W234–41. https://doi.org/10.1093/nar/gkz240 [PubMed]
- 51. Ru B, Wong CN, Tong Y, Zhong JY, Zhong SS, Wu WC, Chu KC, Wong CY, Lau CY, Chen I, Chan NW, Zhang J. TISIDB: an integrated repository portal for tumor-immune system interactions. Bioinformatics. 2019; 35:4200–02. https://doi.org/10.1093/bioinformatics/btz210 [PubMed]