


Introduction
Hypertension, also known as high blood pressure, is one of the critical public health problem in the world [1, 2]. In 2014, approximately one billion adults had hypertension [3]. The prevalence of hypertension in China continues to rise, with more than 200 million people in 2015 [4]. Indeed, hypertension is a major cause of premature deaths in China [4–6]. Several cohort studies have found a U-shaped relationship between BMI and all-cause mortality in hypertensive patients, which means that both relatively low and high BMI will increase mortality [7, 8]. Overweight and obesity are associated with various cardiovascular disease risk factors and increased cardiovascular events [9, 10]. Cardiovascular death is a leading cause of death among hypertensive patients [11–13]. However, the research on the relationship between BMI and CVD-specific mortality in a hypertensive population is relatively limited, and the conclusions from these studies are inconsistent [14]. In people with hypertension and left ventricular hypertrophy, cardiovascular death was more likely in the thin and obese groups than in the normal body weight groups [15]. However, a prospective cohort study on men with hypertension in Texas demonstrated that men with high cardiorespiratory fitness level and obese men have no greater risk of CVD-specific-mortality compared with normal body weight counterparts [16]. Among patients with the risk of cardiac failure, those with a BMI in the range of 30.0–34.9 had lower mortality than those considered to have an ideal weight. The term “obesity paradox” refers to the above observations and the increased survival among obese patients. Due to the high prevalence of hypertension and the great number of hypertensive patients in China, it is imperative to advance understanding about the association between BMI and CVD-specific mortality in this population. This will allow for appropriate weight management advice for hypertensive patients from the perspective of reducing CVD-specific mortality.
Given the limited exploration of this issue in the Chinese population, this study aimed to explore the relationship between baseline BMI and cardiovascular mortality risk in a hypertensive populations using a retrospective cohort in Shanghai, China.
Results
This study included 212,394 patients with hypertension, with an average age of 63.3 years, ranging from 20 to 85 years. A total of 14,029 hypertensive individuals, including 6,943 men and 7,086 women, died of CVD during an average follow-up period of 8.24 years or 1,643,007 person-years. Comparing between different BMI categories reveal significant differences in demographic characteristics, lifestyle, clinical characteristics, and family history of chronic disease. Compared with other BMI categories, patients classified as underweight have lower rates of concomitant diabetes, family history of chronic diseases, smoking and drinking (Table 1).
Table 1. Baseline characteristics according to BMI categories in people with hypertension.
| Characteristic | BMI (WHO category, kg/m2) | P-value | |||||||||||||||||||||||||||||||||||||||||||||||||||||||||||||||||||||||||||||||||||||||||||||||||
| <18.5 (N=5120) | 18.5-24.9 (N=130530) | 25.0-29.9 (N=68583) | ≥30.0 (N=8161) | ||||||||||||||||||||||||||||||||||||||||||||||||||||||||||||||||||||||||||||||||||||||||||||||||
| Age (x̄±SD, year) | 69.9±10.8 | 64.0±10.8 | 61.6±10.6 | 60.1±11.5 | <0.001 | ||||||||||||||||||||||||||||||||||||||||||||||||||||||||||||||||||||||||||||||||||||||||||||||
| < 60 years | 1022(19.9) | 49739(38.1) | 31808(46.4) | 3838(47.0) | <0.001 | ||||||||||||||||||||||||||||||||||||||||||||||||||||||||||||||||||||||||||||||||||||||||||||||
| ≥ 60 years | 4098(80.1) | 80791(61.9) | 36775(53.6) | 4323(53.0) | |||||||||||||||||||||||||||||||||||||||||||||||||||||||||||||||||||||||||||||||||||||||||||||||
| Follow-up time (years) | 7.5±3.2 | 8.2±2.8 | 8.4±2.7 | 8.2±2.7 | <0.001 | ||||||||||||||||||||||||||||||||||||||||||||||||||||||||||||||||||||||||||||||||||||||||||||||
| Sex (%) | |||||||||||||||||||||||||||||||||||||||||||||||||||||||||||||||||||||||||||||||||||||||||||||||||||
| Male | 2096(40.9) | 60655(46.5) | 33123(48.3) | 3164(38.8) | <0.001 | ||||||||||||||||||||||||||||||||||||||||||||||||||||||||||||||||||||||||||||||||||||||||||||||
| Female | 3024(59.1) | 69875(53.5) | 35460(51.7) | 4997(61.2) | |||||||||||||||||||||||||||||||||||||||||||||||||||||||||||||||||||||||||||||||||||||||||||||||
| SBP (x̄±SD) | 155.3±15.5 | 154.2±14.8 | 155.3±15.6 | 157.1±16.5 | <0.001 | ||||||||||||||||||||||||||||||||||||||||||||||||||||||||||||||||||||||||||||||||||||||||||||||
| DBP(x̄±SD) | 92.1±9.3 | 93.2±8.9 | 94.8±9.5 | 95.6±10.1 | <0.001 | ||||||||||||||||||||||||||||||||||||||||||||||||||||||||||||||||||||||||||||||||||||||||||||||
| Concomitant diabetes | |||||||||||||||||||||||||||||||||||||||||||||||||||||||||||||||||||||||||||||||||||||||||||||||||||
| Yes | 697(13.6) | 21688(16.6) | 13188(19.2) | 1854(22.7) | <0.001 | ||||||||||||||||||||||||||||||||||||||||||||||||||||||||||||||||||||||||||||||||||||||||||||||
| No | 4423(86.4) | 108842(83.4) | 55395(80.8) | 6307(77.3) | |||||||||||||||||||||||||||||||||||||||||||||||||||||||||||||||||||||||||||||||||||||||||||||||
| CVD death | |||||||||||||||||||||||||||||||||||||||||||||||||||||||||||||||||||||||||||||||||||||||||||||||||||
| Yes | 796(15.6) | 9143(7.0) | 3625(5.3) | 465(5.7) | <0.001 | ||||||||||||||||||||||||||||||||||||||||||||||||||||||||||||||||||||||||||||||||||||||||||||||
| No | 4324(84.4) | 121387(93.0) | 64958(94.7) | 7696(94.3) | |||||||||||||||||||||||||||||||||||||||||||||||||||||||||||||||||||||||||||||||||||||||||||||||
| Family history of hypertension (%) | |||||||||||||||||||||||||||||||||||||||||||||||||||||||||||||||||||||||||||||||||||||||||||||||||||
| Yes | 1654(32.3) | 53654(41.1) | 32659(47.6) | 4054(49.7) | <0.001 | ||||||||||||||||||||||||||||||||||||||||||||||||||||||||||||||||||||||||||||||||||||||||||||||
| No | 3466(67.7) | 76876(58.9) | 35924(52.4) | 4107(50.3) | |||||||||||||||||||||||||||||||||||||||||||||||||||||||||||||||||||||||||||||||||||||||||||||||
| Family history of CVD (%) | |||||||||||||||||||||||||||||||||||||||||||||||||||||||||||||||||||||||||||||||||||||||||||||||||||
| Yes | 110(2.2) | 3219(2.5) | 2179(3.2) | 330(4.0) | <0.001 | ||||||||||||||||||||||||||||||||||||||||||||||||||||||||||||||||||||||||||||||||||||||||||||||
| No | 5010(97.8) | 127311(97.5) | 66404(96.8) | 7831(96.0) | |||||||||||||||||||||||||||||||||||||||||||||||||||||||||||||||||||||||||||||||||||||||||||||||
| Family history of stroke (%) | |||||||||||||||||||||||||||||||||||||||||||||||||||||||||||||||||||||||||||||||||||||||||||||||||||
| Yes | 110(2.2) | 3385(2.6) | 2217(3.2) | 280(3.4) | <0.001 | ||||||||||||||||||||||||||||||||||||||||||||||||||||||||||||||||||||||||||||||||||||||||||||||
| No | 5010(97.8) | 127145(97.4) | 66366(96.8) | 7881(96.6) | |||||||||||||||||||||||||||||||||||||||||||||||||||||||||||||||||||||||||||||||||||||||||||||||
| Family history of diabetes (%) | |||||||||||||||||||||||||||||||||||||||||||||||||||||||||||||||||||||||||||||||||||||||||||||||||||
| Yes | 177(3.5) | 6422(4.9) | 4607(6.7) | 615(7.5) | <0.001 | ||||||||||||||||||||||||||||||||||||||||||||||||||||||||||||||||||||||||||||||||||||||||||||||
| No | 4943(96.5) | 124108(95.1) | 63976(93.3) | 7546(92.5) | |||||||||||||||||||||||||||||||||||||||||||||||||||||||||||||||||||||||||||||||||||||||||||||||
| Exercise (%) | |||||||||||||||||||||||||||||||||||||||||||||||||||||||||||||||||||||||||||||||||||||||||||||||||||
| Never | 2043(39.9) | 41336(31.7) | 22079(32.2) | 2926(35.9) | <0.001 | ||||||||||||||||||||||||||||||||||||||||||||||||||||||||||||||||||||||||||||||||||||||||||||||
| Sometimes | 2054(40.1) | 57742(44.2) | 30191(44.0) | 3487(42.7) | |||||||||||||||||||||||||||||||||||||||||||||||||||||||||||||||||||||||||||||||||||||||||||||||
| Everyday | 1023(20.0) | 31452(24.1) | 16313(23.79) | 1748(21.4) | |||||||||||||||||||||||||||||||||||||||||||||||||||||||||||||||||||||||||||||||||||||||||||||||
| Smoke (%) | |||||||||||||||||||||||||||||||||||||||||||||||||||||||||||||||||||||||||||||||||||||||||||||||||||
| Yes | 867(16.9) | 26264(20.1) | 16108(23.5) | 1624(19.9) | <0.001 | ||||||||||||||||||||||||||||||||||||||||||||||||||||||||||||||||||||||||||||||||||||||||||||||
| Never | 4253(83.1) | 104266(79.9) | 52475(76.5) | 6537(80.1) | |||||||||||||||||||||||||||||||||||||||||||||||||||||||||||||||||||||||||||||||||||||||||||||||
| Drink (%) | |||||||||||||||||||||||||||||||||||||||||||||||||||||||||||||||||||||||||||||||||||||||||||||||||||
| Never | 4424(86.4) | 104320(79.9) | 52218(76.1) | 6546(80.2) | <0.001 | ||||||||||||||||||||||||||||||||||||||||||||||||||||||||||||||||||||||||||||||||||||||||||||||
| Sometimes | 430(8.4) | 17304(13.3) | 10332(15.1) | 978(12.0) | |||||||||||||||||||||||||||||||||||||||||||||||||||||||||||||||||||||||||||||||||||||||||||||||
| Always | 266(5.2) | 8906(6.8) | 6033(8.8) | 637(7.8) | |||||||||||||||||||||||||||||||||||||||||||||||||||||||||||||||||||||||||||||||||||||||||||||||
| Abbreviations: BMI: body mass index; SD: standard deviation; SBP: systolic blood pressure; DBP: diastolic blood pressure; CVD: cardiovascular disease. | |||||||||||||||||||||||||||||||||||||||||||||||||||||||||||||||||||||||||||||||||||||||||||||||||||
The HRs and 95% CIs across BMI categories for CVD-specific mortality were 1.37 (1.22–1.53), 1.00 (reference), 0.95 (0.90–1.01), and 1.21 (1.04–1.40) in men with a BMI of < 18.5, 18.5–24.9, 25–29.9, or ≥ 30 kg/m2, respectively. The corresponding HRs for women were 1.44 (1.31–1.59), 1.00 (reference), 0.96 (0.91–1.01), and 1.04 (0.92–1.17). Compared with individuals with a baseline BMI of 18.5 to 24.9 kg/m2, women that were under-weight and men that were under-weight or obese had increased CVD-specific mortality (Table 2).
Table 2. Hazard ratio and 95% confidence intervals for CVD-specific mortality of different sex in people with hypertension according to BMI category.
| BMI(kg/m2) | Overall | P-value | |||||||||||||||||||||||||||||||||||||||||||||||||||||||||||||||||||||||||||||||||||||||||||||||||
| <18.5 (N=5120) | 18.5-24.9 (N=130530) | 25.0-29.9 (N=68583) | ≥30.0 (N=8161) | ||||||||||||||||||||||||||||||||||||||||||||||||||||||||||||||||||||||||||||||||||||||||||||||||
| Male | 2096 | 60655 | 33123 | 3164 | 99038 | ||||||||||||||||||||||||||||||||||||||||||||||||||||||||||||||||||||||||||||||||||||||||||||||
| Deaths, n | 332 | 4645 | 1784 | 182 | 6943 | ||||||||||||||||||||||||||||||||||||||||||||||||||||||||||||||||||||||||||||||||||||||||||||||
| Person-y | 15065 | 485143 | 271914 | 25151 | 797272 | ||||||||||||||||||||||||||||||||||||||||||||||||||||||||||||||||||||||||||||||||||||||||||||||
| Mortality/100,000 person-y | 2204 | 957 | 656 | 724 | 871 | < 0.01 | |||||||||||||||||||||||||||||||||||||||||||||||||||||||||||||||||||||||||||||||||||||||||||||
| HR(95% CI)* | 1.37(1.22-1.53) | 1.00 | 0.95(0.90-1.01) | 1.21(1.04-1.40) | |||||||||||||||||||||||||||||||||||||||||||||||||||||||||||||||||||||||||||||||||||||||||||||||
| Female | 3024 | 69875 | 35460 | 4997 | 113356 | ||||||||||||||||||||||||||||||||||||||||||||||||||||||||||||||||||||||||||||||||||||||||||||||
| Deaths, n | 464 | 4498 | 1841 | 283 | 7086 | ||||||||||||||||||||||||||||||||||||||||||||||||||||||||||||||||||||||||||||||||||||||||||||||
| Person-y | 23377 | 582636 | 304098 | 42155 | 952266 | ||||||||||||||||||||||||||||||||||||||||||||||||||||||||||||||||||||||||||||||||||||||||||||||
| Mortality/100,000 person-y | 1985 | 772 | 605 | 671 | 744 | < 0.01 | |||||||||||||||||||||||||||||||||||||||||||||||||||||||||||||||||||||||||||||||||||||||||||||
| HR(95% CI)* | 1.44(1.31-1.59) | 1 | 0.96(0.91-1.01) | 1.04(0.92-1.17) | |||||||||||||||||||||||||||||||||||||||||||||||||||||||||||||||||||||||||||||||||||||||||||||||
| Abbreviations: CVD: cardiovascular disease; BMI: body mass index; CI: confidence interval; HR: hazard ratio. | |||||||||||||||||||||||||||||||||||||||||||||||||||||||||||||||||||||||||||||||||||||||||||||||||||
| *Adjusted for sex, age at registry, systolic blood pressure, diastolic blood pressure, concomitant diabetes, family history of diabetes, family history of hypertension, family history of stroke, family history of CVD, smoking, drinking and physical activity. | |||||||||||||||||||||||||||||||||||||||||||||||||||||||||||||||||||||||||||||||||||||||||||||||||||
Figure 1 shows the cumulative CVD-specific mortality rates for different BMI categories in men and women with hypertension. In each BMI category, CVD-specific mortality increased with a decrease in BMI in both men and women (log-rank test, P < 0.001).
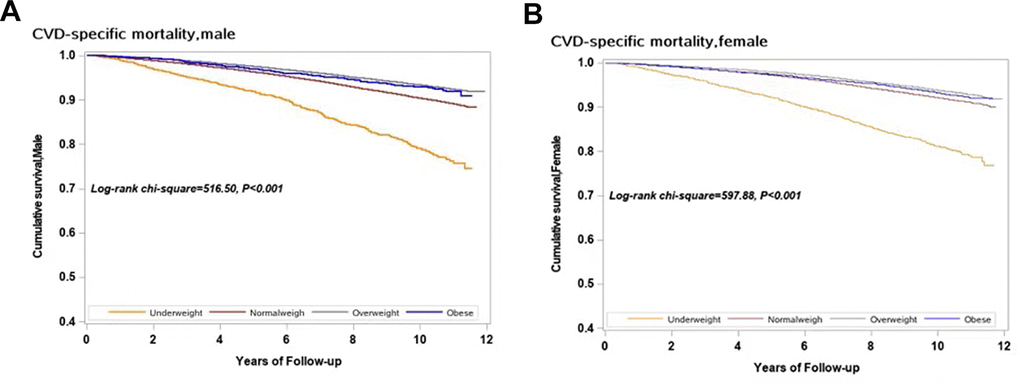
Figure 1. Survival curves with regard to different categories of BMI in both sexes for CVD specific mortality. (A) Male; (B) Female.
A U-shaped relationship between BMI and CVD-specific mortality in hypertensive subjects was observed, as shown in Figure 2. Taking a BMI of 25 kg/m2 as a reference, men with BMI≤22.46 or ≥29.34 kg/m2 and women with BMI≤22.03 or ≥29.59 kg/m2 have significantly increased risk of CVD-specific death. By using 25kg/m2 as the reference value, the risk of death from CVD in men near the first percentile of BMI (17.65 kg/m2) increased by 34% (HR: 1.34, 95% CI: 1.23–1.47) and the risk of men near the 80th percentile of BMI (26.47 kg/m2) increased by 4% (HR: 1.04, 95% CI, 1.01–1.06), as shown in Table 3. Similarly, the risk of death from CVD in women near the first percentile of BMI (17.58 kg/m2) is increased by 47% (HR: 1.47, 95% CI, 1.36–1.59), and the risk of women near the 80th percentile BMI (26.67 kg/m2) increased by 3% (HR: 1.03, 95% CI, 1.01–1.05).
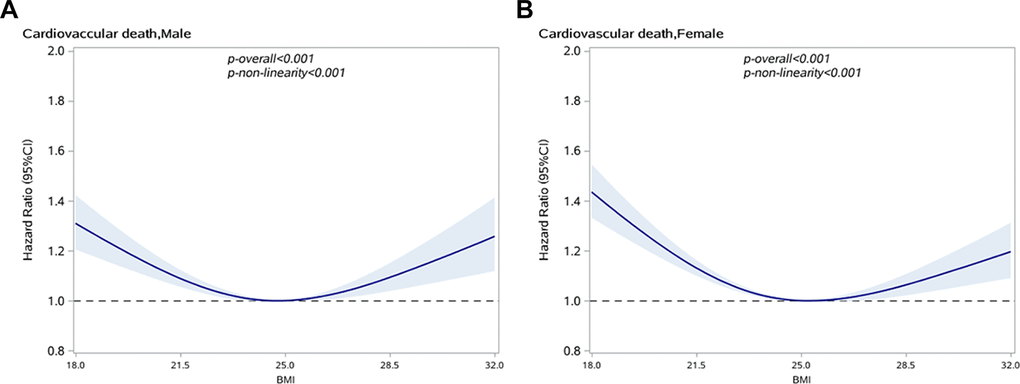
Figure 2. Association between BMI and CVD specific mortality in people with hypertension by sex. (A) Male; (B) Female.
Table 3. Hazard ratios and 95% confidence intervals for BMI in association with CVD-specific mortality in people with hypertension of different sex.
| BMI | Male | Female | |||||||||||||||||||||||||||||||||||||||||||||||||||||||||||||||||||||||||||||||||||||||||||||||||
| Value | HR | 95%CI | Patients at risk, n | Mortality/100,000 person-y | Value | HR | 95%CI | Patients at risk, n | Mortality/100,000 person-y | ||||||||||||||||||||||||||||||||||||||||||||||||||||||||||||||||||||||||||||||||||||||||||
| 10th percentile | 20.76 | 1.13 | 1.09-1.18 | 9 318 | 1 589 | 20.28 | 1.23 | 1.18-1.29 | 1.23 | 1.18-1.29 | |||||||||||||||||||||||||||||||||||||||||||||||||||||||||||||||||||||||||||||||||||||||||
| 20th percentile | 21.97 | 1.08 | 1.05-1.11 | 9 819 | 1 110 | 21.48 | 1.14 | 1.11-1.18 | 1.14 | 1.11-1.18 | |||||||||||||||||||||||||||||||||||||||||||||||||||||||||||||||||||||||||||||||||||||||||
| 30th percentile | 22.72 | 1.04 | 1.02-1.06 | 10 462 | 976 | 22.43 | 1.08 | 1.06-1.10 | 1.08 | 1.06-1.10 | |||||||||||||||||||||||||||||||||||||||||||||||||||||||||||||||||||||||||||||||||||||||||
| 40th percentile | 23.45 | 1.01 | 0.99-1.02 | 9 991 | 892 | 23.23 | 1.02 | 1.00-1.03 | 1.02 | 1.00-1.03 | |||||||||||||||||||||||||||||||||||||||||||||||||||||||||||||||||||||||||||||||||||||||||
| 50th percentile | 24.22 | 1.00 | 1.00-1.01 | 9 640 | 790 | ||||||||||||||||||||||||||||||||||||||||||||||||||||||||||||||||||||||||||||||||||||||||||||||
| Reference | 25.00 | 1.00 | 25.00 | 1.00 | 1.00 | ||||||||||||||||||||||||||||||||||||||||||||||||||||||||||||||||||||||||||||||||||||||||||||||
| 60th percentile | 24.77 | 0.99 | 0.99-1.00 | 9 475 | 769 | 24.65 | 0.99 | 0.99-1.00 | 0.99 | 0.99-1.00 | |||||||||||||||||||||||||||||||||||||||||||||||||||||||||||||||||||||||||||||||||||||||||
| 70th percentile | 25.61 | 1.02 | 1.01-1.03 | 10 405 | 714 | 25.48 | 1.01 | 1.00-1.02 | 1.01 | 1.00-1.02 | |||||||||||||||||||||||||||||||||||||||||||||||||||||||||||||||||||||||||||||||||||||||||
| 80th percentile | 26.47 | 1.04 | 1.01-1.06 | 10 089 | 674 | 26.67 | 1.03 | 1.01-1.05 | 1.03 | 1.01-1.05 | |||||||||||||||||||||||||||||||||||||||||||||||||||||||||||||||||||||||||||||||||||||||||
| 90th percentile | 27.77 | 1.07 | 1.03-1.12 | 9 908 | 623 | 28.13 | 1.06 | 1.02-1.10 | 1.06 | 1.02-1.10 | |||||||||||||||||||||||||||||||||||||||||||||||||||||||||||||||||||||||||||||||||||||||||
| Abbreviations: CVD: cardiovascular disease; BMI: body mass index; CI: confidence interval; HR: hazard ratio. | |||||||||||||||||||||||||||||||||||||||||||||||||||||||||||||||||||||||||||||||||||||||||||||||||||
| *Adjusted for sex, age at registry, systolic blood pressure, diastolic blood pressure, concomitant diabetes, family history of diabetes, family history of hypertension, family history of stroke, family history of CVD, smoking, drinking and physical activity. | |||||||||||||||||||||||||||||||||||||||||||||||||||||||||||||||||||||||||||||||||||||||||||||||||||
We also performed a stratified analysis of age (<45, 45–59 years, 60–74 years, and ≥75 years) to identify the changes in the relationship between BMI and CVD-specific mortality in different age groups. The association between BMI and CVD-specific mortality was attenuated in men under 45 years and over 60 years and in women under 60 years, as shown in Figure 3. In older age groups, the risk of CVD-specific mortality for overweight and obese individuals was lower than in normal BMI individuals. The results remained unchanged in sensitivity analysis when excluding people who died within 2 years of enrollment, as shown in Supplementary Figure 1.
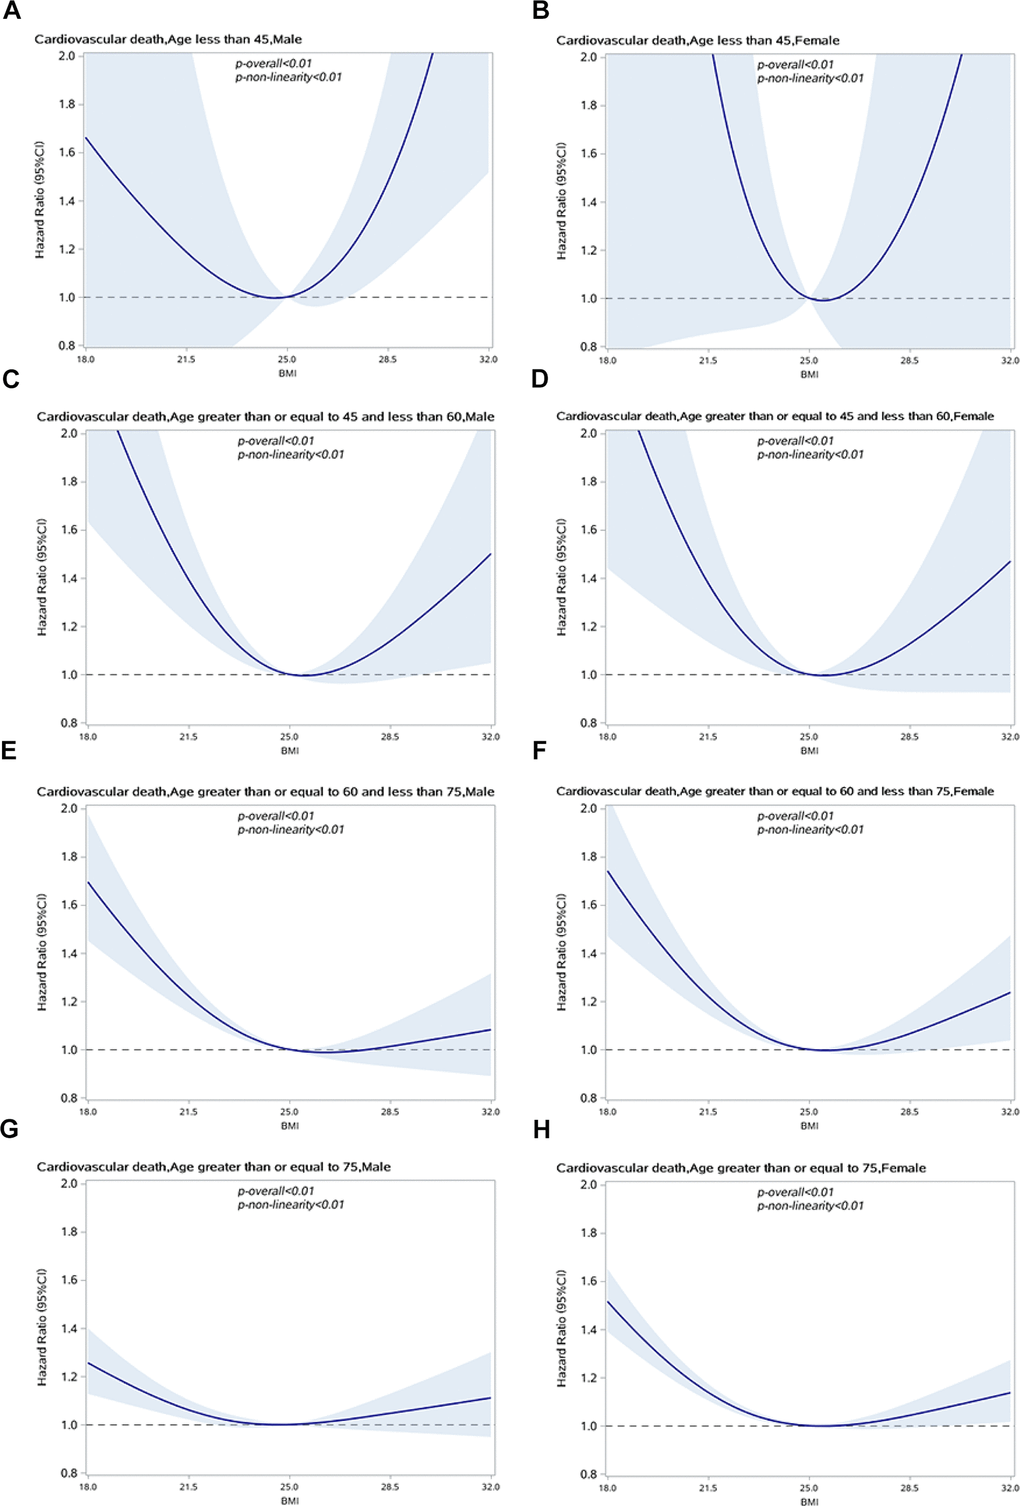
Figure 3. Association between BMI and CVD specific mortality in people with hypertension by sex and age group. (A) Male, age<45; (B) Female, age<45; (C) Male, 45<=age<60; (D) Female, 45<=age<60; (E) Male, 60<=age<75; (F) Female,60<=age<75; (G) Male, age>70; (H) Female, age>70.
Discussion
We found a U-shaped relationship between BMI and the risk of CVD-specific mortality among patients with hypertension in this community-based retrospective cohort study in Shanghai.
An intervention study in a hypertensive population identified an increased risk of cardiovascular mortality in both thin and moderate to-severely obese individuals with hypertension and left ventricular hypertrophy in Europe [15]. Among patients with coronary heart disease, overweight and obese patients have lower all-cause mortality and CVD-specific mortality than normal weight patients [17]. Studies assessing the association between BMI and CVD-specific mortality in Chinese hypertensive patients have been limited, and the results have been inconsistent. A prospective cohort study conducted in Beijing involving 2,535 hypertensive patients aged 40–91 found a U-shaped relationship between BMI and CVD death [7]. However, the sample size of this study was insufficiently powered, and there may be unaccounted confounding factors such as physical activity and dietary factors that bias the results of the study. A study based on community hypertension patients in Xinzhuang, Minhang District found that BMI was not associated with CVD death among elderly hypertensive patients aged 60 years or older [18]. The sample comprised 10,957 individuals and 242 cardiovascular deaths were documented. BMI was used as a categorical variable in the Cox regression to determine the risk of CVD death, and the HR was calculated for each category. However, in order to observe the nonlinear relationship between BMI and CVD-specific mortality, BMI was not considered to be a continuous variable.
Since CVD is a chronic condition, observed deaths from CVD require longer follow-up time. Compared with other studies of hypertensive patients, ours had a larger sample size, a longer follow-up period, and a wider range of age. We used BMI as a continuous variable, and incorporated restricted cubic splines to the model to explore the nonlinear relationship between BMI and CVD death. Moreover, the possible confounding factors included in our analysis were more comprehensive. Previous studies have suggested that age should be used as an effect modifier in the relationship between BMI and all-cause mortality [19, 20]. Our study showed that the association between BMI and CVD-specific mortality is different in hypertensive patients of different age groups, thus confirming the modifying effect of age. In older people, overweight and obesity are potential factors that reduce the risk of CVD death. Similar findings were found in patients with heart disease, which is consistent with the obesity paradox [21, 22].
Several biological mechanisms may underlie the observed associations. The evidence for the association between obesity and high cardiovascular risk is compelling [23, 24], largely because in most cases, obesity is accompanied by metabolic syndrome [25]. Obesity increases the workload of the heart, thereby leading to the development of left ventricular hypertrophy, which is associated with poor prognosis [26, 27]. Moreover, there is increasing evidence that severe obesity is associated with the activation of inflammatory mechanisms [28, 29] that increase vascular thromboxane receptor gene expression, as well as the level of fibrinogen. This in turn may accelerate the progression of cardiovascular disease. The circulating markers activated by inflammation are mainly manifested in the fat distribution in the center of the body, and the damage of central obesity to the target organs is greater than the damage associated with peripheral body fat distribution [30, 31]. Low body weight can be harmful to the human body in many aspects. Studies have shown that low body weight may increase the risk of cardiovascular events [8]. In the older population, low body weight is often accompanied by poor nutrition, which further leads to reduced physiological function and survival [32]. At the same time, cardiac cachexia and physical weakness are also related to low body weight in the older population [33]. Previous studies have demonstrated that the increased metabolic reserve in overweight patients have a protective effect [22, 34], and that overweight patients are more motivated in self-health management and medication [35]. These physiological reactions, biochemical reactions and behavioral changes can be regarded as an explanation for the obesity paradox.
Several strengths of our study warrant mention. Our retrospective cohort study design, sample size (n = 212,394), and death events (n = 14,029) were sufficient to obtain reliable study results. Cox proportional hazard models with restricted cubic splines (RCS) were used to test potential non-linear relationships with high statistical reliability. Stratified analysis allows the assessment of possible sex differences in order to rule out the confounding effects of age associated with BMI and mortality. There are also a few limitations to our investigation. First, the BMI of hypertensive patients was calculated by self-reported weight and height, collected at different times and locations, without uniform measurement. These assessments may be subject to recall bias. Second, when assessing the relationship between BMI and mortality, only baseline BMI was included. However, with the prolongation of the disease course or disease management, the BMI of hypertensive patients may change over time. Third, we did not collect information on waist circumference and body fat percentage, so the impact of central obesity and abdominal obesity on CVD-specific mortality could not be assessed. Fourth, the number of patients with BMI <18.5 kg/m2 or ≥ 30kg/m2 was relatively small in this study population, especially after stratifying by age, which further reduced the statistical power of the results.
Hypertensive patients are a large population with a high risk of CVD death. Regular follow-up management of hypertensive patients by community doctors is a basic public health service in China. Our results clarify the association between BMI and the risk of CVD-specific mortality, and provide an appropriate BMI range within which CVD-specific mortality is reduced in hypertensive patients of both sexes. It is helpful for community doctors to carry out targeted weight management of hypertension patients and make patients aware of the early warning signs of cardiovascular disease.
In conclusion, this study demonstrates a U-shaped relationship between BMI and CVD risk of death in male and female patients with hypertension. Our findings may provide scientific guidance for weight management in patients with hypertension.
Materials and Methods
Study population
We conducted a population-based retrospective cohort study, which was based on the Minhang hypertension standardization management system. Since 2007, Minhang District, with 1 million permanent residents, has made standardized management of hypertensive patients a basic community health care service. During the period from 2007 to 2015, a total of 260,416 adults with hypertension were enrolled for standardized management and examined by a general practitioner in 13 community health service centers. All participants were followed up with respect to the three following factors: cardiovascular death, emigration, or December 31, 2018, whichever occurred first. Our study included 212,394 subjects aged 20–85 years, including 99,038 men and 113,356 women, after excluding patients with duplicate or abnormal ID numbers, abnormal names, missing or abnormal BMI, lack of information regarding factors related to risk, cases who were not permanent residents, and with less than 3 months of follow-up (Figure 4).
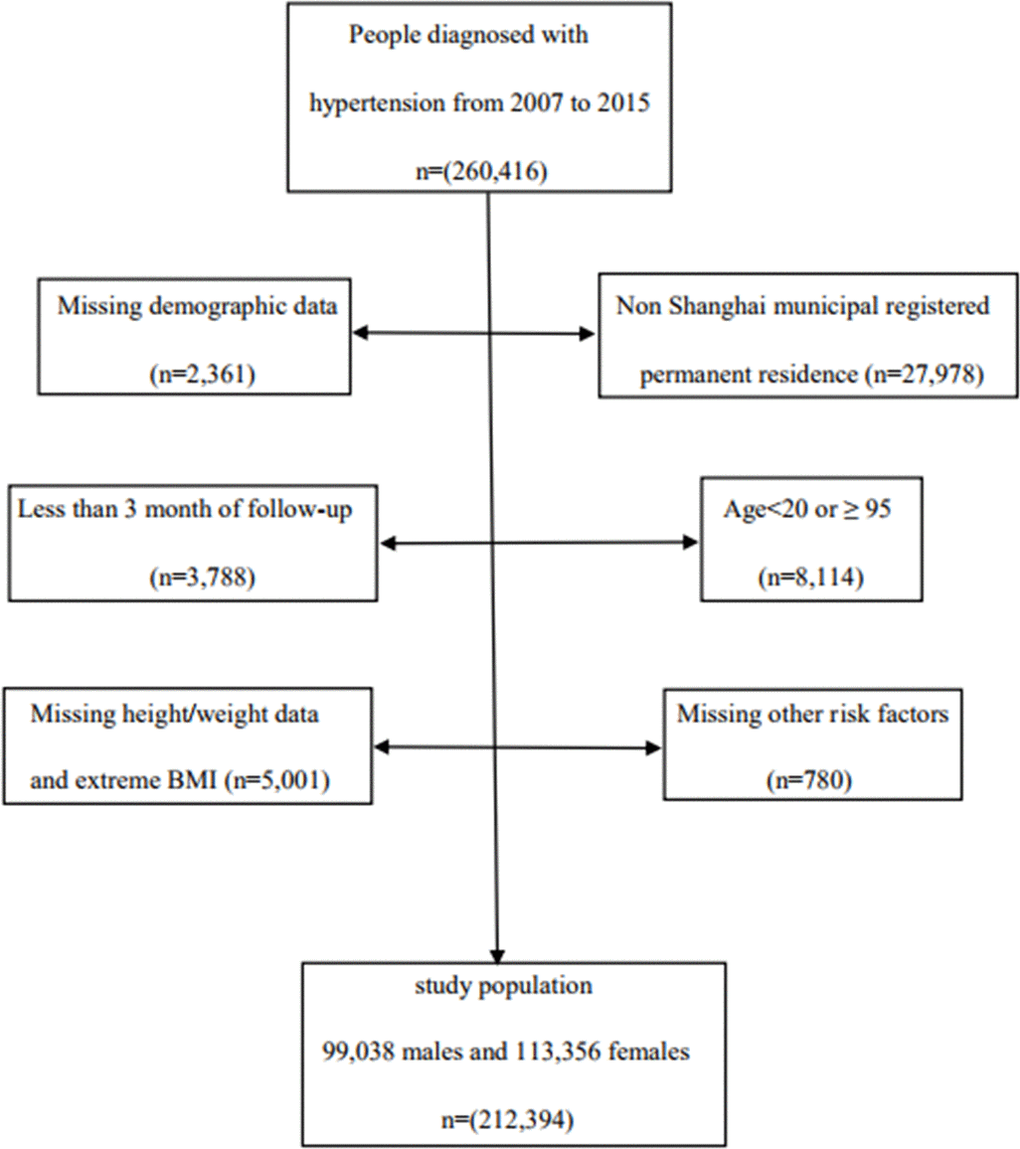
Figure 4. Flow chart of study population.
Data sources
The diagnosis of hypertension is based on the 1999 WHO/ISH (World Health Organization/International Hypertension Federation) guidelines for the prevention and treatment of hypertension, wherein a blood pressure above 140/90 mmHg is defined as hypertension. After the participant sat quietly for five minutes, mercury sphygmomanometer was used to measure three blood pressure readings on different days according to a standard protocol. When these participants were registered in the Community Health Service Center, baseline information on demographic factors, daily exercise, smoking, drinking, family history of major chronic diseases, concomitant diabetes, self-reported standing height and body weight, and drugs used for hypertension treatment were collected and recorded in the electronic health record database in Minhang district of Shanghai, China [18, 36]. At the beginning of the follow-up period, information on the diagnosis of hypertension, weight, height, and other risk factors were verified for all participants by general practitioners. The staff of the Minhang District Center for Disease Control and Prevention randomly selected 10% of newly registered participants and verified the recorded information, including height and weight, via a telephonic interview.
Body mass index
BMI was calculated as self-reported body weight in kilograms divided by squared self-reported standing height in meters. In this study, we used the BMI classification set by the WHO: underweight (< 18.5 kg/m2), normal weight (18.5–24.9 kg/m2), overweight (25.0–29.9 kg/m2), and obesity (> 30.0 kg/m2).
Outcome
The occurrence of CVD-specific death was the end point of the study. The unique personal identification number assigned to all residents allowed accurate linkage to the Shanghai Vital Statistics. The outcome of interest, CVD-specific mortality, was identified using International Classification of Diseases (ICD-10) codes for the primary cause of death and were classified into disease groups of CVDs (ICD-10 codes I00-I99).
Covariates
Potential confounders, including sex (male/female), age at registry (continuous), systolic blood pressure (continuous), diastolic blood pressure (continuous), concomitant diabetes (yes/no), family history of diabetes (yes/no), family history of hypertension (yes/no), family history of stroke (yes/no), family history of CVD (yes/no), smoking (everyday, sometimes, quit, never), drinking (Everyday, always, sometimes, never), and physical activity (everyday, > once per week, sometimes, never) were considered covariates for this study.
Statistical analysis
Pearson’s chi-square test and Kruskal-Wallis test were used to analyze the characteristics of participants in different groups of BMI. We used the Kaplan-Meier method to compute cumulative incidence in different BMI groups of different sexes. Cox regression models were used to estimate HRs and assessed the association between different BMI groups and cardiovascular death among hypertensive subjects. The adjustment variables included were sex, age at registry enrollment, systolic blood pressure, diastolic blood pressure, concomitant diabetes, family history of stroke, family history of hypertension, family history of cardiovascular disease, family history of diabetes, smoking, drinking, and physical activity. We first evaluated the PH hypothesis of each variable in the Cox proportional hazards model, and used it as a three-section-restricted RCS by fitting the interaction between each variable and time [37]. Variables tested against the PH hypothesis included physical activity, diabetes comorbidity, and familial history of hypertension. After adjusting for variables that did not meet the PH hypothesis, according to the BMI category, HRs and 95% CIs of CVD-specific mortality were calculated. In addition, we used BMI as a continuous variable to estimate the potential curvilinear correlation between BMI and cardiovascular mortality by using RCS with decile intervals as fixed knots. In this process, two statistical tests were performed. A regression coefficient applied to the null hypothesis, that is, the linear and nonlinear terms of the factor are equal to zero – in other words, no correlation. Another is used for the regression coefficient of the nonlinear term, where P <0.05 represents the nonlinear association. Taking a BMI of 25.0 kg/m2 as a reference, the Cox regression model with RCS function was used to estimate the multivariate adjusted HRs and 95% CIs, and the associations were visually illustrated. We then conducted a stratified analysis based on sex and age. After excluding patients who died within 2 years of enrollment, sensitivity analysis was performed to reduce the influence of reverse causality.
All analyses were conducted using SAS (version 9.4; SAS Institute, Cary, NC, USA). All statistical tests were two-tailed, and P value of 0.05 was considered statistically significant.
Ethics approval and consent to participate
The study was approved by the Institutional Review Board of center for disease control and prevention in Minhang District, Shanghai (NO: EC-P-2019-009). Informed consent from participants involved in the study was waived due to the fact that anonymized data compiled from electronic medical records was applied in the study.
Data availability
The datasets generated and analyzed in the study are not publicly available but are available from the corresponding authors on reasonable request.
Supplementary Materials
Author Contributions
J. Hu and H. Xu drafted the paper. J. Zhu and H. Xu contributed to statistical analysis, J. Zhang, J .Li and L. Chen contributed to data collection and quality control. X. Liu and G. Qin contributed to study design, statistical analysis and revision of the paper. All authors approved the final version.
Acknowledgments
The authors would like to thank the study participants and the staff members of the Communities in Minhang District of Shanghai, China, for their contribution to the study.
Conflicts of Interest
There are no conflicts of interest to declare.
Funding
This study was supported by Shanghai Municipal Nature Science Foundation (19ZR1445900), Nature Science Foundation of Minhang district, Shanghai, China (2019MHZ043), the National Nature Science Foundation of China (NO: 11871164), and Health Consortium Foundation of Fudan University and Minhang District Health Committee (NO: 2019FM02). The funders/sponsor of this study had no role in the design and conduct of the study; collection, management, analysis and interpretation of the data; preparation, review or approval of the manuscript; or the decision to submit the manuscript for publication.
References
- 1. Kearney PM, Whelton M, Reynolds K, Muntner P, Whelton PK, He J. Global burden of hypertension: analysis of worldwide data. Lancet. 2005; 365:217–23. https://doi.org/10.1016/S0140-6736(05)17741-1 [PubMed]
- 2. Kearney PM, Whelton M, Reynolds K, Whelton PK, He J. Worldwide prevalence of hypertension: a systematic review. J Hypertens. 2004; 22:11–19. https://doi.org/10.1097/00004872-200401000-00003 [PubMed]
- 3. World Health Organization. Global Health Observatory (GHO) Data. 2016.
- 4. Fang L, Song J, Ma Z, Zhang L, Jing C, Chen D. Prevalence and characteristics of hypertension in mainland Chinese adults over decades: a systematic review. J Hum Hypertens. 2014; 28:649–56. https://doi.org/10.1038/jhh.2014.5 [PubMed]
- 5. He J, Gu D, Wu X, Reynolds K, Duan X, Yao C, Wang J, Chen CS, Chen J, Wildman RP, Klag MJ, Whelton PK. Major causes of death among men and women in China. N Engl J Med. 2005; 353:1124–34. https://doi.org/10.1056/NEJMsa050467 [PubMed]
- 6. Wang Z, Chen Z, Zhang L, Wang X, Hao G, Zhang Z, Shao L, Tian Y, Dong Y, Zheng C, Wang J, Zhu M, Weintraub WS, Gao R, and China Hypertension Survey Investigators. Status of hypertension in China: results from the China hypertension survey, 2012-2015. Circulation. 2018; 137:2344–56. https://doi.org/10.1161/CIRCULATIONAHA.117.032380 [PubMed]
- 7. Li K, Yao C, Yang X, Di X, Li N, Dong L, Xu L, Zheng M. Body Mass Index and the Risk of Cardiovascular and All-Cause Mortality Among Patients With Hypertension: A Population-Based Prospective Cohort Study Among Adults in Beijing, China. J Epidemiol. 2016; 26:654–60. https://doi.org/10.2188/jea.JE20150323 [PubMed]
- 8. Sun H, Ren X, Chen Z, Li C, Chen S, Wu S, Chen Y, Yang X. Association between body mass index and mortality in a prospective cohort of Chinese adults. Medicine (Baltimore). 2016; 95:e4327. https://doi.org/10.1097/MD.0000000000004327 [PubMed]
- 9. Jousilahti P, Tuomilehto J, Vartiainen E, Pekkanen J, Puska P. Body weight, cardiovascular risk factors, and coronary mortality. 15-year follow-up of middle-aged men and women in eastern Finland. Circulation. 1996; 93:1372–79. https://doi.org/10.1161/01.cir.93.7.1372 [PubMed]
- 10. Riaz H, Khan MS, Siddiqi TJ, Usman MS, Shah N, Goyal A, Khan SS, Mookadam F, Krasuski RA, Ahmed H. Association between obesity and cardiovascular outcomes: a systematic review and meta-analysis of mendelian randomization studies. JAMA Netw Open. 2018; 1:e183788. https://doi.org/10.1001/jamanetworkopen.2018.3788 [PubMed]
- 11. Peck RN, Green E, Mtabaji J, Majinge C, Smart LR, Downs JA, Fitzgerald DW. Hypertension-related diseases as a common cause of hospital mortality in Tanzania: a 3-year prospective study. J Hypertens. 2013; 31:1806–11. https://doi.org/10.1097/HJH.0b013e328362bad7 [PubMed]
- 12. Smith DE, Odel HM, Kernohan JW. Causes of death in hypertension. Am J Med. 1950; 9:516–27. https://doi.org/10.1016/0002-9343(50)90203-8 [PubMed]
- 13. Verdecchia P, Angeli F, Cavallini C, Aita A, Turturiello D, De Fano M, Reboldi G. Sudden cardiac death in hypertensive patients. Hypertension. 2019; 73:1071–78. https://doi.org/10.1161/HYPERTENSIONAHA.119.12684 [PubMed]
- 14. Jayedi A, Shab-Bidar S. Nonlinear dose-response association between body mass index and risk of all-cause and cardiovascular mortality in patients with hypertension: a meta-analysis. Obes Res Clin Pract. 2018; 12:16–28. https://doi.org/10.1016/j.orcp.2018.01.002 [PubMed]
- 15. de Simone G, Wachtell K, Palmieri V, Hille DA, Beevers G, Dahlöf B, de Faire U, Fyhrquist F, Ibsen H, Julius S, Kjeldsen SE, Lederballe-Pedersen O, Lindholm LH, et al. Body build and risk of cardiovascular events in hypertension and left ventricular hypertrophy: the LIFE (Losartan Intervention For Endpoint reduction in hypertension) study. Circulation. 2005; 111:1924–31. https://doi.org/10.1161/01.CIR.0000161799.91577.0A [PubMed]
- 16. McAuley PA, Sui X, Church TS, Hardin JW, Myers JN, Blair SN. The joint effects of cardiorespiratory fitness and adiposity on mortality risk in men with hypertension. Am J Hypertens. 2009; 22:1062–69. https://doi.org/10.1038/ajh.2009.122 [PubMed]
- 17. Uretsky S, Messerli FH, Bangalore S, Champion A, Cooper-Dehoff RM, Zhou Q, Pepine CJ. Obesity paradox in patients with hypertension and coronary artery disease. Am J Med. 2007; 120:863–70. https://doi.org/10.1016/j.amjmed.2007.05.011 [PubMed]
- 18. Wang Y, Wang Y, Qain Y, Zhang J, Tang X, Sun J, Zhu D. Association of body mass index with cause specific deaths in Chinese elderly hypertensive patients: minhang community study. PLoS One. 2013; 8:e71223. https://doi.org/10.1371/journal.pone.0071223 [PubMed]
- 19. Bender R, Jöckel KH, Trautner C, Spraul M, Berger M. Effect of age on excess mortality in obesity. JAMA. 1999; 281:1498–504. https://doi.org/10.1001/jama.281.16.1498 [PubMed]
- 20. Stevens J, Cai J, Pamuk ER, Williamson DF, Thun MJ, Wood JL. The effect of age on the association between body-mass index and mortality. N Engl J Med. 1998; 338:1–7. https://doi.org/10.1056/NEJM199801013380101 [PubMed]
- 21. Matsushita M, Shirakabe A, Hata N, Shinada T, Kobayashi N, Tomita K, Tsurumi M, Okazaki H, Yamamoto Y, Asai K, Shimizu W. Association between the body mass index and the clinical findings in patients with acute heart failure: evaluation of the obesity paradox in patients with severely decompensated acute heart failure. Heart Vessels. 2017; 32:600–08. https://doi.org/10.1007/s00380-016-0908-9 [PubMed]
- 22. Oga EA, Eseyin OR. The obesity paradox and heart failure: a systematic review of a decade of evidence. J Obes. 2016; 2016:9040248. https://doi.org/10.1155/2016/9040248 [PubMed]
- 23. Hubert HB, Feinleib M, McNamara PM, Castelli WP. Obesity as an independent risk factor for cardiovascular disease: a 26-year follow-up of participants in the Framingham heart study. Circulation. 1983; 67:968–77. https://doi.org/10.1161/01.cir.67.5.968 [PubMed]
- 24. Manson JE, Colditz GA, Stampfer MJ, Willett WC, Rosner B, Monson RR, Speizer FE, Hennekens CH. A prospective study of obesity and risk of coronary heart disease in women. N Engl J Med. 1990; 322:882–89. https://doi.org/10.1056/NEJM199003293221303 [PubMed]
- 25. National Cholesterol Education Program (NCEP) Expert Panel on Detection, Evaluation, and Treatment of High Blood Cholesterol in Adults (Adult Treatment Panel III). Third report of the national cholesterol education program (NCEP) expert panel on detection, evaluation, and treatment of high blood cholesterol in adults (adult treatment panel III) final report. Circulation. 2002; 106:3143–421. [PubMed]
- 26. Kuch B, Hense HW, Gneiting B, Döring A, Muscholl M, Bröckel U, Schunkert H. Body composition and prevalence of left ventricular hypertrophy. Circulation. 2000; 102:405–10. https://doi.org/10.1161/01.cir.102.4.405 [PubMed]
- 27. Zhai AB, Haddad H. The impact of obesity on heart failure. Curr Opin Cardiol. 2017; 32:196–202. https://doi.org/10.1097/HCO.0000000000000370 [PubMed]
- 28. Engeli S, Feldpausch M, Gorzelniak K, Hartwig F, Heintze U, Janke J, Möhlig M, Pfeiffer AF, Luft FC, Sharma AM. Association between adiponectin and mediators of inflammation in obese women. Diabetes. 2003; 52:942–47. https://doi.org/10.2337/diabetes.52.4.942 [PubMed]
- 29. Visser M, Bouter LM, McQuillan GM, Wener MH, Harris TB. Elevated C-reactive protein levels in overweight and obese adults. JAMA. 1999; 282:2131–35. https://doi.org/10.1001/jama.282.22.2131 [PubMed]
- 30. De Michele M, Panico S, Iannuzzi A, Celentano E, Ciardullo AV, Galasso R, Sacchetti L, Zarrilli F, Bond MG, Rubba P. Association of obesity and central fat distribution with carotid artery wall thickening in middle-aged women. Stroke. 2002; 33:2923–28. https://doi.org/10.1161/01.str.0000038989.90931.be [PubMed]
- 31. Lakka TA, Lakka HM, Salonen R, Kaplan GA, Salonen JT. Abdominal obesity is associated with accelerated progression of carotid atherosclerosis in men. Atherosclerosis. 2001; 154:497–504. https://doi.org/10.1016/s0021-9150(00)00514-1 [PubMed]
- 32. Fischer J, Johnson MA. Low body weight and weight loss in the aged. J Am Diet Assoc. 1990; 90:1697–706. [PubMed]
- 33. Jahangir E, De Schutter A, Lavie CJ. Low weight and overweightness in older adults: risk and clinical management. Prog Cardiovasc Dis. 2014; 57:127–33. https://doi.org/10.1016/j.pcad.2014.01.001 [PubMed]
- 34. Barrett-Connor E, Khaw KT. Is hypertension more benign when associated with obesity? Circulation. 1985; 72:53–60. https://doi.org/10.1161/01.cir.72.1.53 [PubMed]
- 35. Steinberg BA, Cannon CP, Hernandez AF, Pan W, Peterson ED, Fonarow GC. Medical therapies and invasive treatments for coronary artery disease by body mass: the “obesity paradox” in the Get With The Guidelines Database. Am J Cardiol. 2007; 100:1331–35. https://doi.org/10.1016/j.amjcard.2007.06.019 [PubMed]
- 36. Yu JM, Kong QY, Schoenhagen P, Shen T, He YS, Wang JW, Zhao YP, Shi DN, Zhong BL. The prognostic value of long-term visit-to-visit blood pressure variability on stroke in real-world practice: a dynamic cohort study in a large representative sample of Chinese hypertensive population. Int J Cardiol. 2014; 177:995–1000. https://doi.org/10.1016/j.ijcard.2014.09.149 [PubMed]
- 37. Hess KR. Assessing time-by-covariate interactions in proportional hazards regression models using cubic spline functions. Stat Med. 1994; 13:1045–62. https://doi.org/10.1002/sim.4780131007 [PubMed]