


Introduction
Colorectal cancer (CRC) is a common digestive system neoplasm (DSN) that threatens human health globally [1]. Epidemiological statistics have indicated that the morbidity and mortality of CRC rank third and fourth among malignancies, respectively [2]. The pathogenesis of CRC is complex and has not been fully elucidated. Recently, an increasing number of studies have reported that non-coding RNAs, including long non-coding RNAs (LncRNA) [3], microRNA (miRNA) [4], circular RNAs (circRNAs) [5], and PIWI-interacting RNAs (piRNAs) [6], exert important biological functions in CRC; however, additional research is needed to uncover the specific pathological mechanisms involved in cancer proliferation and metastasis.
LncRNAs are a newly discovered class of non-coding transcripts longer than 200 nucleotides in length [7]. Long intergenic non-coding RNAs (lincRNAs), belong to the class of lncRNAs [8], and act on multiple miRNAs through complementary base pairing, thereby modulating the expression of downstream genes [9]. LincRNAs have been widely identified to regulate tumorigenesis and cancer progression [10–12]. LINC00485 is a newly discovered lincRNA. A genome-wide association study identified a new locus on 12q23.2 (LINC00485), which was associated with uterine leiomyoma [13]. In addition, studies in lung adenocarcinoma (LAC) cells have shown that LINC00485 directly binds to miRNA-195 to up-regulate checkpoint kinase 1 (CHEK1) expression, contributing to LAC cell proliferation and cisplatin resistance [14]. By contrast, we found that the expression of LINC00485 in CRC tissues was significantly down-regulated when compared to adjacent normal tissues. MiR-581, a predicted target for LINC00485, was aberrantly upregulated in CRC samples. A significant negative correlation was found between LINC00485 and miR-581 expression. Interestingly, down-regulated miR-581 interfered with hepatocellular carcinoma development [15]. However, it remains unclear whether LINC00485 directly targets miR-581 and how it exerts biological activities against CRC progression. Hence, we performed a series of in vitro and in vivo experiments to uncover the role of LINC00485 and miR-581 and to provide new insight into the treatment and diagnosis of CRC.
In this study, we found that LINC00485 worked as a competing endogenous RNA (ceRNA) against miR-581 thereby up-regulating EDEM1 expression in CRC cells, thus promoting proliferation, migration, invasion, and the epithelial-mesenchymal transition (EMT) process of CRC cells. LINC00485 can be used as a therapeutic target for CRC treatment.
Results
LINC00485 is down-regulated in CRC tissues and cells
To understand the role of LINC00485 in CRC, we collected normal paracancerous tissue and tumor tissues from 52 patients with CRC. We found that the expression of LINC00485 in CRC tissues was significantly lower than that in adjacent normal tissues (Figure 1A). There was no significant correlation between LINC00485 expression and clinical parameters such as patient’s age and sex (data not shown), but LINC00485 expression was strikingly reduced with tumor stage (Figure 1B). Next, lower and higher LINC00485 expression groups were defined according to median LINC00485 expression values. The data indicated that CRC patients with higher expression of LINC00485 survived longer than patients with lower expression of LINC00485 (Figure 1C). To determine the subcellular localization of LINC00485 in CRC cells, cells were examined by FISH assay using fluorescent probes. We found that LINC00485 was mainly expressed in the cytoplasm of CRC cells (SW480, LoVo) (Figure 1D) and human normal colorectal epithelial cells (FHC) (Supplementary Figure 1). Moreover, LINC00485 levels in CRC cells (LoVo, SW460, HCT8 cell lines) were markedly lower than in human normal colorectal epithelial cell lines (FHC, NCM460, CCD-18co cells) (Figure 1E). We further demonstrated that shRNA-mediated knockdown of LINC00485 could enhance the migratory ability of FHC cells, while overexpression of LINC00485 significantly attenuated the migration of LoVo cells (Figure 1F–1I). These findings suggested that LINC00485 was implicated in CRC progression.
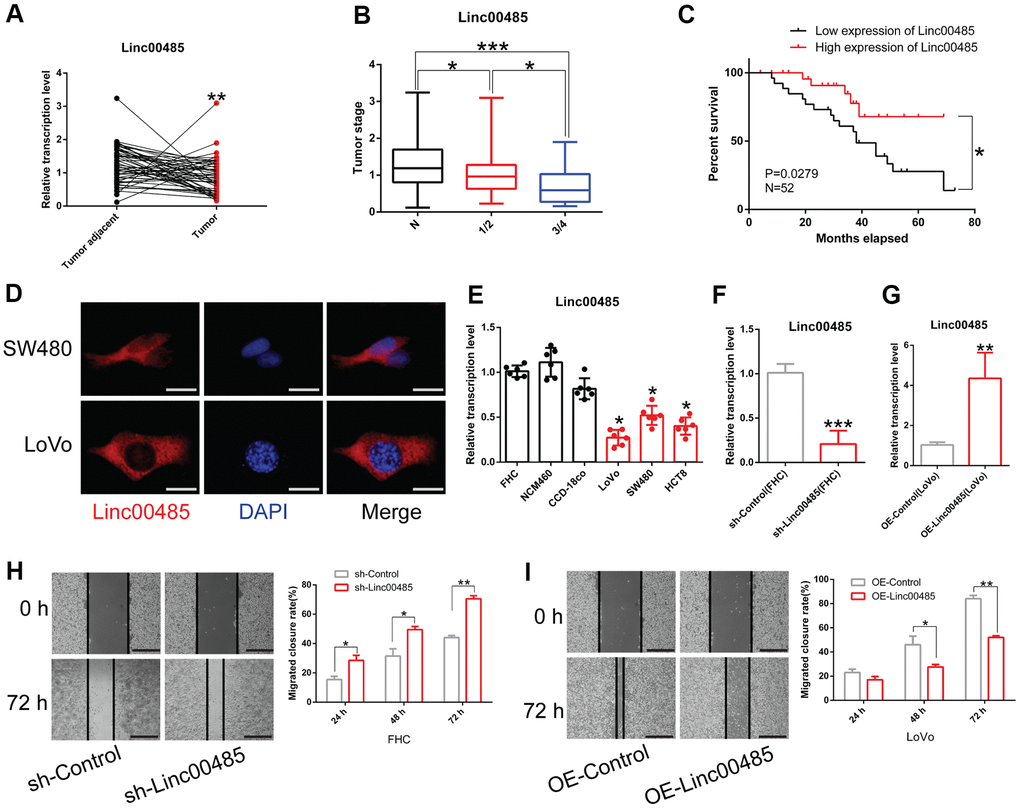
Figure 1. LINC00485 is downregulated in CRC tissues and cells. (A) LINC00485 levels in CRC and adjacent normal tissues. (B) LINC00485 levels in CRC patients with stage I/II or III/IV disease is significantly lower than in adjacent normal tissues. (C) High expression of LINC00485 predicts a favorable prognosis of CRC patients. (D) The subcellular localization of LINC00485 in SW480 and LoVo cells was detected by FISH assay. Scale bar, 2 μm. (E) LINC00485 expression is significantly reduced in CRC cells compared to human normal colorectal epithelial cell lines. (F) The knockdown efficiency of LINC00485 RNAi lentivirus in FHC cells. (G) LINC00485 knockdown promotes cell migration in FHC cells. (H) LINC00485 knockdown promotes the migration of FHC cells. (I) Overexpression of LINC00485 suppresses the migratory ability of LoVo cells. Differences between two groups were assessed by applying student’s t-test. Multiple comparison was analyzed using the one-way ANOVA with LSD test. Bars were represented as S.D. *P<0.05; **P<0.01; ***P<0.001. N, normal tissues; sh, short hairpin RNA targeting LINC00485.
LINC00485 directly targes microRNA-581
To determine the mechanism underlying the involvement of LINC00485 in CRC progression, the biological prediction website DIANA-LncBase v2 [16] was used to predict targets of LINC00485. The results showed that miR-581 shared complementary binding sites with LINC00485 (Figure 2A). Dual-luciferase reporter assays and RNA immunoprecipitation (RIP) analysis confirmed the interaction between LINC00485 and miR-581 (Figure 2B–2D). MiR-581 was highly expressed in CRC tissues compared with normal tissues (Figure 2E) and was significantly associated with tumor stage (Figure 2F). CRC patients with miR-581 levels above median values have significantly worse prognosis (Figure 2G). We observed a negative correlation between LINC00485 and miR-581 in CRC (Figure 2H). Further, our data showed that miR-581 levels were significantly higher in CRC cell lines and specimens than in human normal colorectal epithelial cell lines and normal samples (Figure 2I–2K). In addition, LINC00485 knockdown significantly increased the expression of miR-581 in FHC cells, and the overexpression of LINC00485 decreased miR-581 levels in LoVo cells (Figure 2L, 2M). Treatment with miR-581 mimics or antagomir strongly reduced or elevated miR-581 levels, neither of which had any effect on LINC00485 expression; however, miR-581 knockdown significantly enhanced the cell viability of FHC cells, whereas the overexpression of miR-581 caused decreased proliferative activity of LoVo cells compared to the matched control cells (Figure 2N–2S).
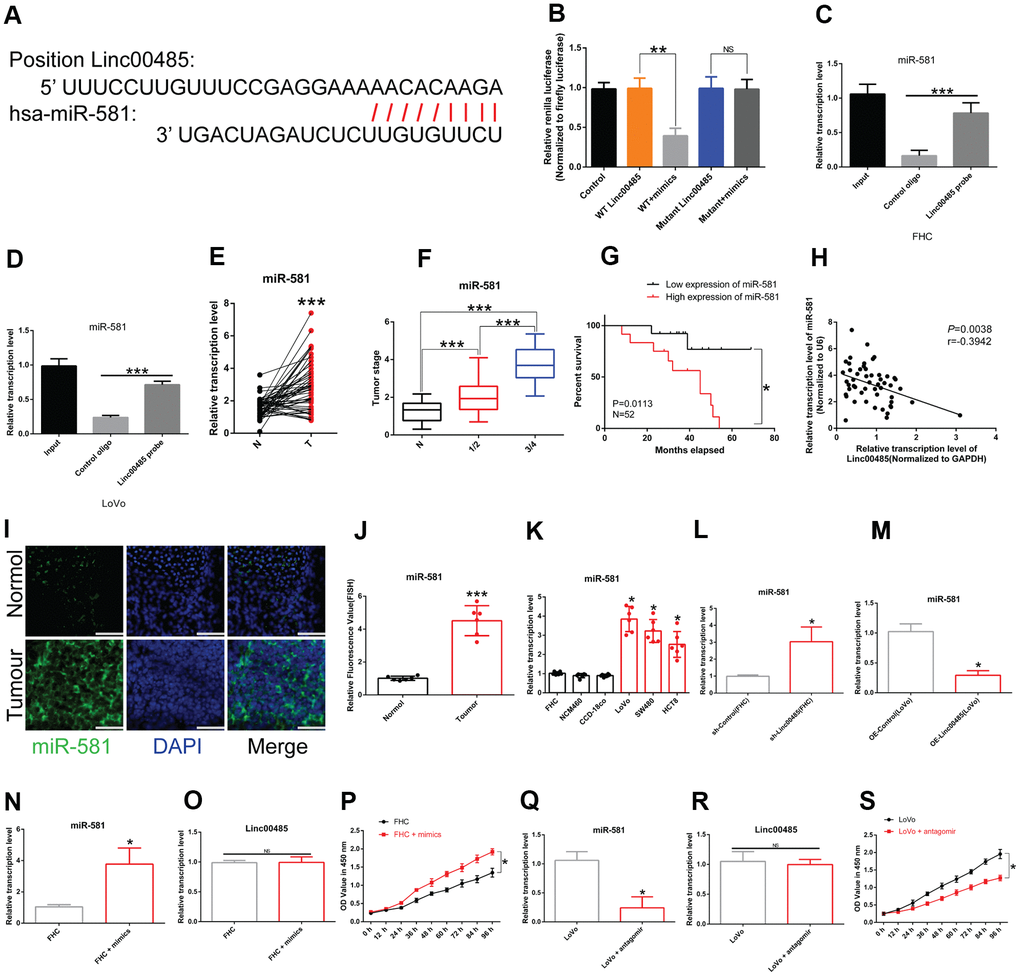
Figure 2. LINC00485 directly targets miR-581. (A) Predicted binding sites between LINC00485 and miR-581. (B) The interaction between LINC00485 and miR-581 was confirmed by luciferase reporter assays in 293T cells. (C, D) The RIP assay was performed to validate the interaction between LINC00485 and miR-581 in (C) FHC cells and (D) LoVo cells. (E) miR-581 levels in CRC and adjacent normal tissues. (F) miR-581 levels in CRC patients with stage I/II or III/IV disease is significantly higher than in adjacent normal tissues. (G) High expression of miR-581 predicts poor outcome of CRC patients. (H) The expression of miR-581 is negatively correlated with LINC00485 level in human tumor tissues. (I) The subcellular localization of miR-581 in CRC and normal tissues. Blue, DAPI; Green, miR-581; Scale bar, 50 μm. (J) Fluorescence value of miR-581 expression in tumor and normal tissues. (K) miR-581 expression is significantly elevated in CRC cells compared to the human normal colorectal epithelial cell lines. (L) The expression of miR-581 is significantly elevated in LINC00485 knockdown FHC cells. (M) The expression level of miR-581 is downregulated in LINC00485-overexpressing LoVo cells. (N) Transfection efficiency of miR-581 mimics in FHC cells was determined by RT-qPCR. (O) Treatment with miR-581 mimics has no effect on LINC00485 expression in FHC cells. (P) Treatment with miR-581 mimics increases FHC cell viability. (Q) Transfection efficiency of miR-581 antagomir in LoVo cells was measured by RT-qPCR. (R) Treatment with miR-581 antagomir has no effect on the expression level of LINC00485 in LoVo cells. (S) miR-581 knockdown reduces LoVo cell viability. Differences between two groups were assessed by applying student’s t-test. Multiple comparison was analyzed using the one-way ANOVA with LSD test. Bars were represented as S.D. *P<0.05; **P<0.01; ***P<0.001. N, paired normal tissues; T, tumor tissues.
LINC00485 regulates cell proliferation, migration, and invasion by acting on miR-581
To determine how LINC00485 exerts its functions by regulating miR-581, we performed a series of functional experiments in vitro. Our findings demonstrated that overexpression of miR-581 promoted proliferation, migration, and invasion of human normal colorectal epithelial cells (FHC), whereas miR-581 down-regulation suppressed the proliferative, invasive, and migratory abilities of CRC cells (LoVo) when compared with the matched control group (Figure 3A–3H; Supplementary Figure 2). Furthermore, LINC00485 silencing significantly elevated the proportion of Ki-67-positive cells, up-regulated the protein expression level of proliferative markers PNCA and Ki-67, arrested cell cycle in Go/G1 phase (Supplementary Figure 3), enhanced colony formation, cell migration, and invasion capabilities of FHC cells in comparison to control cells, which could be partially reversed by miR-581 silencing (Figure 4A, 4C, 4E, 4G). Additionally, LINC00485-overexpressed LoVo cells demonstrated a significant reduction in the percentage of Ki-67-positive cells, the expression levels of PNCA and Ki-67, and in colony formation, proliferative, migratory, and invasive capacities compared with the control groups; however, overexpression of miR-581 partially abolished LINC00485 overexpression-induced inhibition of cell proliferation, migration, and invasion in LoVo cells (Figure 4B, 4D, 4F, 4H; Supplementary Figure 3). These findings suggested that LINC00485 regulated CRC progression by acting via miR-581.
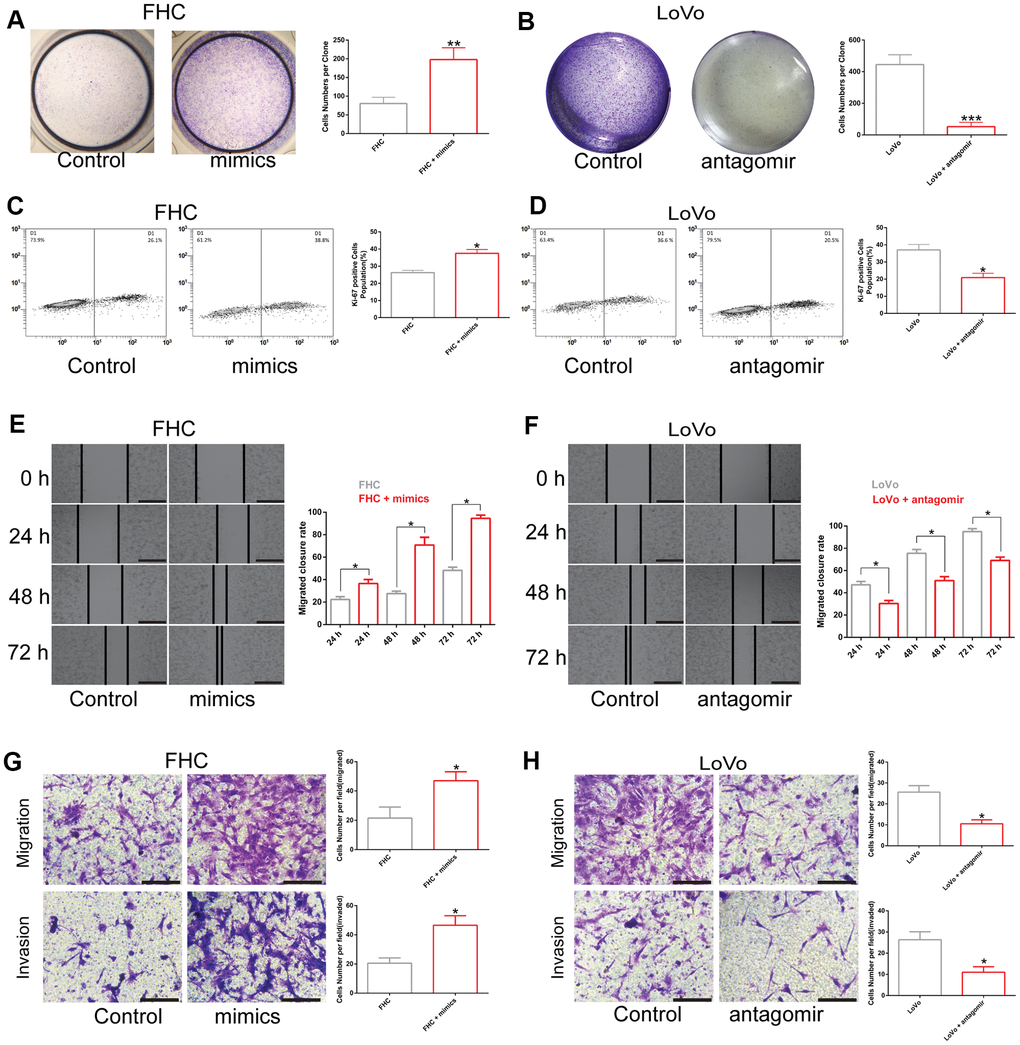
Figure 3. The effect of miR-581 on cell proliferation, migration, and invasion. (A, B) Colony formation of (A) FHC cells transfected with miR-581 mimics and (B) Cell proliferation of LoVo cells transfected with miR-581 antagomir tested by colony formation assay. (C) The percentage of Ki-67-positive FHC cells increases significantly after transfection with miR-581 mimics. (D) The percentage of Ki-67-positive LoVo cells is significantly lower after transfection with miR-581 antagomir. (E, F) Wound closure rate of (E). FHC cells transfected with miR-581 mimics and (F) LoVo cells transfected with miR-581 antagomir subjected to the in vitro scratch assay. (G, H) Migratory and invasive abilities of (G) FHC cells transfected with miR-581 mimics and (H) LoVo cells transfected with miR-581 antagomir evaluated by Transwell migration and invasion assays. Comparison between two groups were assessed by student’s t-test. Bars were represented as S.D. *P<0.05; **P<0.01; ***P<0.001.
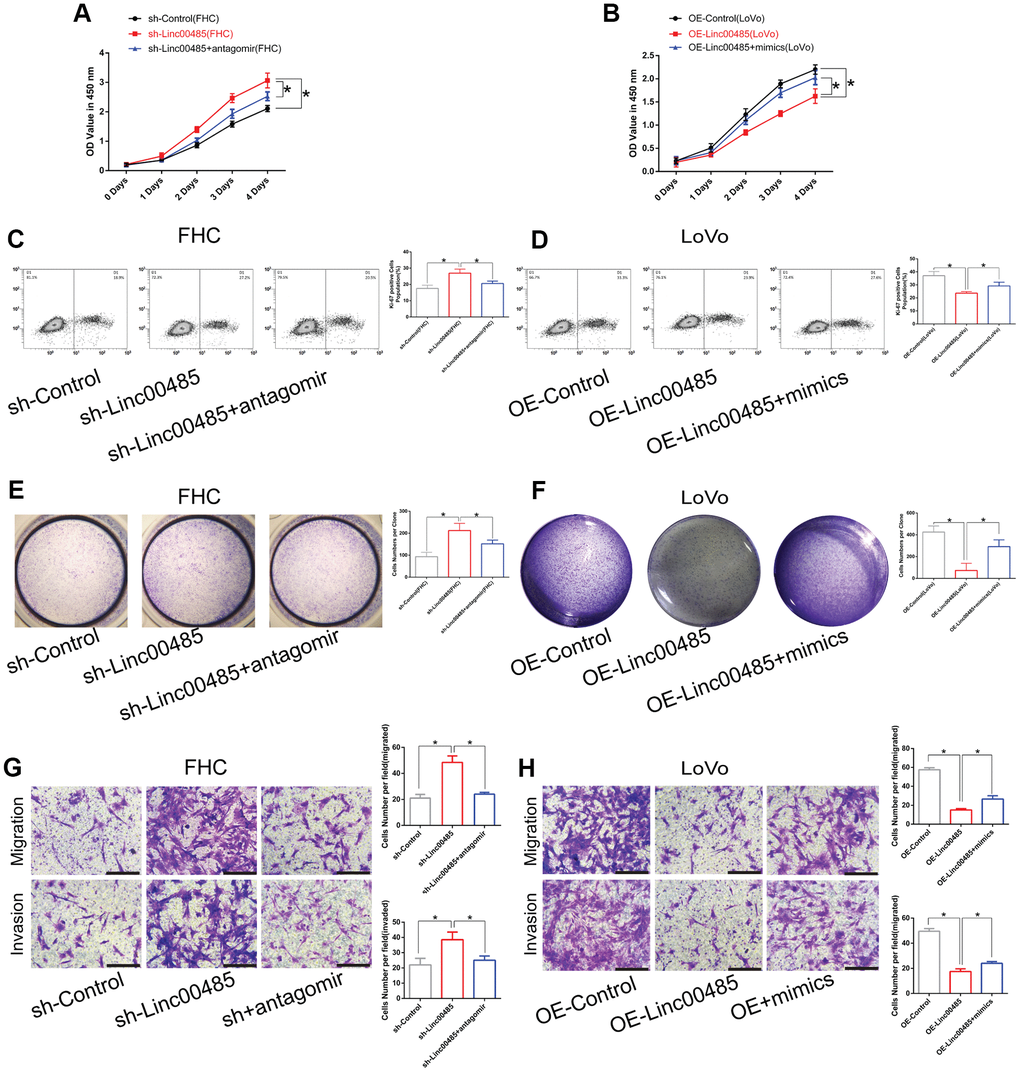
Figure 4. LINC00485 regulates cell proliferation, migration, and invasion by sponging miR-581. (A, B) Cell viability of LINC00485 knockdown FHC cells with or without miR-581 antagomir treatment for 24 h and (B) LINC00485-overexpressed LoVo cells with or without miR-581 mimics treatment for 24 h was evaluated by the CCK-8 assay. (C) The percentage of Ki-67-positive cells in (C) LINC00485 knockdown FHC cells with or without miR-581 antagomir treatment for 24 h was tested by flow cytometry. (D) The percentage of Ki-67-positive cells in LINC00485-overexpressed LoVo cells with or without miR-581 mimics treatment for 24 h was evaluated by flow cytometry. (E, F) Colony forming capability of (E) LINC00485 silenced FHC cells with or without miR-581 antagomir treatment for 24 h and (F) LINC00485-overexpressed LoVo cells with or without miR-581 mimics treatment for 24 h was measured by the colony formation assay. (G, H) The migratory and invasive abilities of (G) LINC00485-silenced FHC cells with or without miR-581 antagomir treatment for 24 h and (H) LINC00485-overexpressed LoVo cells with or without miR-581 mimics for 24 h were detected by Transwell assays. Data was analyzed using the one-way ANOVA with LSD test. Bars were represented as S.D. *P<0.05. sh, short hairpin RNA targeting LINC00485; OE, overexpression.
EDEM1 is the downstream molecular target of the LINC00485/miR-581 axis
To explore downstream targets of miR-581, we performed bioinformatics analysis using TargetScan (http://www.targetscan.org/) to predict messenger RNA (mRNA) targets. We identified the complementary sites between miR-581 and EDEM1 (Figure 5A). Dual-luciferase reporter assays revealed that wild-type (WT) LINC00485, but not the mutant LINC00485, could directly bind to miR-581. When miR-581 was co-transfected with the WT 3'- untranslated region (3'UTR) of EDEM1 into 293T cells, the luminescence activity was significantly reduced, while when miR-581 was co-transfected with mutant 3'UTR of EDEM1 into 293T cells, no differences were observed, indicating that miR-581 targeted the WT 3'UTR of EDEM1, but not the mutant 3'UTR of EDEM1 (Figure 5B). RIP and real time quantitative polymerase chain reaction (RT-qPCR) experiments further confirmed the binding relationship between miR-581 and 3'UTR of EDEM1 mRNA (Figure 5C, 5D). Moreover, by searching The Cancer Genome Atlas (TCGA) dataset, we found that expression of EDEM1 was significantly down-regulated in CRC tissues compared to adjacent normal tissues (Supplementary Figure 4A). EDEM1 expression also showed significant differences in correlation with the patient's sex, tumor type, and stage (Supplementary Figure 4B–4D). A further search of the Human Protein Atlas (HPA) database revealed that the overall survival of CRC patients with low EDEM1 expression was significantly lower than those with high EDEM1 expression (Supplementary Figure 4E). In our study, levels of EDEM1 were markedly decreased in CRC tissues compared with normal tissues (Figure 5E), an association that correlated with tumor stage (Figure 5E–5H). EDEM1 expression was positively correlated with LINC00485 levels (Figure 5I), while it inversely correlated with miR-581 expression (Figure 5J). EDEM1 expression in vitro was significantly reduced in CRC cell lines compared to human normal colorectal epithelial cells at both the transcriptional and translational levels (Figure 5K, 5L).
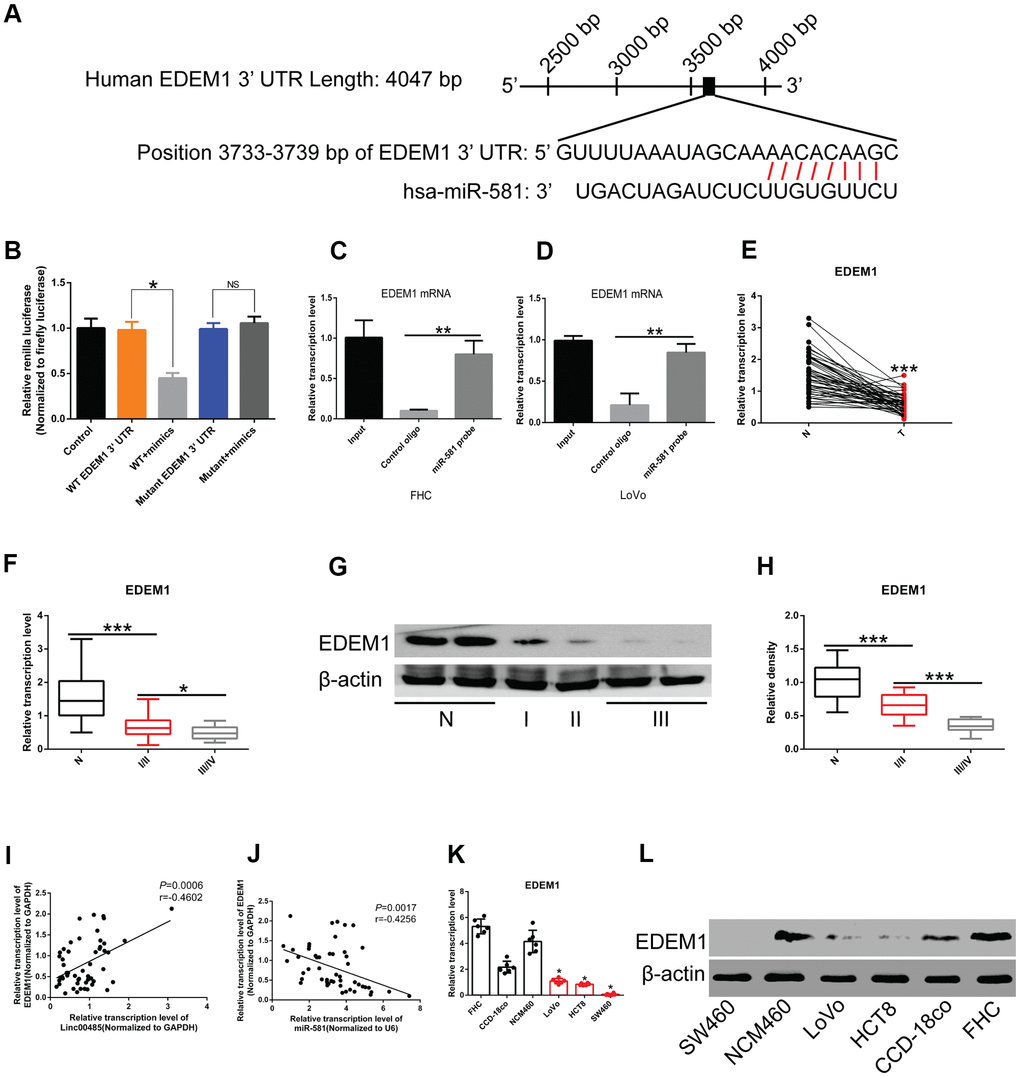
Figure 5. EDEM1 is the downstream molecular target of the LINC00485/miR-581 axis in CRC cells. (A) Schematic diagram of binding sites of the 3’UTR of EDEM1 mRNA and miR-581. (B) Luciferase reporter assay confirming the interaction between the 3’UTR of EDEM1 mRNA and miR-581. (C, D) RIP assay validating the interaction between the 3’UTR of EDEM1 mRNA and miR-581 in (C) FHC cells and (D) LoVo cells. (E) The mRNA level of EDEM1 is significantly lower in 52 CRC tissues than in paired normal tissues. (F, G, H) The (F) mRNA and (G, H) protein levels of EDEM1 in CRC patients with stage I/II or III/IV are significantly lower than in adjacent normal tissues. EDEM1 expression level decreases significantly with the advancing tumor stage. (I) A positive correlation between LINC00485 level and the expression of EDEM1 in 52 CRC tissues. (J) EDEM1 expression is negatively correlated with miR-581 levels in 52 CRC tissues. (K, L) The (K) mRNA and (L) protein levels of are significantly reduced in CRC cells compared with in human normal colorectal epithelial cell lines. Comparison between two groups were assessed using student’s t-test. Multiple comparison was analyzed using the one-way ANOVA with LSD test. Bars were represented as S.D. *P<0.05; **P<0.01; ***P<0.001. WT, wild type; N, adjacent normal tissues; T, tumor tissues; NS, not significant.
LINC00485/miR-581/EDEM1 axis regulates epithelial-to-mesenchymal transition in CRC
To unravel whether the LINC00485/miR-581 axis exerts its biological function by modulating EDEM1 expression, small interfering RNA (siRNA) targeting EDEM1 were used to inhibit EDEM1 expression in LoVo cells, which resulted in a significant reduction of EDEM1 expression compared to the untransfected cells (Figure 6A). In LINC00485-overexpressing LoVo cells, miR-581 levels were significantly down-regulated; however, further treatment with siEDEM1 had no effect on miR-581 expression (Figure 6B), but markedly reduced EDEM1 expression as expected (Figure 6C). Consistent with previous results, LINC00485 knockdown exhibited significant suppressive activity in LoVo cells. Transfection siEDEM1 partially counteracted LINC00485 knockdown-induced reduction of cell proliferation (Figure 6D), colony formation (Figure 6E), migration (Figure 6F), and invasion (Figure 6G) abilities of LoVo cells compared with the untransfected LINC0048-knockdown cells. These results confirmed that LINC00485 exerted its effects by regulating the EDEM1/miR-581 axis. EMT contributes to the pathogenesis of cancer metastasis [17]. In this cellular context, the expression of epithelium-related genes (cytokeratin, E-cadherin) was significantly upregulated, while that of mesenchymal-associated genes (N-cadherin, vimentin) was downregulated in LINC00485-overexpressed LoVo cells compared to control cells. Further knockdown of EDEM1 using siRNA, could partially reverse the changes caused by LINC00485 overexpression (Figure 6H).
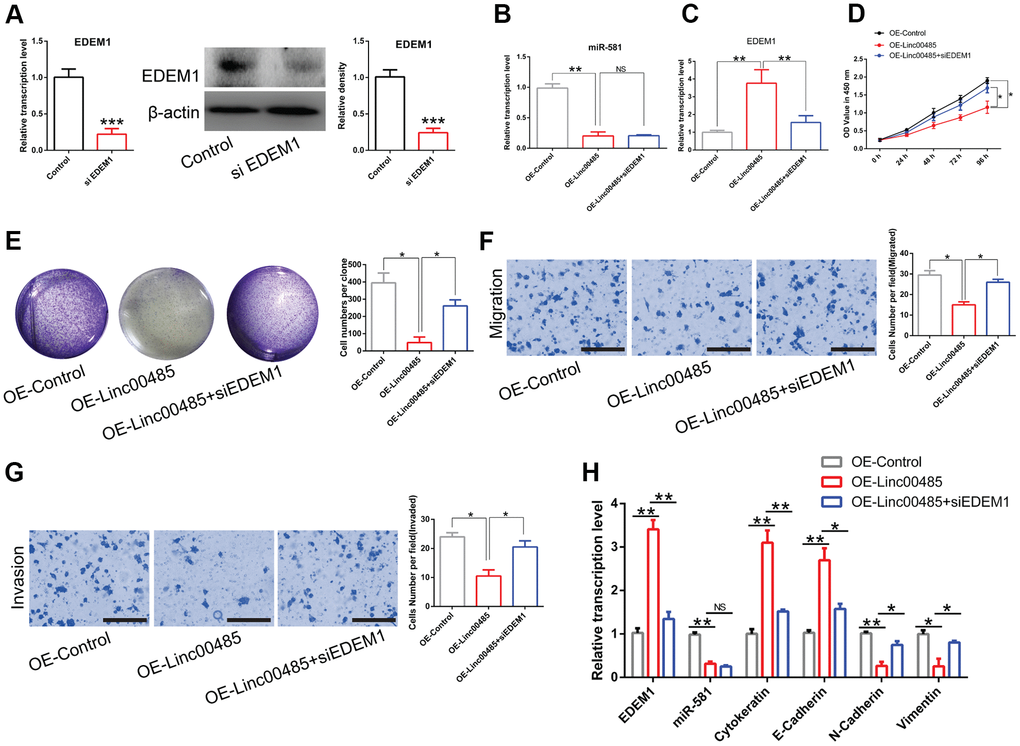
Figure 6. LINC00485 modulates CRC cell proliferation, migration, and invasion by regulating miR-581/EDEM1 axis. (A) The transfection efficiency of small interfering RNA targeting EDEM1 was validated by RT-qPCR analysis and western blotting assay. (B) miR-581 levels are significantly down-regulated both in LINC00485-overexpressed LoVo cells and LINC00485-overexpressed LoVo cells transfected with siEDEM1. (C) EDEM1 expression increases in LINC00485-overexpressed LoVo cells, but decreases in LINC00485-overexpressed LoVo cells after transfection with siEDEM1. (D) Cell viability of LINC00485-overexpressed LoVo cells with or without siEDEM1 treatment was measured by the CCK-8 assy. (E) The colony formation assay results showing that overexpression of LINC00485 significantly inhibits the colony forming ability of LoVo cell, but EDEM1 knockdown reverses the result induced by LINC00485 overexpression. (F) Transwell migration and (G) invasion assays showing the effect of EDEM1 knockdown on LINC00485-overexpressed LoVo cells. (H) The mRNA levels of EDEM1, miR-581, cytokeratin, E-cadherin, N-cadherin, and vimentin in LINC00485-overexpressed LoVo cells transfected with or without siEDEM1. Comparison between two groups were assessed using student’s t-test. Multiple comparison was analyzed using the one-way ANOVA with LSD test. Bars were represented as S.D. *P<0.05; **P<0.01; ***P<0.001. NS, not significant; OE, overexpression; si, small interfering RNA targeting EDEM1; EDEM1, ER-degradation-enhancing alpha-mannosidase-like protein-1.
In addition, treatment with miR-581 antagomir increased expression of EDEM1 in LoVo cells compared to the untreated cells. However, EDEM1 expression was strikingly attenuated in LoVo cells co-transfected with miR-581 antagomir and siEDEM1 compared with LoVo cells transfected with miR-581 antagomir alone (Figure 7A). In line with the aforementioned results, the knockdown of miR-581 expression suppressed the proliferation, migration, and invasion of LoVo cells in comparison to the control cells. Finally, treatment with siEDEM1 was capable of partially rescuing the phenotypes caused by miR-581 knockdown in LoVo cells (Figure 7B–7E).
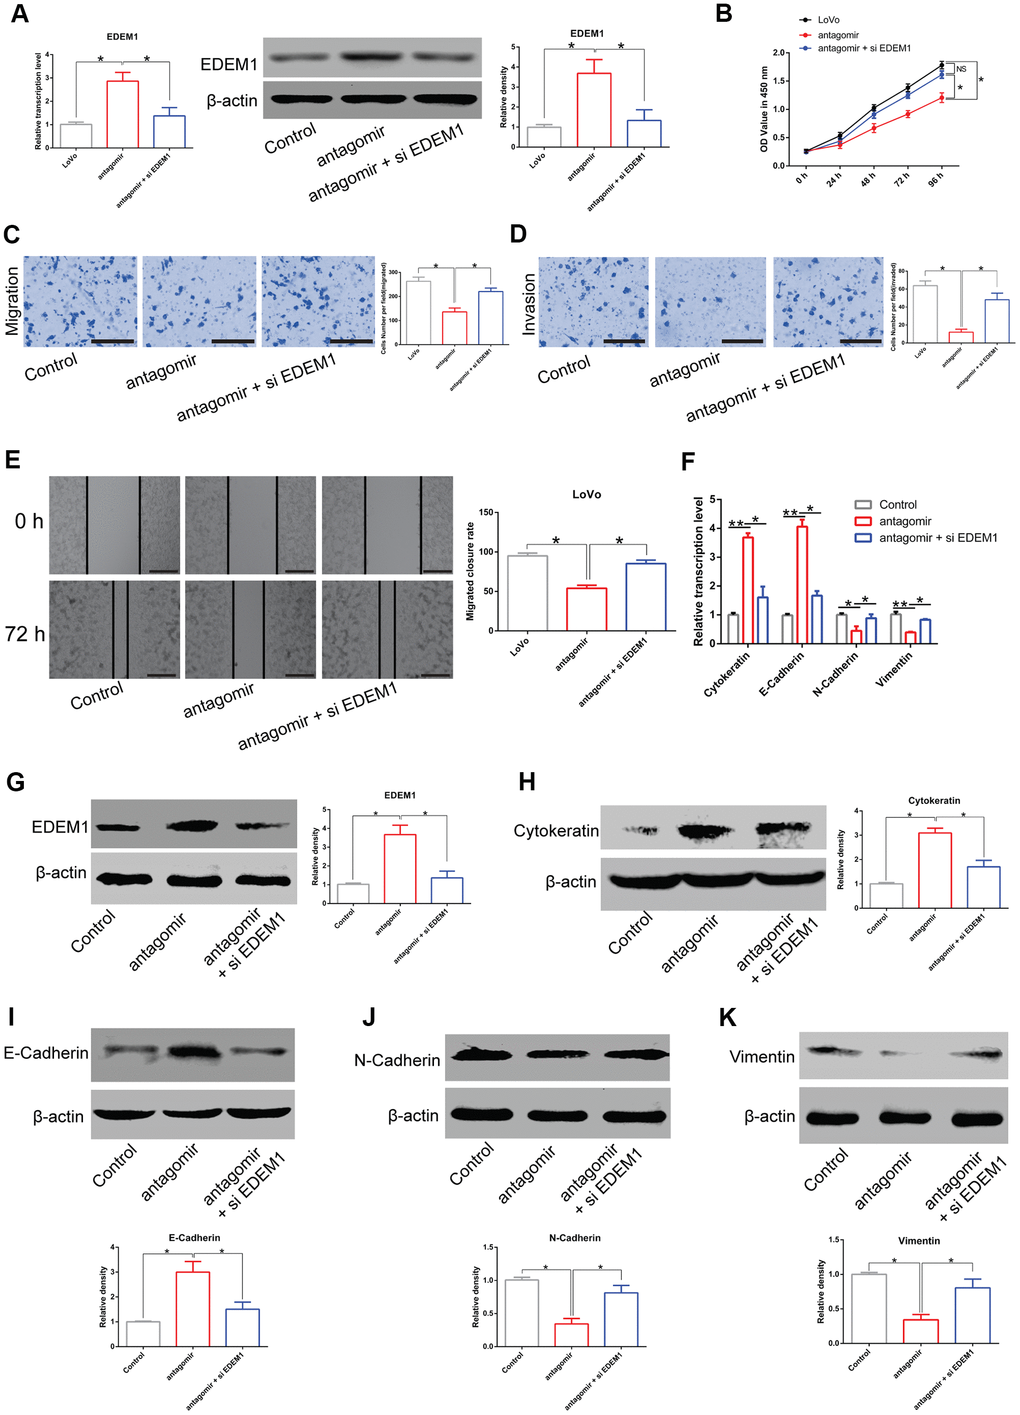
Figure 7. LINC00485/miR-581/EDEM1 axis regulates epithelial to mesenchymal transition in CRC cells. (A) The expression of EDEM1 in LoVo cells transfected with miR-581 antagomir or in combination with siEDEM1. (B) Cell viability of LoVo cells transfected with miR-581 antagomir or in combination with siEDEM1 measured by the CCK-8 assay. (C–E) The (C, E) migratory and (D) invasive capabilities of LoVo cells transfected with miR-581 antagomir or co-transfected with miR-581 antagomir and siEDEM1 were assessed by Transwell migration and invasion assays and the in vitro scratch assay. (F) The mRNA levels of cytokeratin, E-cadherin, N-cadherin, and vimentin in LoVo cells transfected with miR-581 antagomir or in combination with siEDEM1 were measured by RT-qPCR. (G–K) The protein levels of (C) EDEM1, (D) Cytokeratin, (E) E-cadherin, (F) N-cadherin and (G) Vimentin in LoVo cells transfected with miR-581 antagomir or in combination with siEDEM1 were quantified by western blotting assay. Data were analyzed using one-way ANOVA with LSD test. Bars were represented as S.D. *P<0.05; **P<0.01; NS, not significant; OE, overexpression; si, small interfering RNA targeting EDEM1; EDEM1, ER-degradation-enhancing alpha-mannosidase-like protein-1.
Meanwhile, miR-581 antagomir treatment enhanced the expression of epithelial markers E-cadherin and cytokeratin, but down-regulated the expression of mesenchymal markers N-cadherin and vimentin in LoVo cells at both the transcriptional and translational levels (Figure 7F–7K). Of note, our rescue experiments showed that siEDEM1 treatment could partially reverse the above-mentioned changes in gene expression induced by the knockdown of miR-581 (Figure 7F–7K). Cumulatively, these data further supported our findings that the LINC00485/miR-581/EDEM1 axis regulated CRC progression.
Overexpression of LINC00485 or miR-581 knockdown attenuated CRC cell growth and liver metastasis in vivo
We established a xenograft nude mouse model and liver metastasis model to investigate the effects of LINC00485 and miR-581 on CRC cell growth and metastasis in vivo. As described in the Methods section, tumor growth was monitored weekly. When the diameter of the largest tumor reached 1 cm, the nude mice met the humane endpoints of the study. All animals were sacrificed under anesthesia. Tumors were excised and the volumes were measured. We found that overexpression of LINC00485 significantly decreased tumor diameter, tumor volume at day 42, and the number of hepatic nodules in comparison to the control group, suggesting that the up-regulation of LINC00485 suppressed tumor growth and liver metastasis of CRC cells (Figure 8A–8D). Additionally, miR-581 antagomir injection also contributed to the decrease of tumor diameter, tumor volume at day 42, and the number of metastatic nodules of LoVo cells, indicating that miR-581 knockdown restricted CRC cell growth and liver metastasis in vivo (Figure 8F–8I). Furthermore, the expression levels of epithelium markers (cytokeratin, E-cadherin), mesenchymal markers (N-cadherin, vimentin), and cell proliferation markers (CK-19, Ki-67) were evaluated by RT-qPCR in metastatic nodules of nude mice. We found that the results were consistent with in vitro observations (Figure 8E, 8J). Overall, it can be concluded that the LINC00485/miR-581/EDEM1 axis may represent an important mechanism involved the malignant progression of CRC.
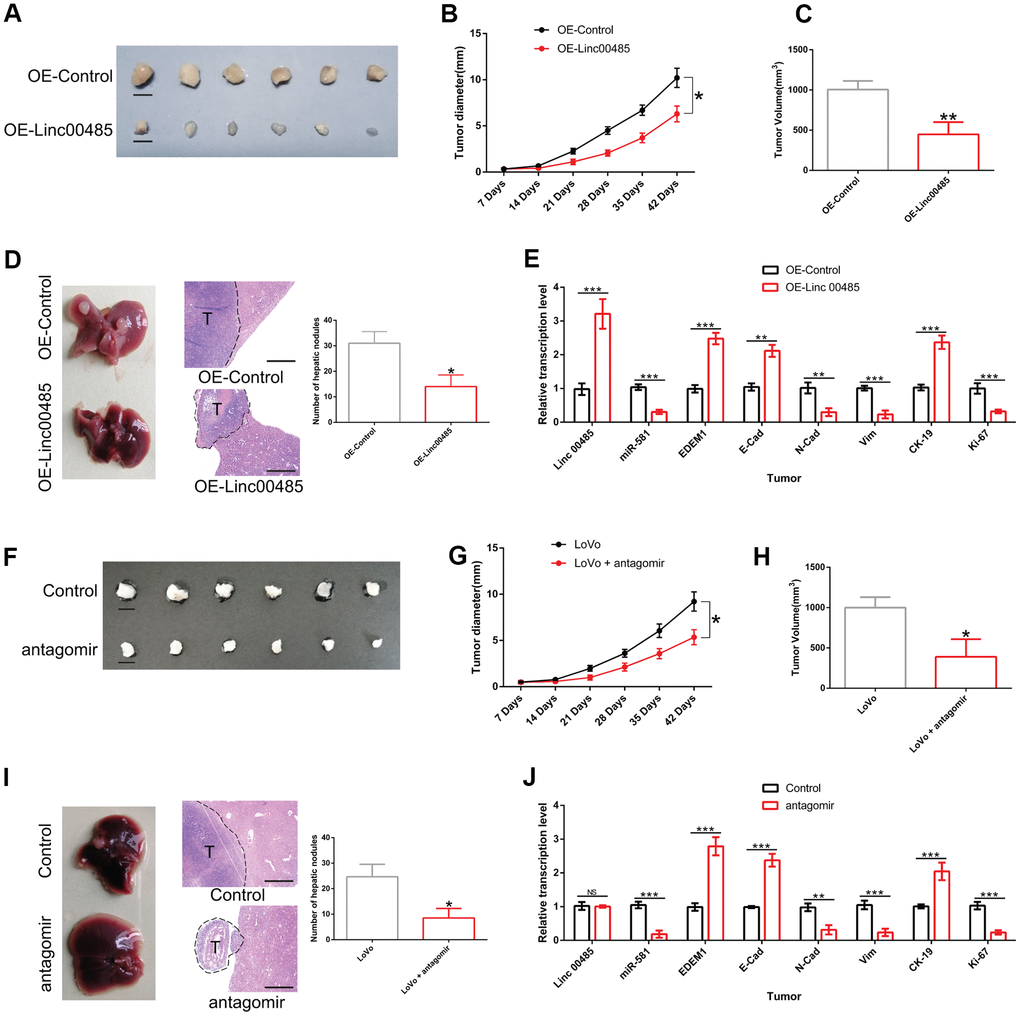
Figure 8. The effects of LINC00485 overexpression and miR-581 knockdown on CRC cell growth and liver metastasis in vivo. (A) Representative images of tumors derived from LINC00485-overexpressed LoVo cells at day 42 after subcutaneous injection (n=6 per group). (B) Tumor diameter was measured weekly after subcutaneous of injection LINC0048-overexpressed LoVo cells into the dorsal side of nude mice (n=6 per group). (C) Tumor volume of CRC tissues derived from LINC00485-overexpressed LoVo cells detected at day 42. (D) The number of hepatic nodules were counted in paraffin sections of liver at day 28 after injection with LINC00485-overexpressed LoVo cells into the spleen of the mice (n=6 per group). (E) The mRNA expression levels of LINC00485, miR-581, EDEM1, cytokeratin, E-cadherin, N-cadherin, and vimentin in hepatic nodules following injection of LINC00485-overexpressed LoVo cells into the spleen of the mice (n=6 per group). (F) Representative images of tumors derived from LoVo cells at day 42. Nude mice bearing xenograft tumors received miR-581 antagomir once a week (n=6 per group). (G) Tumor diameter in LoVo-bearing nude mice with administration of miR-581 antagomir once a week (n=6 per group). (H) Tumor volume of LoVo-bearing nude mice with administration of miR-581 antagomir was evaluated at day 42. (I) The number of hepatic nodules in a CRC liver metastases mouse model at day 28 after injection of LoVo cells into the spleen of the mice (n=6 in each group). Mice received miR-581 antagomir once a week for 4 weeks. (J) The mRNA expression levels of LINC00485, miR-581, EDEM1, cytokeratin, E-cadherin, N-cadherin, vimentin and Ki-67 in hepatic nodules in a CRC liver metastases mouse model at day 28 after injection of LoVo cells into the spleen of the mice (n=6 in each group). Then, the mice received miR-581 antagomir once a week for 4 weeks. Data were analyzed using student’s t-test. Bars were represented as S.D. *P<0.05; **P<0.01; ***P<0.001. OE, overexpression.
Discussion
Herein, we reported the role of LINC00485 in CRC progression. LINC00485 is downregulated in CRC tissues and cancer cells (LoVo, SW480, HCT8) compared with paired normal samples and human normal colonic epithelial cells (FHC, NCM460, CCD-18co). The LINC00485/miR-581/EDEM1 regulatory axis promotes the proliferation, migration, invasion, and EMT of CRC cells. Further, using the xenograft nude mouse model, we found that LINC00485 knockdown or downregulation of miR-581 not only significantly repressed CRC cell growth, causing a decrease in tumor volume, but also prevented CRC liver metastasis. Our findings suggested that LINC00485 plays an important role in CRC progression by regulating the miR-581/EDEM1 axis.
CRC is a serious threat to human health, and leads to hundreds of thousands of deaths annually [1, 18]. Although there are many studies on the pathogenesis of CRC [19–22], the molecular mechanisms underlying CRC are still unknown. Hence, elucidating the biological functions of genes and molecules involved in the occurrence and development of CRC is of benefit for drug development and targeted treatments.
Cancer cell proliferation is one of the ten malignant hallmarks of malignancy [23], and tumor metastasis is the main cause of death in patients with cancer [24]. Mounting evidence has shown that non-coding RNAs, including lincRNA [25] and miRNA [26, 27], exhibit antitumor effects by inhibiting the proliferation of CRC cells. In the present study, we found that low expression of LINC00485 promoted the proliferation, migration, and invasion of CRC cells, which are distinct features of malignant tumor cells [23]. Moreover, LINC00485 overexpression significantly restricted tumor growth and liver metastasis of colorectal carcinoma in vivo. These results indicated that aberrant expression of LINC00485 in CRC may play an important role in CRC progression. Conversely, it has been reported that LINC00485 is overexpressed in LAC cells and that it exerted its functional activity by targeting the miR-195/CHEK1 axis [14]; therefore, we suspected that LINC00485 may have a characteristic tissue-specific expression. Further work is required to elucidate the molecular mechanisms underlying this phenomenon.
LincRNAs are mostly found in the cytoplasm [14, 28] and exert their biological activities by sponging miRNA [8]. Herein, our results confirmed that LINC00485 was predominantly localized within the cytoplasm and acted directly on miR-581. Lower expression of LINC00485 contributed to the upregulation of miR-581 in CRC, promoting the proliferation, migration, and invasion of CRC cells, which was consistent with previous studies indicating that the up-regulation of miR-581 regulated the SMAD7/TGFβ signaling pathway, driving CRC metastasis [29]. Further, miRNAs regulate the translation of mRNAs through direct base pairing with specific sites present in the 3’UTR of mRNA [30, 31]. In this study miR-581 directly targeted the 3’UTR of EDEM1 mRNA. EDEM1 is a crucial regulator of the endoplasmic reticulum (ER)-associated degradation (ERAD) pathway, which recognizes N-glycans on misfolded proteins through the mannosidase-like domain (MLD), resulting in the degradation of misfolded glycoproteins [32–34]. The accumulation of misfolded glycoproteins was shown to induce ER stress followed by the activation of autophagy [35]. Autophagy is an important mechanism that the cell utilizes to sustain tumor cell metabolism [36].
The EMT process is closely linked to tumor progression and metastasis [17, 37, 38], and involves epithelial cells losing epithelial characteristics and gaining a mesenchymal phenotype. Based on our results, overexpression of LINC00485 significantly down-regulated the expression of mesenchymal markers N-cadherin and vimentin, whereas the expression levels of epithelial markers E-cadherin and cytokeratin were upregulated by directly modulating the miR-581/EDEM1 axis, suggesting that cancer cells lose their malignant phenotype. LINC00485 has multiple roles in the pathogenesis of CRC. Other mechanisms including CRC development and progression merit further investigation.
In conclusion, our findings identified that LINC00485 was downregulated in CRC tissues in comparison with adjacent normal tissues. Low expression of LINC00485 was associated with poor prognosis of CRC patients. Downregulation of LINC00485 contributed to decreased expression of EDEM1 by sponging of miR-581, thereby facilitating CRC cell proliferation, migration, invasion, and the processed of EMT. We show that the LINC00485/miR-581/EDEM1 regulatory axis is implicated in regulating the malignant phenotypes of CRC cells both in vivo and in vitro. Our findings contribute to the elucidation of the molecular pathogenesis underlying CRC.
Materials and Methods
Patient samples
We collected 52 matched samples (surgically excised tumor tissues and adjacent healthy tissues) from CRC patients with no other medical illnesses, comorbidities, or undergoing neoadjuvant chemoradiotherapy prior to surgery. The detailed information on the enrolled CRC patients is listed in Table 1. Tissues were frozen and rapidly stored in liquid nitrogen after surgical removal. Written informed consent was obtained from patients enrolled in this study. This study was approved by the Ethics Committee of Nanjing First Hospital, Nanjing Medical University.
Table 1. Clinical parameters of patients with colorectal cancer (n = 52).
| Clinicopathological characteristics | Cases (%) | ||||||||||||||||||||||||||||||||||||||||||||||||||||||||||||||||||||||||||||||||||||||||||||||||||
| Age | |||||||||||||||||||||||||||||||||||||||||||||||||||||||||||||||||||||||||||||||||||||||||||||||||||
| ≤60 | 31 (59.62) | ||||||||||||||||||||||||||||||||||||||||||||||||||||||||||||||||||||||||||||||||||||||||||||||||||
| >60 | 21 (40.38) | ||||||||||||||||||||||||||||||||||||||||||||||||||||||||||||||||||||||||||||||||||||||||||||||||||
| Gender | |||||||||||||||||||||||||||||||||||||||||||||||||||||||||||||||||||||||||||||||||||||||||||||||||||
| Male | 37 (71.15) | ||||||||||||||||||||||||||||||||||||||||||||||||||||||||||||||||||||||||||||||||||||||||||||||||||
| Female | 15 (28.85) | ||||||||||||||||||||||||||||||||||||||||||||||||||||||||||||||||||||||||||||||||||||||||||||||||||
| TNM stage | |||||||||||||||||||||||||||||||||||||||||||||||||||||||||||||||||||||||||||||||||||||||||||||||||||
| I/II | 29 (55.77) | ||||||||||||||||||||||||||||||||||||||||||||||||||||||||||||||||||||||||||||||||||||||||||||||||||
| III/IV | 23 (44.23) | ||||||||||||||||||||||||||||||||||||||||||||||||||||||||||||||||||||||||||||||||||||||||||||||||||
| Lymph node metastasis | |||||||||||||||||||||||||||||||||||||||||||||||||||||||||||||||||||||||||||||||||||||||||||||||||||
| Yes | 28 (53.85) | ||||||||||||||||||||||||||||||||||||||||||||||||||||||||||||||||||||||||||||||||||||||||||||||||||
| No | 24 (46.15) | ||||||||||||||||||||||||||||||||||||||||||||||||||||||||||||||||||||||||||||||||||||||||||||||||||
| Tumor invasion depth | |||||||||||||||||||||||||||||||||||||||||||||||||||||||||||||||||||||||||||||||||||||||||||||||||||
| T1/T2 | 30 (57.69) | ||||||||||||||||||||||||||||||||||||||||||||||||||||||||||||||||||||||||||||||||||||||||||||||||||
| T3/T4 | 22 (42.31) | ||||||||||||||||||||||||||||||||||||||||||||||||||||||||||||||||||||||||||||||||||||||||||||||||||
| TNM, tumor node-metastasis. | |||||||||||||||||||||||||||||||||||||||||||||||||||||||||||||||||||||||||||||||||||||||||||||||||||
Cell culture
Human normal colorectal epithelial cell lines CCD-18co, NCM460, FHC, and human CRC cell lines SW460, HCT8, LoVo were purchased from the Cell Bank of Type Culture Collection of Chinese Academy of Sciences (Shanghai, China). CRC cells and CCD-18co cells were cultured in Dulbecco's modified Eagle's medium (DMEM) (Gibco, Thermo Fisher Scientific, USA) containing 10% fetal bovine serum (FBS) (Gibco) and 1% penicillin-streptomycin (Gibco). NCM460 cells were cultured by McCoy's 5A (modified) Medium (Gibco) with 10% FBS and 1% penicillin-streptomycin. FHC cells were cultured in DMEM/F12 medium (Gibco) supplemented with 10% FBS, 10 ng/mL cholera toxin, 10 mM 4-(2-hydroxyethyl)-1-piperazineethanesulfonic acid (HEPES), 10 mM insulin, 100 ng/mL hydrocortisone, and 10 mM transferrin.
Establishment of cell lines overexpressing or silencing LINC00485
To construct the LINC00485-overexpressing cell line, mRNA of LINC00485 was reverse transcribed into cDNA and then cloned into the multicloning site of the pLVX plasmid (Sangon Biotech Co., Ltd., Shanghai, China) using cloning primers that incorporated an XhoI site (5’-CCCTCGACTGCGCCCGAGAGGCAGCG-3’) and a PstI site (5’-AACTGCAAACTAGGTCATCTGTTTATT-3’). The construct was subsequently, co-transfected with the packaging plasmids (Sangon Biotech Co., Ltd.) into 293T cells to produce virus particles using the Lipofectamine 3000 transfection reagent (Invitrogen). The virus was collected and mixed in the presence of polybrene (Sangon Biotech Co., Ltd.) to infect LoVo cells. Afterwards, 10 μg/mL of puromycin was used to screen stably expressing cells for 3 days. For the construction of the LINC00485 knockdown cell line, FHC cells were infected with the LINC00485 RNAi lentivirus (Genechem Incorporation, Shanghai, China). The shRNA sequence targeting LINC00485 was as follows: 5’-AATAACCAACCCTATAAACAT-3’.
Cell transfection
Lipofectamine 2000, miR-581 mimics (5’-UGACUAGAUCUCUUGUGUUCU-3’), miR-581 antagomir (5’-AGAACACAAGAGAUCUAGUCA-3’) and siEDEM1 (5’-UAUUCUGUGAGCAGAAAGGAG-3’) were obtained from Sangon Biotech Co. Ltd. A concentration of 50 nM mimics or antagomir or siEDEM1 was transiently transfected into FHC or LoVo cells using Lipofectamine 2000 according to the manufacturer’s protocol.
Construction of reporter vectors and luciferase assay
Dual-luciferase reporter assays were performed using the Dual-Luciferase Assay Kit (TransGen Biotech Co., Ltd., Beijing, China), and Renilla luciferase activity served as an internal control for transfection efficiency. The WT 3'UTR of EDEM1 or WT LINC00485 (the binding sites with miR-581) was cloned into pGL3 luciferase reporter vector. Primers for LINC00485 were as follows: the forward primer incorporated the PstI restriction site (5’-AACTGCAGAGAGGCAGCGCTCAGACAGC-3’); the reverse primer incorporated the EcoRI restriction site (5’-CGGAATTCTCCGACTTCCAGTTGGGTTC-3’). The primers for cloning the EDEM1 3’UTR fragment were established as follows: the forward primer incorporated the XbaI restriction site (5’-CTAGTCTAGATTCCTGTCCATTCCCAGCAT-3’); the reverse primer incorporated the XhoI restriction site (5’- CTAGTCTAGACGTAAGTTTTCCCAGAGTTTCCA-3’). The amplified product (4047 bp) of EDEM1was cloned into the pGL3 vector to construct the 3'UTR reporter vector.
Additionally, a high-fidelity amplification kit (Fast Mutagenesis System, #FM111-01, TransGen Biotech Co., Ltd., Beijing, China) and point mutation primers were used to amplify the above plasmid to obtain mutated EDEM1 3'UTR vectors. N, N'-dimethyltryptamine (DMT) was applied to screen the mutated EDEM1 3’UTR reporter plasmid. Empty plasmid pGL3 was used as the control. Luciferase reporter vectors containing mutated LINC00485 were also constructed. Afterwards, as the experiment design showed, the corresponding vectors were co-transfected with miR-581 mimics into 293T cells. Luciferase activity was measured by CLARIOstar® Microplate Reader (BMG Labtech Inc., Germany) at 48 h post transfection.
Fluorescence in situ hybridization assay
The Fluorescence in situ hybridization (FISH) assay was used to analyze the subcellular localization of RNA. The corresponding probes were synthesized by Genechem (Shanghai Genechem Co., Ltd., China) based on the sequences of LINC00485 and miR-581. Tissue sections or culturing LoVo cells on sterile glass slides were fixed by immersing slides in 4% formaldehyde for 10 min at room temperature. Subsequently, the slides were treated with pre-chilled PBS containing 0.4% Triton X-100 and 10 μM vanadyl ribonucleoside complexes (VRC) for 30 min at room temperature following hybridization with Cy5-(red, indole dicarboxylic cyanide) labeled LINC00485 probes or incubation with FAM-labeled miRNA-specific probes (green, carboxy fluorescein) at 37° C for 12 h. After staining the nuclei with 4',6-diamidino-2-phenylindole (DAPI), images were captured by fluorescence microscopy (Olympus, Japan).
RNA immunoprecipitation experiment
After lysis of the cells according to the instructions of the Magna RIP™ RNA-binding protein Immunoprecipitation Kit (Millipore, Stafford, VA, USA), the cell lysates were incubated with biotin-labeled LINC00485 for 2 h at 4° C. Biotin-labeled nonsense oligonucleotides were used as negative controls. Streptavidin magnetic beads were incubated for 12 h at 4° C to capture the hybridized nucleic acids. After precipitation by magnetic separation, TRIzol was used to dissolve the precipitate for RNA extraction. Reverse transcription and RT-qPCR assays were then performed to determine the expression levels of miR-581.
Cell counting kit-8 assay
The cells were cultured using a 96-well plate with a transparent bottom (Corning Inc., USA). Cell proliferation was determined following the manufacturer's guidelines. Briefly, after incubation with 10% (CCK-8) reagent (Beyotime Biotechnology, Shanghai, China) at 37° C, absorbance at 450 nm was detected at different time points. The absorbance value was used to evaluate cell proliferative ability.
Colony formation assay
Cells (1 × 10³) were seeded into 6-well dishes, and then cultured for 10 days. After being fixed in 4% paraformaldehyde, the cells were stained with 0.1% Crystal Violet Staining Solution (Beyotime Biotechnology) for 30 min at room temperature followed by observation under the microscope (Leica, Germany). The number of cell colonies were quantified using ImageJ v1.8.0 from ten randomly selected fields.
Detection of Ki-67 by flow cytometry
Cells were collected and fixed with 4% paraformaldehyde for 30 min following treatment with 0.2% Triton X-100 for 30 min at room temperature. Thereafter, the cells were incubated with anti-Ki-67 antibody (dilution 1:300, #9129S, Cell Signaling Technology, USA) prepared by 5% bovine serum albumin (BSA) solution overnight at 4° C. After coupling with the fluorescent-labeled secondary antibody (dilution 1:500, #4412S, Cell Signaling Technology), fluorescence activity was detected by flow cytometry. Results were analyzed using Flow Jo 7.6.1 (Becton, Dickinson and Company, USA).
RNA preparation and quantitative PCR (qPCR)
Total RNA was isolated and purified using TRIZol reagent (Thermo Fisher Scientific, Inc., USA) according to the manufacturer's instructions. Mir-X miRNA First-Strand Synthesis Kit (Catalog No. 638315, Takara Biomedical Technology (Beijing) Co., Ltd., China) and Mir-X miRNA quantitative real time polymerase chain reaction (qRT-PCR) TB Green® Kit (Catalog No. 638316, Takara Biomedical Technology (Beijing) Co., Ltd.) were used for miRNA detection. The thermocycling conditions for to detect miRNA expression were as follows: 95° C for 30 s, followed by 40 cycles at 95° C for 15 s, 60° C for 60 s, and 72° C for 10 s. PrimeScript™ RT Master Mix (Perfect Real Time) (Catalog No. RR036A, Takara Biomedical Technology (Beijing) Co., Ltd.) and One Step TB Green® PrimeScript™ RT-PCR Kit (Perfect Real Time) (Catalog No. RR066A, Takara Biomedical Technology (Beijing) Co., Ltd.) were used to evaluate gene expression. RT-qPCR thermocycling parameters to detect gene expression and lncRNA levels were 95° C for 30 s, followed by 40 cycles at 95° C for 15 s, 60° C for 30 s, and 72° C for 10 s. U6 and β-actin served as the internal controls for miRNA levels and gene expression, respectively.
All primers were synthesized by Sangon Biotech Shanghai Company and were showed as follows: β-actin forward: 5’-CCTCGCCTTTGCCGATCC-3’, reverse: 5’-GGATCTTCATGAGGTAGTCAGTC-3’; Cytokeratin forward: 5’-ACCAAGTTTGAGACGGAACAG-3’, reverse: 5’-CCCTCAGCGTACTGATTTCCT-3’; Vimentin forward: 5’-GCCCTAGACGAACTGGGTC-3’, reverse: 5’-GGCTGCAACTGCCTAATGAG-3’; EDEM1 forward: 5’-CGGACGAGTACGAGAAGCG-3’, reverse: 5’-CGTAGCCAAAGACGAACATGC-3’; E-Cadherin forward: 5’-CGAGAGCTACACGTTCACGG-3’, reverse: 5’-GGGTGTCGAGGGAAAAATAGG-3’; N-Cadherin forward: 5’-TCAGGCGTCTGTAGAGGCTT-3’, reverse: 5’-ATGCACATCCTTCGATAAGACTG-3’; Linc00485 forward: 5’-CTGATACATCGCTACTTCTG-3’, reverse: 5’-GTAATCTAACTACTCACACTA-3’; hsa-miR-581 forward: 5’-GAUCUCUUGUGUUCU-3’, reserve: 5’-ATACCTCGGACCCTGCACTG-3’; U6 forward: 5’-CTCGCTTCGGCAGCACA-3’, reverse: 5’-AACGCTTCACGAATTTGCG-3’.
Western blotting analysis
Total protein was extracted using RIPA lysis buffer (Beyotime Biotechnology). The concentration of proteins was quantified using the bicinchoninic acid (BCA) assay (Beyotime Biotechnology). Proteins were further separated by 10% sodium dodecyl sulfate-polyacrylamide gel electrophoresis (SDS-PAGE) and then transferred onto polyvinylidene difluoride (PVDF) membranes (Millipore, Bedford, MA, USA). Afterwards, the membranes were incubated with the primary antibodies overnight at 4° C before blocking with 5% nonfat dry milk, washed three times with Tris buffered saline with tween (TBST), and then incubated with horseradish peroxidase-conjugated secondary antibodies for 2 h at room temperature. Blots were visualized using BeyoECL Plus (Beyotime Biotechnology). The antibodies used in this study were those listed below: mouse anti-E-Cadherin (dilution 1:1000, #14472, Cell Signaling Technology), mouse anti-N-Cadherin (dilution 1:1000, #14215), mouse anti-Cytokeratin (dilution 1:1000, #4545), mouse anti-Vimentin (dilution 1:1000, #49636), rabbit anti-β-actin (dilution 1:5000, ab179467, Abcam, Cambridge, UK), rabbit anti-EDEM1 (dilution 1:1000, ab200645), HRP-conjugated goat anti-rabbit rabbit (dilution 1:8000, ab6721), and goat anti-mouse rabbit (dilution 1:8000, ab6789) secondary antibody.
In vitro scratch assay
Cells were seeded into 6-well plates (1 × 10⁶ cells/well). When the cell confluence reached 90%, a pipette tip was used to scratch a gap on the cell monolayer and cultures were observed at 0, 24, 48, and 72 h. The rate of closure was assessed from three independent experiments.
Transwell migration and invasion assays
For cell migration and invasion (the upper chamber was coated with Matrigel) assays, a 24-well Transwell plate system (Cell BioLabs, Inc., San Diego, CA, USA) was used to measure the migration and invasive capabilities of both CRC and FHC cells. Matrigel was obtained from Gibco. The experimental protocol has been described previously in detail [27]. After seeding, waited 12 hours before subsequent fixation, staining, and photographing.
Animal experiments
For the tumor xenograft model, LoVo cells overexpressing LINC00485 (1 × 10⁶ cells in 50 μL of PBS) or control cells (equal loading volumes) were implanted subcutaneously into the flank regions of 8-week-old female nude BALB/c mice (a total of 12 mice; 6 mice per group). In a different set of experiments, LoVo cells (1 × 10⁶ cells in 50 μL) were subcutaneously injected into the dorsal surface of nude mice (a total of 12 mice; 6 mice per group), in which six randomly selected animals were intratumorally injected with miR-581 antagomir (13 μg in a 100 μL volume per mouse) plus an equal volume of Lipofectamine 2000 once weekly. The mock group (n=6) received an equal volume of phosphate buffered saline (PBS) solution. Tumor diameters were measured every 7 days. The animals were sacrificed on day 42, and tumors were meticulously excised. The tissue volume was calculated using the formula: 0.5 × width2 × length.
To examine the ability of tumor cells to metastasize to the liver, LoVo cells (1 × 10⁶ cells in 50 μL) were injected into the spleen of mice (a total of 12 mice; 6 mice per group) under anesthesia. MiR-581 antagomir (13 μg in volume of 100 μL per mouse) plus an equal volume of Lipofectamine 2000 was administered via tail vein once weekly. Another six animals received an equal volume of PBS plus Lipofectamine 2000. Additionally, we inoculated LoVo cells or LoVo cells overexpressing LINC00485 (1 × 10⁶ cells in 50 μL) into the spleen of nude mice (a total of 12 mice; 6 mice per group) as mentioned above. All animals were sacrificed on day 28, liver tissues were carefully removed and fixed with 10% formalin solution. Paraffin sections (5 μm) were prepared for hematoxylin-eosin (H&E) staining and all metastatic nodules were counted in the section. Mice used in this study were purchased from Model Animal Research Center of Nanjing University. Animal experiments were approved by the Institutional Animal Care and Use Committee of Nanjing First Hospital.
Statistical analysis
Differences between two groups were assessed by applying student’s t-test. Multiple comparison was analyzed using the one-way analysis of variance (ANOVA) with Fisher's least significant difference (LSD) test. Survival analysis was analyzed using Kaplan-Meier survival curves with a log-rank test. Data are expressed as mean ± standard deviation (SD). P < 0.05 indicated that the difference was statistically significant. All in vitro experiments were performed in three independent experiments.
Supplementary Materials
Author Contributions
Shukui Wang and Chenmeng Li designed experiments; Chenmeng Li and Pan Bei carried out experiments and analyzed experimental results. Bangshun He, Yuqin Pan, Huiling Sun and Tao Xu developed analysis tools and provided technical guidance. Xuhong Wang, Xiangxiang Liu, Kaixuan Zeng, Xueni Xu and Jian Qin assisted with animal experiments and collected patients’ clinical information. Chenmeng Li wrote the manuscript. All authors have read and approved the final manuscript.
Conflicts of Interest
The authors declare that they have no conflicts of interest.
Funding
This project was supported by grants from The National Nature Science Foundation of China (No. 81972806), Jiangsu Provincial Key Research and Development Plan (BE2019614), Key Project of Science and Technology Development of Nanjing Medicine (ZDX16001) to SKW; The National Nature Science Foundation of China (No. 81802093) to HLS; Innovation team of Jiangsu provincial health-strengthening engineering by science and education (CXTDB20170080); Jiangsu Youth Medical Talents Training Project to BSH (QNRC2016066) and YQP (QNRC2016074); Key Project of Science and Technology Development of Nanjing Medicine (ZKX18030, breast cancer); Jiangsu 333 High-level Talents Cultivating Project (Gastric cancer, no. BRA201702) and Jiangsu Cancer Personalized Medicine Collaborative Innovation Center.
References
- 1. Brody H. Colorectal cancer. Nature. 2015; 521:S1. https://doi.org/10.1038/521S1a [PubMed]
- 2. Bray F, Ferlay J, Soerjomataram I, Siegel RL, Torre LA, Jemal A. Global cancer statistics 2018: GLOBOCAN estimates of incidence and mortality worldwide for 36 cancers in 185 countries. CA Cancer J Clin. 2018; 68:394–424. https://doi.org/10.3322/caac.21492 [PubMed]
- 3. He Q, Long J, Yin Y, Li Y, Lei X, Li Z, Zhu W. Emerging roles of lncRNAs in the formation and progression of colorectal cancer. Front Oncol. 2020; 9:1542. https://doi.org/10.3389/fonc.2019.01542 [PubMed]
- 4. Shirafkan N, Mansoori B, Mohammadi A, Shomali N, Ghasbi M, Baradaran B. MicroRNAs as novel biomarkers for colorectal cancer: new outlooks. Biomed Pharmacother. 2018; 97:1319–30. https://doi.org/10.1016/j.biopha.2017.11.046 [PubMed]
- 5. Taborda MI, Ramírez S, Bernal G. Circular RNAs in colorectal cancer: possible roles in regulation of cancer cells. World J Gastrointest Oncol. 2017; 9:62–69. https://doi.org/10.4251/wjgo.v9.i2.62 [PubMed]
- 6. Chalbatani GM, Dana H, Memari F, Gharagozlou E, Ashjaei S, Kheirandish P, Marmari V, Mahmoudzadeh H, Mozayani F, Maleki AR, Sadeghian E, Nia EZ, Miri SR, et al. Biological function and molecular mechanism of piRNA in cancer. Pract Lab Med. 2018; 13:e00113. https://doi.org/10.1016/j.plabm.2018.e00113 [PubMed]
- 7. Kondo Y, Shinjo K, Katsushima K. Long non-coding RNAs as an epigenetic regulator in human cancers. Cancer Sci. 2017; 108:1927–33. https://doi.org/10.1111/cas.13342 [PubMed]
- 8. Ulitsky I, Bartel DP. lincRNAs: genomics, evolution, and mechanisms. Cell. 2013; 154:26–46. https://doi.org/10.1016/j.cell.2013.06.020 [PubMed]
- 9. Ransohoff JD, Wei Y, Khavari PA. The functions and unique features of long intergenic non-coding RNA. Nat Rev Mol Cell Biol. 2018; 19:143–57. https://doi.org/10.1038/nrm.2017.104 [PubMed]
- 10. Zhang ZW, Chen JJ, Xia SH, Zhao H, Yang JB, Zhang H, He B, Jiao J, Zhan BT, Sun CC. Long intergenic non-protein coding RNA 319 aggravates lung adenocarcinoma carcinogenesis by modulating miR-450b-5p/EZH2. Gene. 2018; 650:60–67. https://doi.org/10.1016/j.gene.2018.01.096 [PubMed]
- 11. Kazemzadeh M, Safaralizadeh R, Feizi MA, Ravanbakhsh R, Somi MH, Hashemzadeh S. LOC100287225, novel long intergenic non-coding RNA, misregulates in colorectal cancer. Cancer Biomark. 2016; 16:499–505. https://doi.org/10.3233/CBM-160589 [PubMed]
- 12. Liu Y, Gao X, Tian X. High expression of long intergenic non-coding RNA LINC00662 contributes to malignant growth of acute myeloid leukemia cells by upregulating ROCK1 via sponging microRNA-340-5p. Eur J Pharmacol. 2019; 859:172535. https://doi.org/10.1016/j.ejphar.2019.172535 [PubMed]
- 13. Sakai K, Tanikawa C, Hirasawa A, Chiyoda T, Yamagami W, Kataoka F, Susumu N, Terao C, Kamatani Y, Takahashi A, Momozawa Y, Hirata M, Kubo M, et al. Identification of a novel uterine leiomyoma GWAS locus in a Japanese population. Sci Rep. 2020; 10:1197. https://doi.org/10.1038/s41598-020-58066-8 [PubMed]
- 14. Zuo W, Zhang W, Xu F, Zhou J, Bai W. Long non-coding RNA LINC00485 acts as a microRNA-195 sponge to regulate the chemotherapy sensitivity of lung adenocarcinoma cells to cisplatin by regulating CHEK1. Cancer Cell Int. 2019; 19:240. https://doi.org/10.1186/s12935-019-0934-7 [PubMed]
- 15. Wang YQ, Ren YF, Song YJ, Xue YF, Zhang XJ, Cao ST, Deng ZJ, Wu J, Chen L, Li G, Shi KQ, Chen YP, Ren H, et al. MicroRNA-581 promotes hepatitis B virus surface antigen expression by targeting dicer and EDEM1. Carcinogenesis. 2014; 35:2127–33. https://doi.org/10.1093/carcin/bgu128 [PubMed]
- 16. Paraskevopoulou MD, Vlachos IS, Karagkouni D, Georgakilas G, Kanellos I, Vergoulis T, Zagganas K, Tsanakas P, Floros E, Dalamagas T, Hatzigeorgiou AG. DIANA-LncBase v2: indexing microRNA targets on non-coding transcripts. Nucleic Acids Res. 2016; 44:D231–38. https://doi.org/10.1093/nar/gkv1270 [PubMed]
- 17. Mittal V. Epithelial mesenchymal transition in tumor metastasis. Annu Rev Pathol. 2018; 13:395–412. https://doi.org/10.1146/annurev-pathol-020117-043854 [PubMed]
- 18. Dekker E, Tanis PJ, Vleugels JL, Kasi PM, Wallace MB. Colorectal cancer. Lancet. 2019; 394:1467–80. https://doi.org/10.1016/S0140-6736(19)32319-0 [PubMed]
- 19. Henrikson NB, Webber EM, Goddard KA, Scrol A, Piper M, Williams MS, Zallen DT, Calonge N, Ganiats TG, Janssens AC, Zauber A, Lansdorp-Vogelaar I, van Ballegooijen M, Whitlock EP. Family history and the natural history of colorectal cancer: systematic review. Genet Med. 2015; 17:702–12. https://doi.org/10.1038/gim.2014.188 [PubMed]
- 20. Jiao S, Peters U, Berndt S, Brenner H, Butterbach K, Caan BJ, Carlson CS, Chan AT, Chang-Claude J, Chanock S, Curtis KR, Duggan D, Gong J, et al. Estimating the heritability of colorectal cancer. Hum Mol Genet. 2014; 23:3898–905. https://doi.org/10.1093/hmg/ddu087 [PubMed]
- 21. Nakatsu G, Li X, Zhou H, Sheng J, Wong SH, Wu WK, Ng SC, Tsoi H, Dong Y, Zhang N, He Y, Kang Q, Cao L, et al. Gut mucosal microbiome across stages of colorectal carcinogenesis. Nat Commun. 2015; 6:8727. https://doi.org/10.1038/ncomms9727 [PubMed]
- 22. Cancer Genome Atlas Network. Comprehensive molecular characterization of human colon and rectal cancer. Nature. 2012; 487:330–37. https://doi.org/10.1038/nature11252 [PubMed]
- 23. Hanahan D, Weinberg RA. Hallmarks of cancer: the next generation. Cell. 2011; 144:646–74. https://doi.org/10.1016/j.cell.2011.02.013 [PubMed]
- 24. Chaffer CL, Weinberg RA. A perspective on cancer cell metastasis. Science. 2011; 331:1559–64. https://doi.org/10.1126/science.1203543 [PubMed]
- 25. Liu T, Zhang J, Chai Z, Wang G, Cui N, Zhou B. Ginkgo biloba extract EGb 761-induced upregulation of LincRNA-p21 inhibits colorectal cancer metastasis by associating with EZH2. Oncotarget. 2017; 8:91614–27. https://doi.org/10.18632/oncotarget.21345 [PubMed]
- 26. Chen X, Zeng K, Xu M, Liu X, Hu X, Xu T, He B, Pan Y, Sun H, Wang S. P53-induced miR-1249 inhibits tumor growth, metastasis, and angiogenesis by targeting VEGFA and HMGA2. Cell Death Dis. 2019; 10:131. https://doi.org/10.1038/s41419-018-1188-3 [PubMed]
- 27. Chen X, Xu X, Pan B, Zeng K, Xu M, Liu X, He B, Pan Y, Sun H, Wang S. miR-150-5p suppresses tumor progression by targeting VEGFA in colorectal cancer. Aging (Albany NY). 2018; 10:3421–37. https://doi.org/10.18632/aging.101656 [PubMed]
- 28. Yoon JH, Abdelmohsen K, Srikantan S, Yang X, Martindale JL, De S, Huarte M, Zhan M, Becker KG, Gorospe M. LincRNA-p21 suppresses target mRNA translation. Mol Cell. 2012; 47:648–55. https://doi.org/10.1016/j.molcel.2012.06.027 [PubMed]
- 29. Zhao X, Liu S, Yan B, Yang J, Chen E. MiR-581/SMAD7 axis contributes to colorectal cancer metastasis: a bioinformatic and experimental validation-based study. Int J Mol Sci. 2020; 21:6499. https://doi.org/10.3390/ijms21186499 [PubMed]
- 30. Thomas J, Ohtsuka M, Pichler M, Ling H. MicroRNAs: clinical relevance in colorectal cancer. Int J Mol Sci. 2015; 16:28063–76. https://doi.org/10.3390/ijms161226080 [PubMed]
- 31. Chi Y, Zhou D. MicroRNAs in colorectal carcinoma—from pathogenesis to therapy. J Exp Clin Cancer Res. 2016; 35:43. https://doi.org/10.1186/s13046-016-0320-4 [PubMed]
- 32. Papaioannou A, Higa A, Jégou G, Jouan F, Pineau R, Saas L, Avril T, Pluquet O, Chevet E. Alterations of EDEM1 functions enhance ATF6 pro-survival signaling. FEBS J. 2018; 285:4146–64. https://doi.org/10.1111/febs.14669 [PubMed]
- 33. Lamriben L, Oster ME, Tamura T, Tian W, Yang Z, Clausen H, Hebert DN. EDEM1’s mannosidase-like domain binds ERAD client proteins in a redox-sensitive manner and possesses catalytic activity. J Biol Chem. 2018; 293:13932–45. https://doi.org/10.1074/jbc.RA118.004183 [PubMed]
- 34. Roth J, Zuber C. Quality control of glycoprotein folding and ERAD: the role of N-glycan handling, EDEM1 and OS-9. Histochem Cell Biol. 2017; 147:269–84. https://doi.org/10.1007/s00418-016-1513-9 [PubMed]
- 35. Ogata M, Hino S, Saito A, Morikawa K, Kondo S, Kanemoto S, Murakami T, Taniguchi M, Tanii I, Yoshinaga K, Shiosaka S, Hammarback JA, Urano F, Imaizumi K. Autophagy is activated for cell survival after endoplasmic reticulum stress. Mol Cell Biol. 2006; 26:9220–31. https://doi.org/10.1128/MCB.01453-06 [PubMed]
- 36. Poillet-Perez L, White E. Role of tumor and host autophagy in cancer metabolism. Genes Dev. 2019; 33:610–19. https://doi.org/10.1101/gad.325514.119 [PubMed]
- 37. Zhang Y, Weinberg RA. Epithelial-to-mesenchymal transition in cancer: complexity and opportunities. Front Med. 2018; 12:361–73. https://doi.org/10.1007/s11684-018-0656-6 [PubMed]
- 38. Moustakas A, de Herreros AG. Epithelial-mesenchymal transition in cancer. Mol Oncol. 2017; 11:715–17. https://doi.org/10.1002/1878-0261.12094 [PubMed]