


Introduction
Glioblastoma (GBM) is the most common malignancy in the adult central nervous system (CNS) and presents aggressive behavior and poor prognosis. Despite standard therapies, including tumor resection, concomitant radiotherapy, or adjuvant chemotherapy plus temozolomide, the outcome of patients is still very limited with a five-year overall survival of only 5.6% [1, 2]. Recent molecular analyses of glioma samples based on large-scale cohorts provide new inspiration for therapeutic development and clinical management [3, 4]. In 2016, the revision of the WHO classification of CNS tumors has highlighted the importance of the IDH1 or IDH2 mutation and co-deletion of chromosomal arms 1p and 19q for the diagnosis of gliomas [5]. This breaks with the old principle of diagnosis based entirely on phenotype by incorporating both histological and genetic alternations into the definition of new entities for the first time [6, 7].
Based on isocitrate dehydrogenase (IDH) 1/2 mutation status, glioblastomas can also be defined as primary (IDH1/2 wildtype), which originate de novo and secondary (IDH1/2 mutant), which evolve from lower grade gliomas (accounting for 80% IDH1/2 mutant cases) [8]. Compared to IDH1/2 mutant gliomas, the IDH wild-type gliomas represent the most devastating subgroups with heterogeneous genetic background and poor outcome [9–11]. However, understanding of the tumoral metabolism behind the development and progression of IDH wild-type gliomas remains lacking and new prognostic biomarkers and effective therapeutic targets for GBM still need to be identified.
Branched-chain amino acid transaminase 1 (BCAT1) is a cytosolic enzyme that catalyzes the transformation of branched-chain L-amino acids (BCAA) into branched-chain α-ketoacids (BCKA), with concomitant conversion of α-KG to glutamate [12, 13]. Emerging evidence suggests that BCAT1 plays a vital role in the progression of many cancers [14–17], especially highlighting the tight connection between BCAT1 level and IDH1 mutation status [18]. For glioma, it is indicated that loss of BCAT1 is a sensitive marker for IDH-mutant diffuse gliomas and that decreased expression of BCAT1 correlates with improved patient survival in IDH wild-type gliomas. ®-2-hydroxyglutarate, produced by IDH1/2 mutants, can inhibit the BCAT transaminases thus increases tumoral reliance on glutaminase for glutamate and glutathione synthesis [19, 20]. Suppression of BCAT1 in glioma cell lines blocked the excretion of glutamate and led to reduced proliferation and invasiveness in vitro, as well as significant decreases in tumor growth in a glioblastoma xenograft model [19, 21]. These studies indicate that BCAT1 is a biomarker for IDH1 wild-type gliomas and is essential for tumor metabolism to maintain an aggressive phenotype. Nonetheless, as a promising target in primary glioblastoma, comprehensive reports on the relationship between BCAT1 gene expression and clinical outcome or molecular features in glioma are still required.
In this study, we collected clinical and transcriptome (RNA-seq) data from The Cancer Genome Atlas (TCGA) and Chinese Glioma Genome Atlas (CGGA) databases, including 1395 glioma samples. Based on the large-scale sample collection, we analyzed the gene expression pattern of BCAT1 in glioma tissues as well as its relationship with IDH1 status and other clinical features. Furthermore, to evaluate potential biological processes that BCAT1 involves in the progression of glioma, we performed a pilot study where we examined the coexpression pattern of BCAT1 with different functional gene subgroups. This is the first comprehensive study to characterize BCAT1 expression in all grades of glioma molecularly and clinically and may provide bases for further evaluation of the roles BCAT1 in glioblastoma progression.
Results
BCAT1 is highly expressed in GBM versus lower grade gliomas
To evaluate the general expression pattern of BCAT1 in gliomas, we compared the mRNA and protein levels of BCAT1 between different tumors, grades, histological and molecular subtypes through several online databases. The mRNA expression of BACT1 in 33 types of tumor tissues (see the extension of tumor abbreviations in Supplementary Table 1) and its paired control tissues were shown in Figure 1A, 1B. Compared to other tumors, glioblastoma (GBM) owns one of the highest levels of BCAT1 expression. Notably, the mRNA level of BCAT1 in GBM is significantly higher than that in LGG. The Human Protein Atlas and TCGA databases also confirmed that gliomas own a high expression of BCAT1 among pan-cancers (Figure 1C, 1D). Collectively, these data indicate that BCAT1 is enriched in glioma tissues and upregulated in GBMs. Furthermore, we took advantage of clinical human glioma samples to detect the protein pattern of BCAT1 and IDH1 R132H in glioma tissues (Figure 1E, 1F). The results showed that BCAT1 is increasingly expressed in glioma tissues corresponding to increasing tumor grade (Figure 1G), and compared to IDH1 wild-type diffuse glioma patients (Figure 1H), the patients that had gained IDH1 R132H mutation showed a lower percentage of tumor cells with detectable BCAT1 expression. In addition, the data from GSE16011, GSE4290, REMBRANDT, TCGA and CGGA datasets reconfirmed our previous findings and detailed that BCAT1 is preferentially expressed in classical and mesenchymal subtype and less expressed in proneural subtype glioblastoma (Supplementary Figure 1).
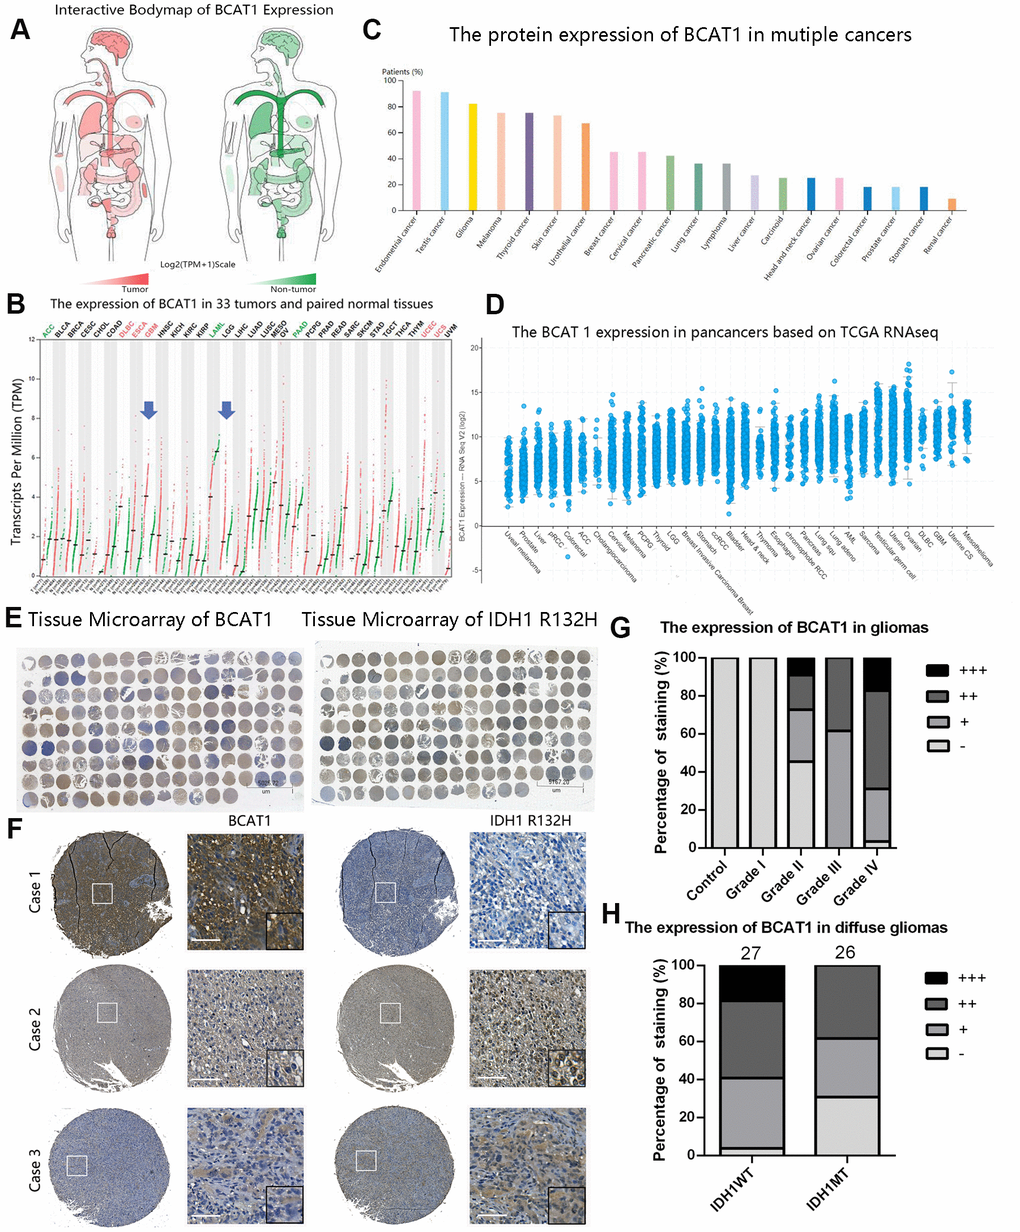
Figure 1. The expression pattern of BCAT1 in pan-cancer and gliomas. (A, B) The mRNA expression profiles of BCAT1 in 33 tumors and paired normal tissues were shown in bodymap and dot plot. (C) The expression pattern of BCAT1 protein in multiple cancer tissues from the Human Protein Atlas. (D) The BCAT1 expression in multiple cancer tissues from TCGA RNAseq. (E) The entire immunohistochemical staining of BCAT1 and IDH1 R132H in tissue microarray. (F) Representative images of BCAT1 and IDH1 R132H staining in three cases of glioma patients. (Case1: GBM, WHO Grade IV; Case2: Anaplastic oligodendroglioma, WHO Grade III; Case3: GBM, WHO Grade IV) (Scale: 100um) (G) Quantitative analysis of BCAT1 immunohistochemical staining in different grades of gliomas. (H) Quantitative analysis of IDH1 R132H immunohistochemical staining in IDH1 wild-type and mutant diffuse gliomas.
High BCAT1 expression is coupled with the poor survival of IDH1 wild-type gliomas
To determine the prognostic value of BCAT1 gene expression and its association with IDH1 status in glioma patients, Kaplan-Meier (K-M) survival curves with known IDH1 wildtype ratio was performed with data from the TCGA and CCGA RNA sequencing datasets. The results showed that the overall survival (OS) time of glioma patients with higher BCAT1 expression (TCGA, IDH1WT:67.8%; CGGA, IDH1WT:74.5%) is shorter than patients with lower BCAT1 expression (TCGA, IDH1WT:5.9%; CGGA, IDH1WT:14.8%) (Figure 2A, 2D). Moreover, in LGG, higher BCAT1 expression (TCGA, IDH1WT:35.7%; CGGA, IDH1WT:41.8%) is also connected with a worse overall survival time than lower BCAT1 expression (TCGA, IDH1WT:1.7%; CGGA, IDH1WT:7.1%) (Figure 2B, 2E), while in GBM, there is no significant difference between BCAT1 higher (TCGA, IDH1WT:100%; CGGA, IDH1WT:91.2%) and lower groups (TCGA, IDH1WT:86.5%; CGGA, IDH1WT:68.4%) (Figure 2C, 2F). Moreover, we found that IDH1 wild-type gliomas showed a higher expression of BCAT1 than mutant types in both TCGA and CGGA datasets (Figure 2G, 2H), and further internal comparison of IDH1 mutant gliomas showed that 1p19q codeleted IDH1 mutant gliomas owns a lower expression than non codeleted 1p19q forms with a significant difference in the CGGA dataset (Figure 2I, 2J). Those results implied that BCAT1 contributes to the poor survival of IDH1 wild-type glioma patients.
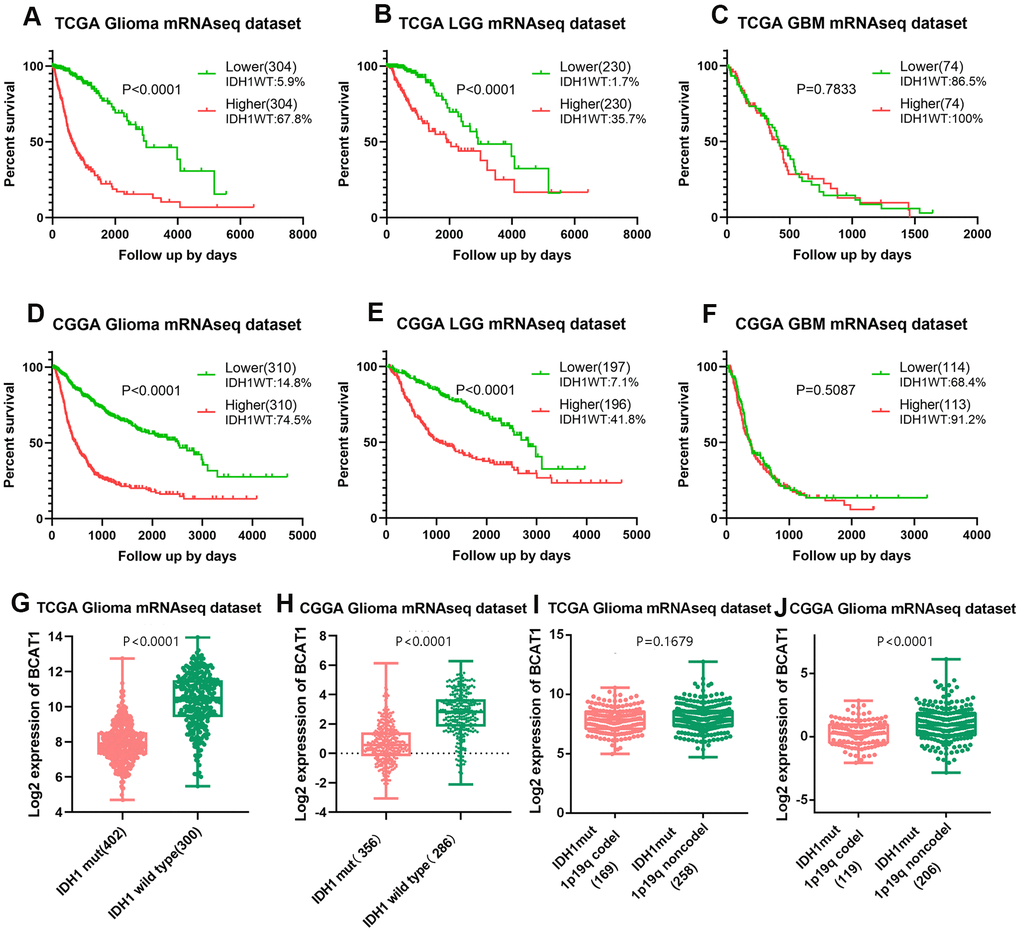
Figure 2. High BCAT1 expression represents poor survival of IDH1 wild-type glioma patients. Representative survival plots of BCAT1 in glioma patients with IDH wild-type proportion attached from TCGA (A–C) and CGGA (D–F) datasets. (G, H) Boxplots showing the distribution of BCAT1 expression in glioma patients according to IDH1 status from TCGA and CGGA datasets. (I, J) Boxplots showing the distribution of BCAT1 expression in IDH1 mutant, 1p19q codeleted glioma patients and IDH1 mutant, 1p19q non codeleted glioma patients from TCGA and CGGA datasets.
BCAT1 correlates with apoptosis, hypoxia, and angiogenesis processes in gliomas
To illuminate the biological features of glioma with different BCAT1 expression, we examined the correlation of BCAT1 expression with angiogenesis, apoptosis and hypoxia marker genes to evaluate the relationship between BCAT1 expression and tumor microenvironment. As shown in functional heatmap analyses, glioma-derived BCAT1 expression was positively correlated with biomarker gene expression of apoptosis, hypoxia and angiogenesis in both the TCGA and CGGA datasets (Figure 3A, 3B). Similarly, Pearson correlation analysis was performed to retest the correlation of interest gene sets with BCAT1 expression in LGG and GBM based on TCGA and CGGA datasets. After screening several apoptosis markers including CASP3, CASP7, CASP8, BCL2, RELA and BAX; hypoxia markers including HIF1A, EPAS1, ARNT, LDHA, SLC2A1 and CA9; angiogenesis markers including VEGFA, KDR, ANGPT2, BAI1, ANGPT1 and FLT1 as shown by correlograms, the results were consistent with the heatmap analysis. BCAT1 expression was positively correlated with apoptosis, hypoxia and angiogenesis markers (Figure 3C–3N). Interestingly, it seems BCAT1 is tighter associated with these genes in GBM than in LGG (Figure 3C–3N). These results suggested that BCAT1 is associated with the apoptosis, hypoxia and angiogenesis processes in gliomas, especially in GBM.
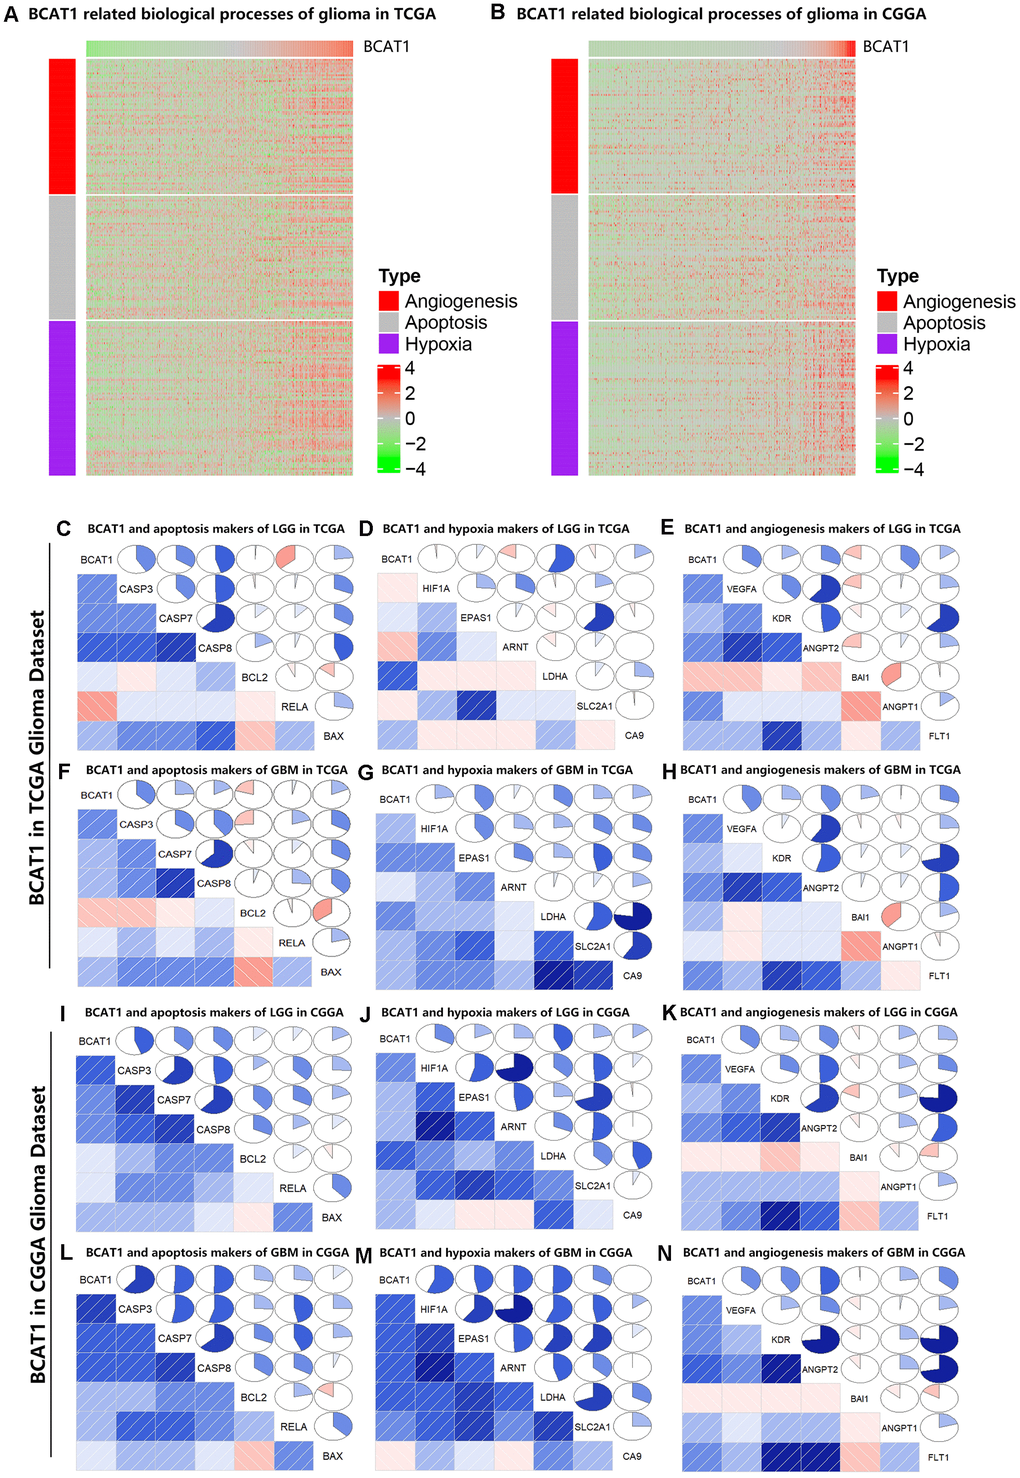
Figure 3. BCAT1 is correlated with apoptosis, hypoxia and angiogenesis processes in gliomas. (A, B) Heatmaps showing the expression patterns of angiogenesis, apoptosis and hypoxia markers in glioma patients according to BCAT1 expression based on TCGA and CGGA datasets. (C–E) The relation between BCAT1 expression and apoptosis, hypoxia and angiogenesis markers in LGG of TCGA dataset. (F–H) The relation between BCAT1 expression and apoptosis, hypoxia and angiogenesis markers in GBM of TCGA dataset. (I–K) The relation between BCAT1 and apoptosis, hypoxia and angiogenesis markers in LGG of CGGA dataset. (L–N) The relation between BCAT1 and apoptosis, hypoxia and angiogenesis markers in GBM of CGGA dataset.
High BCAT1 expression is correlated with higher glycolysis level in gliomas
The tumor metabolic phenotype is characterized by preferential dependence on glycolysis, and glycolytic enzymes are also known to be associated with the worse or better prognosis in various cancers. To evaluate the relationship between BCAT1 and glycolysis in gliomas, we firstly performed the Pearson correlation analysis using both TCGA and CGGA datasets. After screening several glycolytic enzymes including LDHA, PGAM2, TIGAR, PKM, HK2, we found that BCAT1 expression was positively correlated with glycolysis level as shown by Circos plots (Figure 4A, 4B). Moreover, IDH1 wild-type gliomas displayed a significantly increased expression of glycolytic enzyme genes (LDHA, HK2, PGAM2, PGK1, PKM, TIGAR) compared to IDH1-mutant gliomas as shown in heatmaps (Figure 4C, 4D). Finally, we evaluated the prognostic value of these glycolytic genes based on the two glioma datasets to determine their effect on glioma patients’ survival. As shown in Figure 4E–4J, higher expression of glycolytic enzyme genes predicted worse overall survival (OS) in glioma based on the TCGA dataset. Similarly, a strong correlation between higher expression of glycolytic enzyme genes and shorter patient OS was also observed in the CGGA dataset (Figure 4K–4P). These findings indicate that BCAT1 might synergize with glycolytic enzymes in the worse outcome of IDH1 wild-type gliomas.
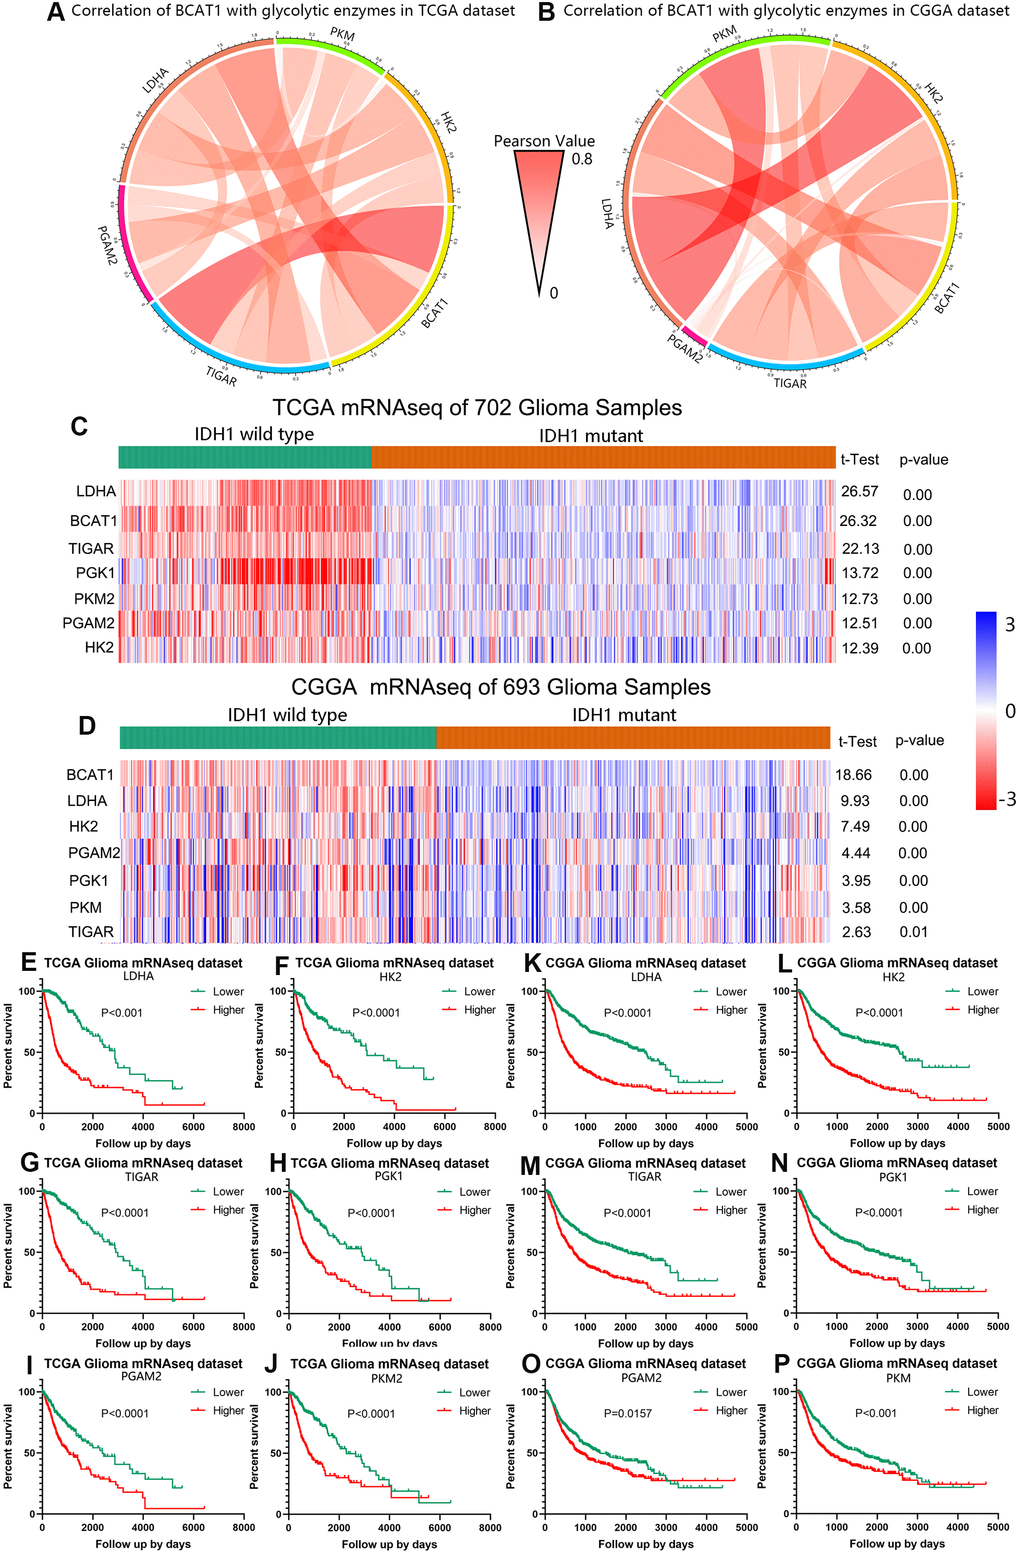
Figure 4. BCAT1 is correlated with glycolysis process in gliomas. (A, B) The correlation of BCAT1 with glycolytic enzymes in TCGA and CGGA datasets. (C, D) Heatmap showing the mRNA expression of BCAT1 and related glycolytic enzymes in IDH1 wild-type and mutant gliomas based on TCGA and CGGA datasets. (E–J) Survival plots for BCAT1 correlated glycolytic enzymes in TCGA glioma patients. (K–P) Survival plots for BCAT1 correlated glycolytic enzymes in CGGA glioma patients.
High BCAT1 expression is accompanied by increased immunosuppressive status in the tumor
The immunological tumor microenvironment of diffuse gliomas differs in regards to IDH mutation status. IDH1 wild-type gliomas display a more immunosuppressive tumor microenvironment including a more prominent immune cell infiltration and higher PD-L1 expression [22]. To further explore the role of BCAT1 in the immunosuppressive status of gliomas, Circos plots were performed based on the correlation between BCAT1 and six immune checkpoints (PD-L1, PD-L2, B7H3, B7H4, TIM-3, Gal-9). The results showed that BCAT1 synergized well with other immune checkpoint molecules in gliomas, which were observed in both TCGA and CGGA datasets (Figure 5A, 5B). The Pearson correlation analysis further showed that BCAT1 was positively associated with M2 macrophage markers (CD163, FCGR1A, MRC2, PTPRC) and Treg markers (CCR7, CD3, CD4, IL2RA) in both TCGA (Figure 5C–5J) and CGGA (Figure 5K–5R) datasets. Then, mutual relationship analysis of BCAT1 related immune cells was further conducted to identify their clusters according to IDH status and tumor grades. The results demonstrated that M2 macrophages and Tregs were preferentially involved in IDH1 wild-type and higher grades gliomas (Figure 5S, 5T). Overall, these data suggest BCAT1 is correlated with the immunosuppressive signature of IDH1 wild-type gliomas.
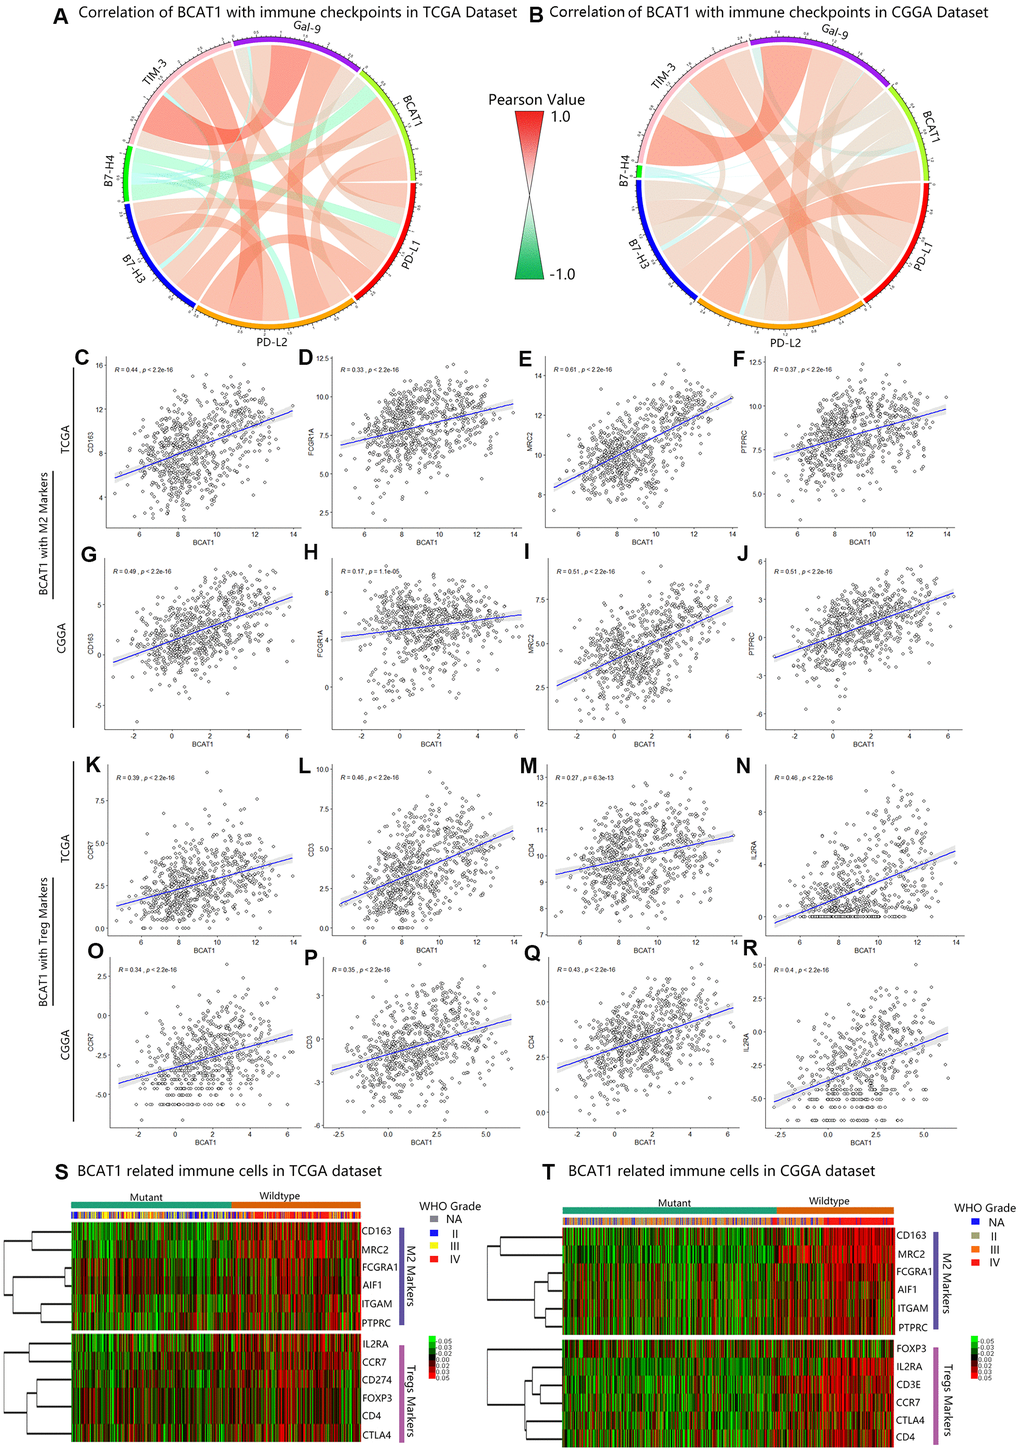
Figure 5. BCAT1 is correlated with immunosuppressive status in gliomas. (A, B) The correlation between BCAT1 and immune checkpoints in the TCGA and CGGA datasets. (C–F) The correlation between BCAT1 and M2 markers in the TCGA dataset and (G–J) CGGA dataset. (K–N) The correlation between BCAT1 and Treg markers in the TCGA dataset and (O–R) CGGA dataset. (S, T) Heatmap showing the mRNA expression pattern of BCAT1 related immune cell markers in the TCGA and CGGA datasets, shown respectively for IDH1 mutant and wild-type gliomas and for glioma grades.
Discussion
Despite IDH1 is a powerful prognostic marker to distinguish lower grade gliomas and secondary glioblastoma from primary glioblastoma [23–25], its potential role as a therapeutic target for gliomas has not yet been determined [26] and further understanding of IDH1 in tumor metabolism is essential [27, 28]. Recent studies have focused on the crosstalk between BCATs and IDH1 in the catabolism of glioblastoma [12, 29, 30]. It was indicated that IDH1 mutation is associated with changes in cellular metabolism, which includes decreased branched-chain amino acid transaminase 1 (BCAT1) activity [31, 32]. Specifically, BCAT1 expression is dependent on the concentration of α-ketoglutarate (α-KG) substrate and could be suppressed by downregulation of IDH1 in glioblastoma cell lines or overexpression of mutant IDH1 in immortalized human astrocytes [19]. In addition, BCAT1 knockdown can strongly restrict tumor growth and progression in glioblastoma [19]. However, the associated molecular mechanisms of BCAT1 in glioma remain poorly understood, and thus more extensive research in this area could provide insight towards improved diagnosis and treatment.
In this study, we evaluated the expression of BCAT1 in gliomas and its potential involvement in tumor biological processes. From our results, BCAT1 is higher expressed in glioblastoma than in lower grade gliomas and higher in astrocytoma than in oligodendroglioma as well as higher in classical and mesenchymal subtypes than in proneural subtype glioblastoma. These findings imply that BCAT1 possibly influences overall survival time and other clinical features in glioma patients, which was validated in both TCGA and CGGA datasets. Moreover, the association between BCAT1 and IDH1 status was also confirmed, as previously reported, high expression of BCAT1 is observed in IDH1 wild-type gliomas but is also preferentially expressed in non 1p19q co-deleted gliomas. Besides, high BCAT1 expression represents poor survival of IDH1 wild-type gliomas. These results indicated a malignant biological property for BCAT1 in IDH wild-type gliomas. Emerging data has demonstrated a critical role for BCAT1 in glioblastoma growth. To further demonstrate the mechanisms underlying BCAT1 regulated IDH1 wild-type gliomas. we explored the association between BCAT1 and apoptosis, hypoxia and angiogenesis metagenes, BCAT1 expression was positively related with apoptosis, hypoxia and angiogenesis processes in gliomas especially in GBM. Furthermore, as a key enzyme in BCAAs and energy metabolism, its association with glycolysis was also identified. BCAT1 expression was positively correlated with glycolytic enzymes, which are enriched in IDH1 wild-type gliomas and related to poor overall survival of glioma patients.
Tumor-infiltrating Treg cells and M2 cells are a major cause of poor clinical outcome in many cancers. Increasing evidence suggests that accumulation of Treg and M2 macrophage cells can suppress antitumor immunity through various cellular and humoral mechanisms including expressing immune-checkpoint molecules [33–37]. In glioma, human IDH1-mutant gliomas have less infiltrating immune cells than IDH1 wild-type gliomas [22]. From our results, BCAT1 is positively related to immune checkpoints and expressed synergistically with other checkpoint members. Meanwhile, high expression of BCAT1 is also linked with a high percentage of M2 and Treg cell infiltration, which are more frequently occurring in IDH wild-type gliomas. These findings indicate that BCAT1 may also involve in modulating the tumor-induced immune response to IDH1 wild-type gliomas.
Conclusions
To conclude, our work highlights that high expression of BCAT1 is a sensitive marker for predicting poor prognosis of IDH1 wild-type glioma patients. BCAT1 is enriched in IDH1 wild-type gliomas and may relate to apoptosis, hypoxia and angiogenesis processes in tumor progression. Moreover, BCAT1 is also involved in the glycolytic metabolism and immune suppression of IDH1 wild-type gliomas, suggesting multiple roles that BCAT1 exerts in the malignant transformation of glioblastoma. Therefore, BCAT1 represents a potential therapeutic target and useful prognostic factor for glioblastoma patients.
Materials and Methods
Databases
There were six glioma mRNA datasets used in this study. The RNA sequencing expression and clinical information of 702 samples were downloaded from The Cancer Genome Atlas (TCGA) database (https://www.cancer.gov/). The Chinese Genome Atlas (CGGA) RNA sequencing dataset and clinical characteristics of 693 samples were obtained from the publicly available website (http://www.cgga.org.cn/). The GSE16011, GSE4290 and REMBRANDT (GSE108474) datasets were downloaded from Gene Expression Omnibus (GEO, https://www.ncbi.nlm.nih.gov/geo/). Data on immunohistochemical detection of BCAT1 in gliomas and other tumor samples were obtained from The Human Protein Atlas (https://www.proteinatlas.org/).
Tissue microarray immunohistochemistry
The clinical information and the procedure for immunohistochemical staining of human glioma samples have been described previously [38, 39].
Bioinformatic analysis
The gene expression of BCAT1 in tumor and non-tumor tissues was obtained and analysis was performed by Gene Expression Profiling Interactive Analysis (GEPIA, http://gepia.cancer-pku.cn/). The mRNA expression of BCAT1 in different glioma grades, subtypes and other conditions was calculated by GraphPad Prism 8. The markers for apoptosis, hypoxia and angiogenesis were selected based on signature profiles from CancerSEA. The heatmaps revealed the mRNA expression of BCAT1 and other genes of apoptosis, hypoxia and angiogenesis in the TCGA and CGGA datasets R programing language using “complexheatmap” package. The correction analysis between BCAT1 and other genes of apoptosis, hypoxia and angiogenesis in the TCGA and CGGA datasets was performed through “corrplot” package. Circos plots revealing the correlation of BCAT1 with glycolytic enzymes and immune checkpoints were conducted by R language using “circlize” package. The Pearson correction analysis between BCAT1 and immune cell (M2, Treg) markers was conducted by R language using “ggpubr” package.
Statistical analysis
Kaplan-Meier survival analysis manifesting the influence of the expression of BCAT1 and other related genes on overall survival time and median value was used as the cutoff to define high and low expression group. Univariate and multivariate COX regression analyzed by SPSS 21.0 including age, gender, IDH status, 1p19q, BCAT1, radiotherapy and chemotherapy were used to evaluate the impact of above factors on the prognostic value in glioma patients. Chi-square test and rank sum test were used to verify if the expression of BCAT1 is distinct in different groups of age, gender, grade, IDH status, 1p19q, MGMT, ATRX, radiotherapy and chemotherapy. One-way ANOVA was used to test for differences among at least 3 groups. The t test was used to determine differences in each double group comparison. In all statistical analyses, p value less than 0.05 was considered to be statistically significant.
Author Contributions
Concept and design: LY, XGF and FY; Development of methodology: LY, XGF and JBL; Acquisition and analysis of data: LY, XGF; Writing, review and editing: LY and XGF; Review and critical comments: MN, JZ and XJY; Supervision: XJY and MN; Project administration: XJY; Funding acquisition: XJY and MN.
Conflicts of Interest
The authors declare that they have no conflicts of interest.
Funding
The work was funded by Beijing-Tianjin-Hebei Basic Research Cooperation Project (No. 19JCZDJC64200), National Natural Science Foundation of China (No. 81872063) to XJY; The Swedish Cancer Society (2019, contract 19 0316 Pj01H), The Cancer Society in Stockholm (2018-181223), The Swedish Research Council (VR-MH 2018-02452) to MN; Tianjin Research Innovation Project for Postgraduate Students (2019YJSB105) and Chinese Government Scholarship from China Scholarship Council (201906940041) to LY.
References
- 1. Ostrom QT, Gittleman H, Truitt G, Boscia A, Kruchko C, Barnholtz-Sloan JS. CBTRUS statistical report: primary brain and other central nervous system tumors diagnosed in the United States in 2011-2015. Neuro Oncol. 2018; 20:iv1–v86. https://doi.org/10.1093/neuonc/noy131 [PubMed]
- 2. Stupp R, Mason WP, van den Bent MJ, Weller M, Fisher B, Taphoorn MJ, Belanger K, Brandes AA, Marosi C, Bogdahn U, Curschmann J, Janzer RC, Ludwin SK, et al, and European Organisation for Research and Treatment of Cancer Brain Tumor and Radiotherapy Groups, and National Cancer Institute of Canada Clinical Trials Group. Radiotherapy plus concomitant and adjuvant temozolomide for glioblastoma. N Engl J Med. 2005; 352:987–96. https://doi.org/10.1056/NEJMoa043330 [PubMed]
- 3. Buckner J, Giannini C, Eckel-Passow J, Lachance D, Parney I, Laack N, Jenkins R. Management of diffuse low-grade gliomas in adults - use of molecular diagnostics. Nat Rev Neurol. 2017; 13:340–51. https://doi.org/10.1038/nrneurol.2017.54 [PubMed]
- 4. Sulkowski PL, Corso CD, Robinson ND, Scanlon SE, Purshouse KR, Bai H, Liu Y, Sundaram RK, Hegan DC, Fons NR, Breuer GA, Song Y, Mishra-Gorur K, et al. 2-hydroxyglutarate produced by neomorphic IDH mutations suppresses homologous recombination and induces PARP inhibitor sensitivity. Sci Transl Med. 2017; 9:eaal2463. https://doi.org/10.1126/scitranslmed.aal2463 [PubMed]
- 5. Louis DN, Perry A, Reifenberger G, von Deimling A, Figarella-Branger D, Cavenee WK, Ohgaki H, Wiestler OD, Kleihues P, Ellison DW. The 2016 world health organization classification of tumors of the central nervous system: a summary. Acta Neuropathol. 2016; 131:803–20. https://doi.org/10.1007/s00401-016-1545-1 [PubMed]
- 6. Foote MB, Papadopoulos N, Diaz LA
Jr . Genetic classification of gliomas: refining histopathology. Cancer Cell. 2015; 28:9–11. https://doi.org/10.1016/j.ccell.2015.06.014 [PubMed] - 7. Eckel-Passow JE, Lachance DH, Molinaro AM, Walsh KM, Decker PA, Sicotte H, Pekmezci M, Rice T, Kosel ML, Smirnov IV, Sarkar G, Caron AA, Kollmeyer TM, et al. Glioma groups based on 1p/19q, IDH, and TERT promoter mutations in tumors. N Engl J Med. 2015; 372:2499–508. https://doi.org/10.1056/NEJMoa1407279 [PubMed]
- 8. Waitkus MS, Diplas BH, Yan H. Isocitrate dehydrogenase mutations in gliomas. Neuro Oncol. 2016; 18:16–26. https://doi.org/10.1093/neuonc/nov136 [PubMed]
- 9. Calvert AE, Chalastanis A, Wu Y, Hurley LA, Kouri FM, Bi Y, Kachman M, May JL, Bartom E, Hua Y, Mishra RK, Schiltz GE, Dubrovskyi O, et al. Cancer-associated IDH1 promotes growth and resistance to targeted therapies in the absence of mutation. Cell Rep. 2017; 19:1858–73. https://doi.org/10.1016/j.celrep.2017.05.014 [PubMed]
- 10. Zhang Z, Chan AK, Ding X, Li Y, Zhang R, Chen L, Liu Y, Wang Y, Xiong J, Ng HK, Yao Y, Zhou L. Glioma groups classified by IDH and TERT promoter mutations remain stable among primary and recurrent gliomas. Neuro Oncol. 2017; 19:1008–10. https://doi.org/10.1093/neuonc/nox042 [PubMed]
- 11. Aibaidula A, Chan AK, Shi Z, Li Y, Zhang R, Yang R, Li KK, Chung NY, Yao Y, Zhou L, Wu J, Chen H, Ng HK. Adult IDH wild-type lower-grade gliomas should be further stratified. Neuro Oncol. 2017; 19:1327–37. https://doi.org/10.1093/neuonc/nox078 [PubMed]
- 12. Cho HR, Jeon H, Park CK, Park SH, Kang KM, Choi SH. BCAT1 is a new MR imaging-related biomarker for prognosis prediction in IDH1-wildtype glioblastoma patients. Sci Rep. 2017; 7:17740. https://doi.org/10.1038/s41598-017-17062-1 [PubMed]
- 13. Lee JH, Cho YR, Kim JH, Kim J, Nam HY, Kim SW, Son J. Branched-chain amino acids sustain pancreatic cancer growth by regulating lipid metabolism. Exp Mol Med. 2019; 51:1–11. https://doi.org/10.1038/s12276-019-0350-z [PubMed]
- 14. Gu Z, Liu Y, Cai F, Patrick M, Zmajkovic J, Cao H, Zhang Y, Tasdogan A, Chen M, Qi L, Liu X, Li K, Lyu J, et al. Loss of EZH2 reprograms BCAA metabolism to drive leukemic transformation. Cancer Discov. 2019; 9:1228–47. https://doi.org/10.1158/2159-8290.CD-19-0152 [PubMed]
- 15. Thewes V, Simon R, Hlevnjak M, Schlotter M, Schroeter P, Schmidt K, Wu Y, Anzeneder T, Wang W, Windisch P, Kirchgäßner M, Melling N, Kneisel N, et al. The branched-chain amino acid transaminase 1 sustains growth of antiestrogen-resistant and ERα-negative breast cancer. Oncogene. 2017; 36:4124–34. https://doi.org/10.1038/onc.2017.32 [PubMed]
- 16. Wang Y, Zhang J, Ren S, Sun D, Huang HY, Wang H, Jin Y, Li F, Zheng C, Yang L, Deng L, Jiang Z, Jiang T, et al. Branched-chain amino acid metabolic reprogramming orchestrates drug resistance to EGFR tyrosine kinase inhibitors. Cell Rep. 2019; 28:512–25.e6. https://doi.org/10.1016/j.celrep.2019.06.026 [PubMed]
- 17. Chang IW, Wu WJ, Wang YH, Wu TF, Liang PI, He HL, Yeh BW, Li CF. BCAT1 overexpression is an indicator of poor prognosis in patients with urothelial carcinomas of the upper urinary tract and urinary bladder. Histopathology. 2016; 68:520–32. https://doi.org/10.1111/his.12778 [PubMed]
- 18. Raffel S, Falcone M, Kneisel N, Hansson J, Wang W, Lutz C, Bullinger L, Poschet G, Nonnenmacher Y, Barnert A, Bahr C, Zeisberger P, Przybylla A, et al. BCAT1 restricts αKG levels in AML stem cells leading to IDHmut-like DNA hypermethylation. Nature. 2017; 551:384–88. https://doi.org/10.1038/nature24294 [PubMed]
- 19. Tönjes M, Barbus S, Park YJ, Wang W, Schlotter M, Lindroth AM, Pleier SV, Bai AH, Karra D, Piro RM, Felsberg J, Addington A, Lemke D, et al. BCAT1 promotes cell proliferation through amino acid catabolism in gliomas carrying wild-type IDH1. Nat Med. 2013; 19:901–08. https://doi.org/10.1038/nm.3217 [PubMed]
- 20. McBrayer SK, Mayers JR, DiNatale GJ, Shi DD, Khanal J, Chakraborty AA, Sarosiek KA, Briggs KJ, Robbins AK, Sewastianik T, Shareef SJ, Olenchock BA, Parker SJ, et al. Transaminase inhibition by 2-hydroxyglutarate impairs glutamate biosynthesis and redox homeostasis in glioma. Cell. 2018; 175:101–16.e25. https://doi.org/10.1016/j.cell.2018.08.038 [PubMed]
- 21. Suh EH, Hackett EP, Wynn RM, Chuang DT, Zhang B, Luo W, Sherry AD, Park JM. In vivo assessment of increased oxidation of branched-chain amino acids in glioblastoma. Sci Rep. 2019; 9:340. https://doi.org/10.1038/s41598-018-37390-0 [PubMed]
- 22. Berghoff AS, Kiesel B, Widhalm G, Wilhelm D, Rajky O, Kurscheid S, Kresl P, Wöhrer A, Marosi C, Hegi ME, Preusser M. Correlation of immune phenotype with IDH mutation in diffuse glioma. Neuro Oncol. 2017; 19:1460–68. https://doi.org/10.1093/neuonc/nox054 [PubMed]
- 23. Genetic and Epigenetic Mechanisms Promote IDH1-Mutant Glioma Progression. Cancer Discov. 2016; 6:OF14–OF14. https://doi.org/10.1158/2159-8290.CD-RW2015-232
- 24. Ohgaki H, Burger P, Kleihues P. Definition of primary and secondary glioblastoma—response. Clin Cancer Res. 2014; 20:2013. https://doi.org/10.1158/1078-0432.CCR-14-0238 [PubMed]
- 25. Bai H, Harmancı AS, Erson-Omay EZ, Li J, Coşkun S, Simon M, Krischek B, Özduman K, Omay SB, Sorensen EA, Turcan Ş, Bakırcığlu M, Carrión-Grant G, et al. Integrated genomic characterization of IDH1-mutant glioma malignant progression. Nat Genet. 2016; 48:59–66. https://doi.org/10.1038/ng.3457 [PubMed]
- 26. IDH inhibitors target common glioma mutation. Cancer Discov. 2019; 9:992. https://doi.org/10.1158/2159-8290.CD-ND2019-007 [PubMed]
- 27. Rohle D, Popovici-Muller J, Palaskas N, Turcan S, Grommes C, Campos C, Tsoi J, Clark O, Oldrini B, Komisopoulou E, Kunii K, Pedraza A, Schalm S, et al. An inhibitor of mutant IDH1 delays growth and promotes differentiation of glioma cells. Science. 2013; 340:626–30. https://doi.org/10.1126/science.1236062 [PubMed]
- 28. Waitkus MS, Diplas BH, Yan H. Biological role and therapeutic potential of IDH mutations in cancer. Cancer Cell. 2018; 34:186–95. https://doi.org/10.1016/j.ccell.2018.04.011 [PubMed]
- 29. Chen YY, Ho HL, Lin SC, Hsu CY, Ho DM. Loss of BCAT1 expression is a sensitive marker for IDH-mutant diffuse glioma. Neurosurgery. 2019; 85:335–42. https://doi.org/10.1093/neuros/nyy338 [PubMed]
- 30. Silva LS, Poschet G, Nonnenmacher Y, Becker HM, Sapcariu S, Gaupel AC, Schlotter M, Wu Y, Kneisel N, Seiffert M, Hell R, Hiller K, Lichter P, Radlwimmer B. Branched-chain ketoacids secreted by glioblastoma cells via MCT1 modulate macrophage phenotype. EMBO Rep. 2017; 18:2172–85. https://doi.org/10.15252/embr.201744154 [PubMed]
- 31. Conway ME, Hull J, El Hindy M, Taylor SC, El Amraoui F, Paton-Thomas C, White P, Williams M, Ellis HP, Bertoni A, Radlwimmer B, Hutson SM, Kurian KM. Decreased expression of the mitochondrial BCAT protein correlates with improved patient survival in IDH-WT gliomas. Brain Pathol. 2016; 26:789–91. https://doi.org/10.1111/bpa.12385 [PubMed]
- 32. Panosyan EH, Lasky JL, Lin HJ, Lai A, Hai Y, Guo X, Quinn M, Nelson SF, Cloughesy TF, Nghiemphu PL. Clinical aggressiveness of malignant gliomas is linked to augmented metabolism of amino acids. J Neurooncol. 2016; 128:57–66. https://doi.org/10.1007/s11060-016-2073-5 [PubMed]
- 33. Togashi Y, Shitara K, Nishikawa H. Regulatory T cells in cancer immunosuppression - implications for anticancer therapy. Nat Rev Clin Oncol. 2019; 16:356–71. https://doi.org/10.1038/s41571-019-0175-7 [PubMed]
- 34. Lin C, He H, Liu H, Li R, Chen Y, Qi Y, Jiang Q, Chen L, Zhang P, Zhang H, Li H, Zhang W, Sun Y, Xu J. Tumour-associated macrophages-derived CXCL8 determines immune evasion through autonomous PD-L1 expression in gastric cancer. Gut. 2019; 68:1764–73. https://doi.org/10.1136/gutjnl-2018-316324 [PubMed]
- 35. Wen ZF, Liu H, Gao R, Zhou M, Ma J, Zhang Y, Zhao J, Chen Y, Zhang T, Huang F, Pan N, Zhang J, Fox BA, et al. Tumor cell-released autophagosomes (TRAPs) promote immunosuppression through induction of M2-like macrophages with increased expression of PD-L1. J Immunother Cancer. 2018; 6:151. https://doi.org/10.1186/s40425-018-0452-5 [PubMed]
- 36. Hartley GP, Chow L, Ammons DT, Wheat WH, Dow SW. Programmed cell death ligand 1 (PD-L1) signaling regulates macrophage proliferation and activation. Cancer Immunol Res. 2018; 6:1260–73. https://doi.org/10.1158/2326-6066.CIR-17-0537 [PubMed]
- 37. Hatzioannou A, Banos A, Sakelaropoulos T, Fedonidis C, Vidali MS, Köhne M, Händler K, Boon L, Henriques A, Koliaraki V, Georgiadis P, Zoidakis J, Termentzi A, et al. An intrinsic role of IL-33 in Treg cell-mediated tumor immunoevasion. Nat Immunol. 2020; 21:75–85. https://doi.org/10.1038/s41590-019-0555-2 [PubMed]
- 38. Yi L, Zhou X, Li T, Liu P, Hai L, Tong L, Ma H, Tao Z, Xie Y, Zhang C, Yu S, Yang X. Notch1 signaling pathway promotes invasion, self-renewal and growth of glioma initiating cells via modulating chemokine system CXCL12/CXCR4. J Exp Clin Cancer Res. 2019; 38:339. https://doi.org/10.1186/s13046-019-1319-4 [PubMed]
- 39. Yi L, Guo G, Li J, Fan X, Li T, Tong L, Liu P, Wang X, Yuan F, Yu S, Huang Q, Yang X. IKBKE, a prognostic factor preferentially expressed in mesenchymal glioblastoma, modulates tumoral immunosuppression through the STAT3/PD-L1 pathway. Clin Transl Med. 2020; 10:e130. https://doi.org/10.1002/ctm2.130