


Introduction
As one of the most deadly malignancies, pancreatic cancer (PC) caused 4.5% of all deaths related to cancers worldwide, with poor 5-year survival rate of 2-9% [1, 2]. Recent years have affirmed a significant advancement of immune-based therapies in various types of solid tumors, such as hepatocellular carcinoma, melanoma, head and neck cancer, and non-small-cell lung cancer [3–8]. However, so far, these drugs exhibit limited efficacy for advanced PC, because of the low CD8+ T cells infiltration within the tumor microenvironment (TME) [9–11]. Therefore, understanding the molecular mechanisms involved in PC immune suppression is fundamental to the development of more effective immune-based therapeutics to improve the clinical outcome of PC.
Beta-1,3-N-acetylglucosaminyltransferase 3 (B3GNT3) is a protein coding gene that encodes a member of the beta-1,3-N-acetylglucosaminyltransferase family [12]. Previous studies demonstrated that B3GNT3 participates in the development and progression of human malignancies, such as pancreatic cancer, breast cancer, cervical cancer, lung cancer, and non-Hodgkin lymphoma [12–16]. For example, elevated B3GNT3 expression levels in pancreatic cancer stem cells (PCSCs) regulate stemness by modulating PCSC markers and promoting tumor progression [13]. B3GNT3 overexpression is also correlated with unfavorable prognosis of patients with non-small cell lung cancer [15]. Moreover, it was reported that B3GNT3 downregulation enhances the anti-tumor immunity of cytotoxic T cells in triple-negative breast cancer [16]. However, the potential role of B3GTN3 in the immune suppression of PC has not been explored.
In the current study, we comprehensively investigated the expression of B3GNT3, its clinical significance, and its potential biological function in PC using the Gene Expression Omnibus (GEO) and The Cancer Genome Atlas (TCGA). The oncologic role of B3GNT3 in PC was determined using in vitro studies. For the first time, the potential association between B3GNT3 expression and CD8+ T cell infiltration in PC was evaluated using the ESTIMATE algorithm, CIBERSORT algorithm, single sample Gene Set Enrichment Analysis (ssGSEA), and multi-color immunofluorescence in TMA [17–19].
Results
B3GNT3 overexpression predicts poor prognosis in PC
B3GNT3 was overexpressed in tumor tissues (P < 0.0001) according to GSE62452 dataset and GSE60979 dataset (Figure 1A, 1B). The Oncomine database (https://www.oncomine.org/resource/main.html) contained seven studies about PC, among which two studies revealed B3GNT3 expression in tumor tissues was significantly higher compared with that in normal pancreatic tissues (P < 0.05) (Figure 1C, 1D). The results of the other five studies in the Oncomine database are also shown in Supplementary Figure 1 (P > 0.05). Moreover, the overexpression of B3GNT3 in PC was also observed in the Gene Expression Profiling Interactive Analysis (GEPIA) database (https://gepia.cancer-pku.cn/) (Figure 1E). Moreover, in GSE28735 dataset, B3GNT3 expression in tumor tissues was significantly upregulated compared with that in the adjacent non-tumor tissues (P < 0.0001) (Figure 1F). The human protein atlas (HPA) database (http://proteinatlas.org/) demonstrated that the protein expression of B3GNT3 was notably upregulated in tumor tissues (Figure 2A, 2B), while the expression of B3GNT3 in CAPAN-2 cells was obviously higher than that in various other cancer cells (Figure 2C). In addition, B3GNT3 expression was mainly located in the cytoplasm of PC cells (Figure 2B). Of note, KM survival analysis according to the TCGA PC dataset (cutoff point = 41.5), GSE62452 dataset (cutoff point = 4.70), and GSE79668 dataset (cutoff point = 2860) demonstrated that patients with lower levels of B3GNT3 expression had a superior OS than those with higher levels of B3GNT3 expression (P < 0.05) (Figure 3A–3C). Taken together, our study suggests B3GNT3 as a critical but unfavorable prognostic factor for PC.
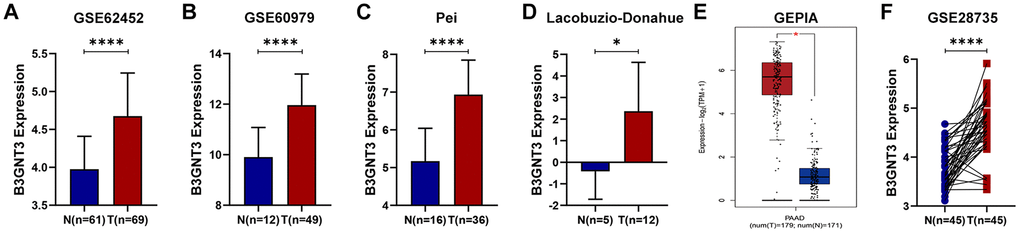
Figure 1. Multiple databases demonstrated that B3GNT3 was overexpressed in PC. (A–B) B3GNT3 expression in GSE62452 and GSE60979 datasets. (C–D) B3GNT3 expression in the Oncomine database. (E) B3GNT3 expression in GEPIA database. (F) B3GNT3 expression in GSE28735 dataset. PC, pancreatic cancer; N: normal; T: tumor; GEPIA: Gene Expression Profiling Interactive Analysis. (*P value < 0.05; **P value < 0.01;***P value < 0.001; ****P value < 0.0001).
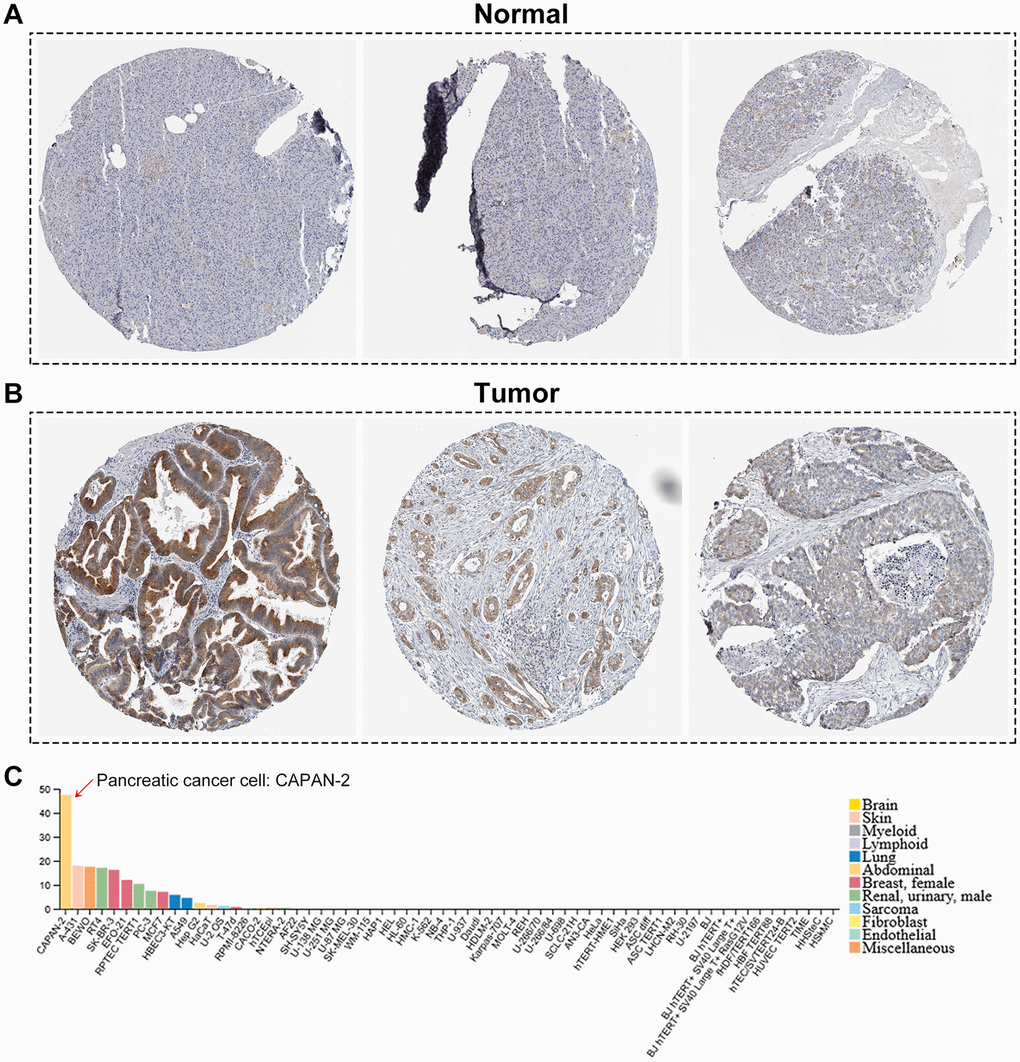
Figure 2. The human protein atlas database analysis. (A, B) The translational differences of B3GNT3 between pancreatic cancer tissues and normal pancreatic tissues. (C) The expression of B3GNT3 in CAPAN-2 cells was much higher than that in various other cancer cells.
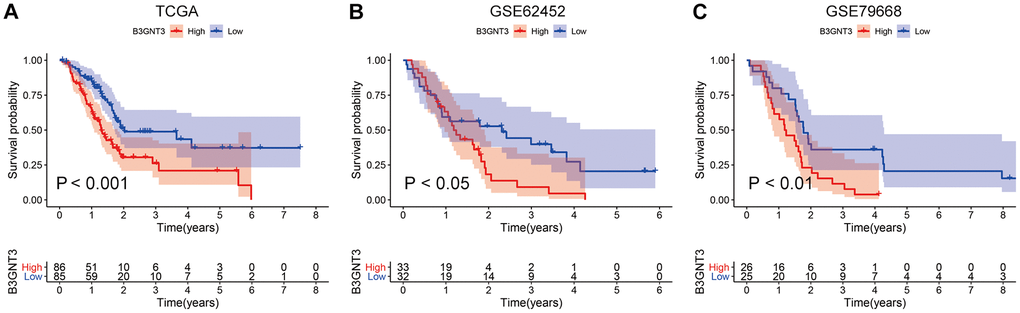
Figure 3. KM survival analysis for B3GNT3 through the TCGA, GSE62425, and GSE79668 datasets. (A–C) High expression of B3GNT3 was significantly associated with poor survival in PC (P value < 0.05). PC, pancreatic cancer; KM, Kaplan-Meier.
B3GNT3 expression and the correlation with clinicopathological characteristics
The correlation between the expression of B3GNT3 and clinicopathological characteristics in the TCGA PC dataset and GSE62452 dataset are shown in Tables 1, 2. B3GNT3 expression was significantly correlated with tumor size (P = 0.017) (Table 1) and histologic grade (P = 0.001) (Table 2). Patients with larger tumors (≥ 4 cm) and higher histologic grades had higher levels of B3GNT3 expression (P < 0.05) (Figure 4). These results further suggest that B3GNT3 overexpression may promote tumor progression in PC.
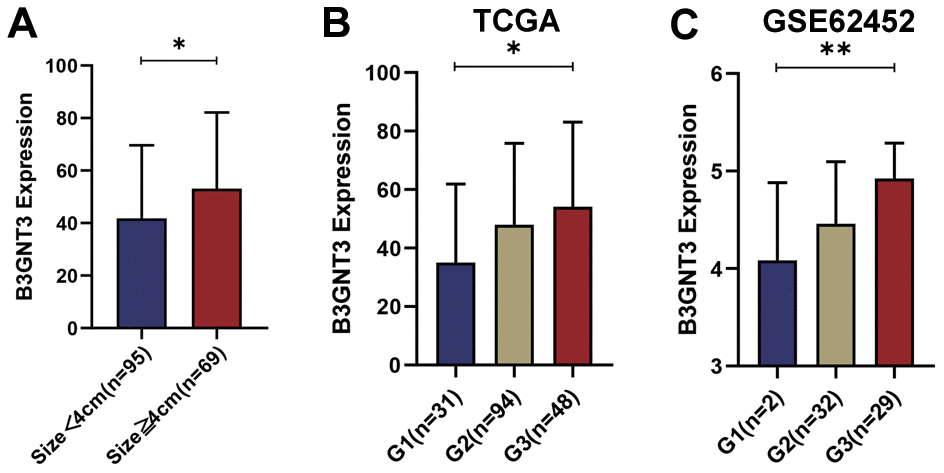
Figure 4. The different B3GNT3 expressions based on clinicopathological characteristics in the boxplot. Boxplots showing the expression differences of B3GNT3 according to tumor size (A) and tumor histologic grade (B, C). PC, pancreatic cancer; G1: grade 1; G2: grade 2; G3: grade 3. (*P value < 0.05; **P value < 0.01;***P value < 0.001; ****P value < 0.0001).
Table 1. Correlation between B3GNT3 and clinicopathological characteristics in PC.
| Parameters | B3GNT3 expression | P value | |||||||||||||||||||||||||||||||||||||||||||||||||||||||||||||||||||||||||||||||||||||||||||||||||
| Low (n=88) | High (n=89) | ||||||||||||||||||||||||||||||||||||||||||||||||||||||||||||||||||||||||||||||||||||||||||||||||||
| Age | ≤60 | 28 (31.8%) | 30 (33.7%) | 0.789 | |||||||||||||||||||||||||||||||||||||||||||||||||||||||||||||||||||||||||||||||||||||||||||||||
| >60 | 60 (68.2%) | 59 (66.3%) | |||||||||||||||||||||||||||||||||||||||||||||||||||||||||||||||||||||||||||||||||||||||||||||||||
| Gender | Female | 45 (51.1%) | 35 (49.3%) | 0.114 | |||||||||||||||||||||||||||||||||||||||||||||||||||||||||||||||||||||||||||||||||||||||||||||||
| Male | 43 (48.9%) | 54 (60.7%) | |||||||||||||||||||||||||||||||||||||||||||||||||||||||||||||||||||||||||||||||||||||||||||||||||
| AJCC stage | I | 14 (15.9%) | 7 (7.9%) | 0.376 | |||||||||||||||||||||||||||||||||||||||||||||||||||||||||||||||||||||||||||||||||||||||||||||||
| II | 69 (78.4%) | 77 (86.5%) | |||||||||||||||||||||||||||||||||||||||||||||||||||||||||||||||||||||||||||||||||||||||||||||||||
| III | 2 (2.3%) | 1 (1.1%) | |||||||||||||||||||||||||||||||||||||||||||||||||||||||||||||||||||||||||||||||||||||||||||||||||
| IV | 2 (2.3%) | 2 (2.2%) | |||||||||||||||||||||||||||||||||||||||||||||||||||||||||||||||||||||||||||||||||||||||||||||||||
| Unknown | 1 (1.1%) | 2 (2.2%) | |||||||||||||||||||||||||||||||||||||||||||||||||||||||||||||||||||||||||||||||||||||||||||||||||
| Histologic grade | G1 | 20 (22.7%) | 11 (12.4%) | 0.134 | |||||||||||||||||||||||||||||||||||||||||||||||||||||||||||||||||||||||||||||||||||||||||||||||
| G2 | 45 (51.1%) | 49 (55.1%) | |||||||||||||||||||||||||||||||||||||||||||||||||||||||||||||||||||||||||||||||||||||||||||||||||
| G3 | 21 (23.9%) | 27 (30.3%) | |||||||||||||||||||||||||||||||||||||||||||||||||||||||||||||||||||||||||||||||||||||||||||||||||
| G4 | 2 (2.3%) | 0 | |||||||||||||||||||||||||||||||||||||||||||||||||||||||||||||||||||||||||||||||||||||||||||||||||
| Unknown | 0 | 2 (2.2%) | |||||||||||||||||||||||||||||||||||||||||||||||||||||||||||||||||||||||||||||||||||||||||||||||||
| Recurrence | No | 38 (43.2%) | 33 (37.1%) | 0.407 | |||||||||||||||||||||||||||||||||||||||||||||||||||||||||||||||||||||||||||||||||||||||||||||||
| Yes | 50 (56.8%) | 56 (62.9%) | |||||||||||||||||||||||||||||||||||||||||||||||||||||||||||||||||||||||||||||||||||||||||||||||||
| Alcohol history | No | 32 (36.3%) | 32 (36.0%) | 0.852 | |||||||||||||||||||||||||||||||||||||||||||||||||||||||||||||||||||||||||||||||||||||||||||||||
| Yes | 49 (55.7%) | 52 (58.4%) | |||||||||||||||||||||||||||||||||||||||||||||||||||||||||||||||||||||||||||||||||||||||||||||||||
| Unknown | 7 (8.0%) | 5 (5.6%) | |||||||||||||||||||||||||||||||||||||||||||||||||||||||||||||||||||||||||||||||||||||||||||||||||
| Diabetes history | No | 51 (58.0%) | 57 (64.0%) | 0.566 | |||||||||||||||||||||||||||||||||||||||||||||||||||||||||||||||||||||||||||||||||||||||||||||||
| Yes | 20 (22.7%) | 18 (20.2%) | |||||||||||||||||||||||||||||||||||||||||||||||||||||||||||||||||||||||||||||||||||||||||||||||||
| Unknown | 17 (19.3%) | 14 (15.7%) | |||||||||||||||||||||||||||||||||||||||||||||||||||||||||||||||||||||||||||||||||||||||||||||||||
| Tumor size | <4 | 56 (63.6%) | 39 (43.8%) | 0.017 | |||||||||||||||||||||||||||||||||||||||||||||||||||||||||||||||||||||||||||||||||||||||||||||||
| ≥4 | 27 (30.7%) | 42 (47.2%) | |||||||||||||||||||||||||||||||||||||||||||||||||||||||||||||||||||||||||||||||||||||||||||||||||
| Unknown | 5 (5.7%) | 8 (9.0%) | |||||||||||||||||||||||||||||||||||||||||||||||||||||||||||||||||||||||||||||||||||||||||||||||||
| Tumor site | Head | 72 (81.8%) | 66 (74.2%) | 0.112 | |||||||||||||||||||||||||||||||||||||||||||||||||||||||||||||||||||||||||||||||||||||||||||||||
| Body and Tail | 10 (11.4%) | 18 (20.2%) | |||||||||||||||||||||||||||||||||||||||||||||||||||||||||||||||||||||||||||||||||||||||||||||||||
| Unknown | 6 (6.8%) | 5 (5.6%) | |||||||||||||||||||||||||||||||||||||||||||||||||||||||||||||||||||||||||||||||||||||||||||||||||
| Statistical significance was calculated by the χ2 test or the Fisher’s extract test. Bold values indicate P < 0.05 was considered statistically significant. G1: grade1; G2: grade2; G3: grade3. | |||||||||||||||||||||||||||||||||||||||||||||||||||||||||||||||||||||||||||||||||||||||||||||||||||
Table 2. Correlation between B3GNT3 and clinicopathological characteristics in PC in GSE62452 dataset.
| Parameters | B3GNT3 expression | P value | |||||||||||||||||||||||||||||||||||||||||||||||||||||||||||||||||||||||||||||||||||||||||||||||||
| Low (n=32) | High (n=33) | ||||||||||||||||||||||||||||||||||||||||||||||||||||||||||||||||||||||||||||||||||||||||||||||||||
| AJCC stage | I | 1 (3.1%) | 3 (9.1%) | 0.146 | |||||||||||||||||||||||||||||||||||||||||||||||||||||||||||||||||||||||||||||||||||||||||||||||
| II | 26 (81.3%) | 18 (54.5%) | |||||||||||||||||||||||||||||||||||||||||||||||||||||||||||||||||||||||||||||||||||||||||||||||||
| III | 3 (9.4%) | 8 (24.2%) | |||||||||||||||||||||||||||||||||||||||||||||||||||||||||||||||||||||||||||||||||||||||||||||||||
| IV | 2 (6.3%) | 4 (12.1%) | |||||||||||||||||||||||||||||||||||||||||||||||||||||||||||||||||||||||||||||||||||||||||||||||||
| Histologic grade | G1 | 2 (6.3%) | 0 | 0.001 | |||||||||||||||||||||||||||||||||||||||||||||||||||||||||||||||||||||||||||||||||||||||||||||||
| G2 | 21 (65.6%) | 11 (33.3%) | |||||||||||||||||||||||||||||||||||||||||||||||||||||||||||||||||||||||||||||||||||||||||||||||||
| G3 | 7 (21.9%) | 22 (66.7%) | |||||||||||||||||||||||||||||||||||||||||||||||||||||||||||||||||||||||||||||||||||||||||||||||||
| G4 | 1 (3.1%) | 0 | |||||||||||||||||||||||||||||||||||||||||||||||||||||||||||||||||||||||||||||||||||||||||||||||||
| Unknown | 1 (3.1%) | 0 | |||||||||||||||||||||||||||||||||||||||||||||||||||||||||||||||||||||||||||||||||||||||||||||||||
| Statistical significance was calculated by the χ2 test or the Fisher’s extract test. Bold values indicate P < 0.05 was considered statistically significant. G1: grade1; G2: grade2; G3: grade3. | |||||||||||||||||||||||||||||||||||||||||||||||||||||||||||||||||||||||||||||||||||||||||||||||||||
B3GNT3 expression and correlation with somatic mutation
Previous studies have demonstrated that KRAS, TP53, SMAD4, and CDKN2A mutations are four of the most common genetic hallmarks of PC [20–22]. Our study demonstrated that KRAS, TP53, CDKN2A, and SMAD4 mutation were significantly associated with higher levels of B3GNT3 expression (Figure 5A). Pearson correlation analyses (|Cor| > 0.3 and P < 0.05) were conducted in the TCGA PC, GSE62452, GSE60979, and GSE79668 datasets. We excluded the GSE28735 dataset from the correlation analysis because GSE28735 was actually part of the GSE62452 dataset. We found that B3GNT3 expression in the TCGA PC dataset was positively correlated with KRAS expression (Cor = 0.44, P < 0.0001), while it was negatively correlated with SMAD4 expression (Cor = ‒0.42, P < 0.0001) (Figure 5B). Similar results were also obtained in GSE62452 (Cor = 0.53, P < 0.0001 for KRAS; Cor = ‒0.70, P < 0.0001 for SMAD4) and GSE60979 datasets (Cor = 0.64, P < 0.0001 for KRAS; Cor = ‒0.51, P < 0.0001 for SMAD4) (Figure 5C, 5D). In addition, the associations among B3GNT3, KRAS, and SMAD4 in PC were also validated using the cBioportal database, the results of which were consistent with our findings (Supplementary Figure 2A, 2B). These findings suggest that B3GNT3 overexpression is correlated with the mutation and expression patterns of driver genes, especially for KRAS and SMAD4.
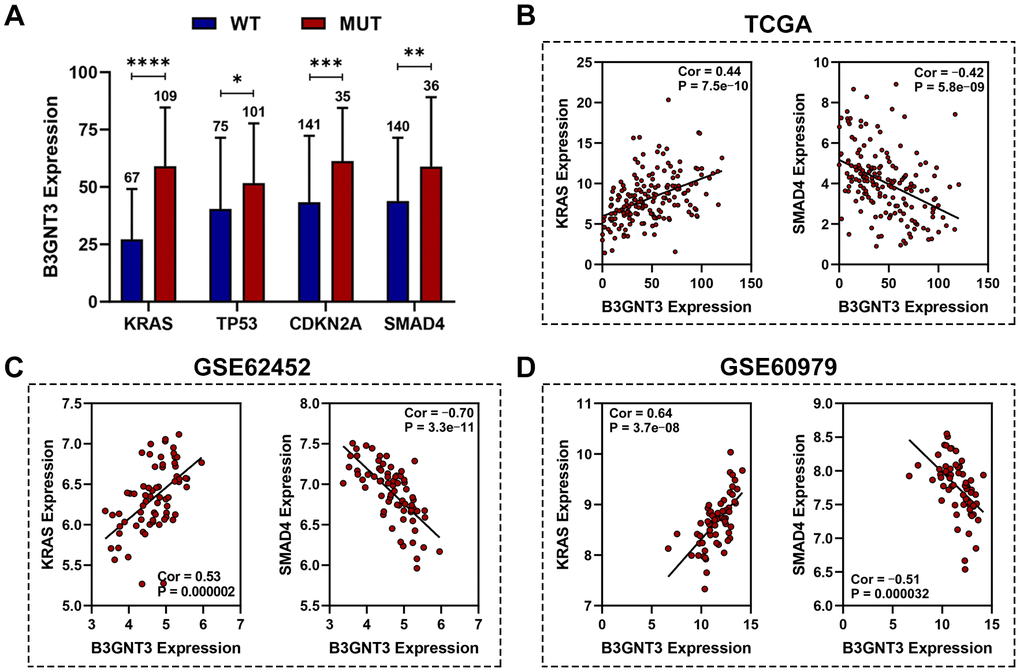
Figure 5. Association between B3GNT3 expression and somatic mutations. (A) KRAS, TP53, CDKN2A, and SMAD4 mutation status were significantly associated with higher expression of B3GNT3. (B–D) Correlation analysis of KRAS, SMAD4, and B3GNT3. PC, pancreatic cancer; TCGA, the Cancer Genome Atlas; WT: wild type; MUT: mutation. (*P value < 0.05; **P value < 0.01;***P value < 0.001; ****P value < 0.0001).
Functional enrichment analysis for B3GNT3
First, we used gene set enrichment analysis (GSEA) to determine whether these pathways and their associated genes differ between the high B3GNT3 and low B3GNT3 expression groups. We found that the T cell receptor signaling pathway-related gene set (NES = ‒1.75, P < 0.05, FDR < 25%) was enriched in the low B3GNT3 expression group (Figure 6A). Then, we conducted co-expression analysis (|Pearson correlation coefficient| > 0.75, P < 0.05) for B3GNT3 based on the TCGA dataset. As a result, 19 co-expressed genes for B3GNT3 were subsequently uploaded into ConsensuspathDB for pathway enrichment analysis (P < 0.05) (Figure 6B) [23]. B3GNT3 was found to be potentially involved in glycosphingolipid biosynthesis, leukocyte transendothelial migration, TGF-β signaling pathway, EMT, and TGF-β signaling pathway in EMT (Figure 6C). These findings indicate that B3GNT3 overexpression provides the necessary support for tumor growth and immune regulation of PC.
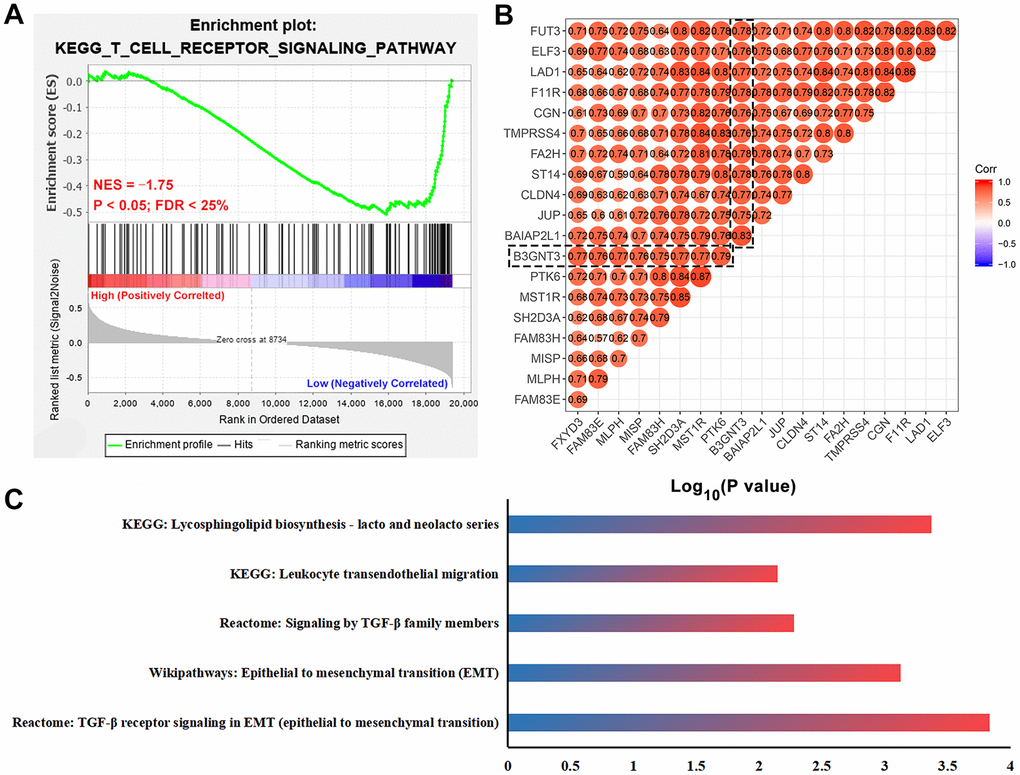
Figure 6. Functional enrichment analysis for B3GNT3. (A) GSEA revealed that T cell receptor signaling pathway related gene set (NES = -1.75, P < 0.05, and FDR < 25%) was enriched in the low B3GNT3 expression group. (B) Co-expression analysis for B3GNT3 in the TCGA PC dataset using Pearson correlation coefficients (Pearson correlated coefficient (Cor) > 0.75 or < -0.75, P value < 0.05). (C) Pathway enrichment analysis for B3GNT3. GSEA: gene set enrichment analysis; EMT: epithelial to mesenchymal transition; TCGA, the Cancer Genome Atlas; PC: pancreatic cancer.
B3GNT3 knockdown inhibits the proliferation, invasion, and EMT of PC cells
To further evaluate the functional role of B3GNT3 in tumor cell proliferation and invasion, we transfected PANC-1 and AsPC-1 cells with sh-B3GNT3. Abrogated levels of B3GNT3 in these two cells were validated using RT-qPCR analysis (P < 0.001) (Figure 7A). Then, the subclones KD1 and KD3 were selected for further experimental studies. The MTT assay revealed that cell proliferation was significantly inhibited in B3GNT3-depleted PANC-1 and AsPC-1 cells (P < 0.0001) (Figure 7B). Moreover, the transwell assay demonstrated that the number of invading cells was significantly decreased in the sh-B3GNT3 groups (KD1 and KD3) compared with those in the NC group (P < 0.0001) (Figure 7C). Western blot assay demonstrated that the expression of E-cadherin was increased, while the expression of N-cadherin and vimentin protein was decreased in the sh-B3GNT3 groups (KD1 and KD3) (Figure 7D). These findings suggest that the B3GNT3 knockdown significantly inhibits the proliferation, invasion, and EMT of PC cells.
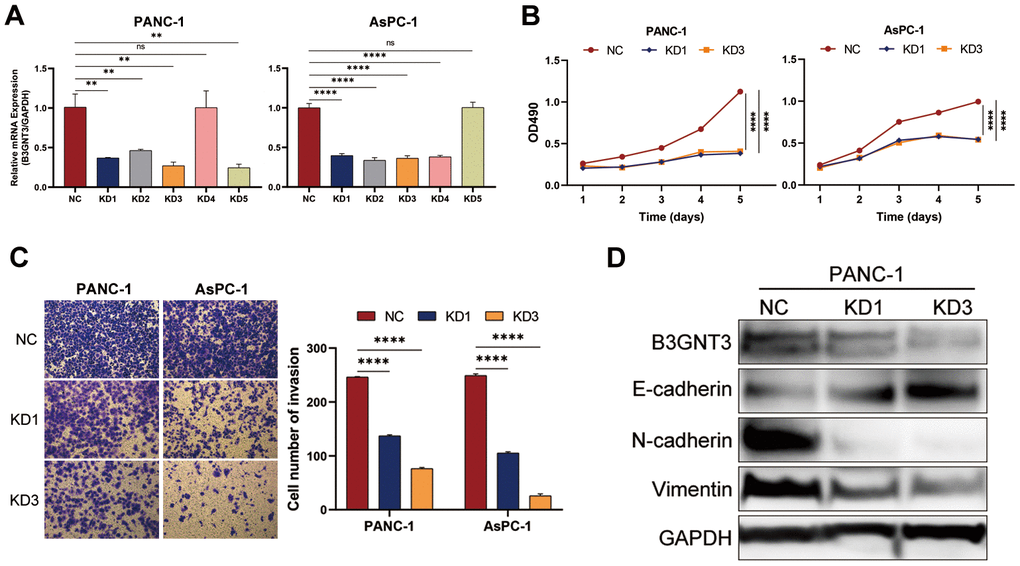
Figure 7. The knockdown of B3GNT3 suppresses the proliferation, invasion, and EMT of PC cells. (A) RT-PCR analysis validated the knockdown of B3GNT3 in PANC-1 and AsPC-1 cells transfected with sh-B3GNT3. (B) Assessment of cell proliferation using the MTT assay. (C) Transwell assay was performed to determine the invasive capacity of PANC-1 and AsPC-1 cells transfected with sh-B3GNT3. (D) WB analysis to investigate the association between B3GNT3 and EMT in PC. PC: pancreatic cancer; EMT: epithelia-mesenchymal transition; WB: western blot. (*p<0.05; **p<0.01;***p<0.001; ****p<0.0001).
B3GNT3 overexpression inhibits the infiltration of CD8+ T cell in PC
The ESTIMATE algorithm showed that higher B3GNT3 expression was significantly correlated with higher tumor purity (Cor = 0.50, P < 0.0001), but lower immune score (Cor = ‒0.39, P < 0.0001) (Figure 8A), a finding that was also observed in the GSE62452 dataset (Cor = 0.33, P = 0.0052 for tumor purity; Cor = ‒0.29, P = 0.016 for immune score) (Figure 8D). Using the CIBERSORT algorithm, we found that B3GNT3 overexpression significantly correlated with lower CD8+ T cells infiltration within the TME of PC (Figure 8B). In the TCGA PC dataset, similarly, ssGSEA analysis indicated that B3GNT3 overexpression was notably correlated with lower infiltrations of CD8+ T cells (Cor = ‒0.47, P < 0.0001), TILs (Cor = ‒0.46, P < 0.0001), cytolytic activity (Cor = ‒0.41, P < 0.0001), T cell co-stimulation (Cor = ‒0.37, P < 0.0001), and Th1 cells (Cor = ‒0.37, P < 0.0001), but higher Th2/Th1 (Cor = 0.33, P < 0.0001) (Figure 8C), which was entirely consistent with those we observed in GSE62452 dataset (Cor = ‒0.34, P = 0.004 for CD8+ T cells; Cor = ‒0.29, P = 0.015 for TILs; Cor = ‒0.24, P = 0.043 for cytolytic activity; Cor = ‒0.37, P = 0.0018 for T cell co-stimulation; Cor = ‒0.36, P = 0.0026 for Th1 cells; Cor = 0.50, P < 0.0001 for Th2/Th1) (Figure 8D). Furthermore, similar results were also observed in the GSE79668 dataset, which showed that B3GNT3 overexpression was significantly correlated with a low infiltration of TILs (Cor = ‒0.28, P = 0.045), T cell co-stimulation (Cor = ‒0.37, P = 0.0083), and Th1 cells (Cor = ‒0.29, P = 0.042), whereas it was correlated with high Th2/Th1 (Cor = 0.32, P = 0.023) (Figure 8E). Furthermore, B3GNT3 expression was also negatively correlated with gene markers from CD8+ T cells (CD8A and CD8B), T cells (general) (CD3D, CD3E, and CD2), and Th1 cells (STAT1 and TBX21), but positively correlated with gene markers from Th2 cells (STAT6 and GATA3) (Figure 9). Similar results were observed in the GEPIA database (Table 3).
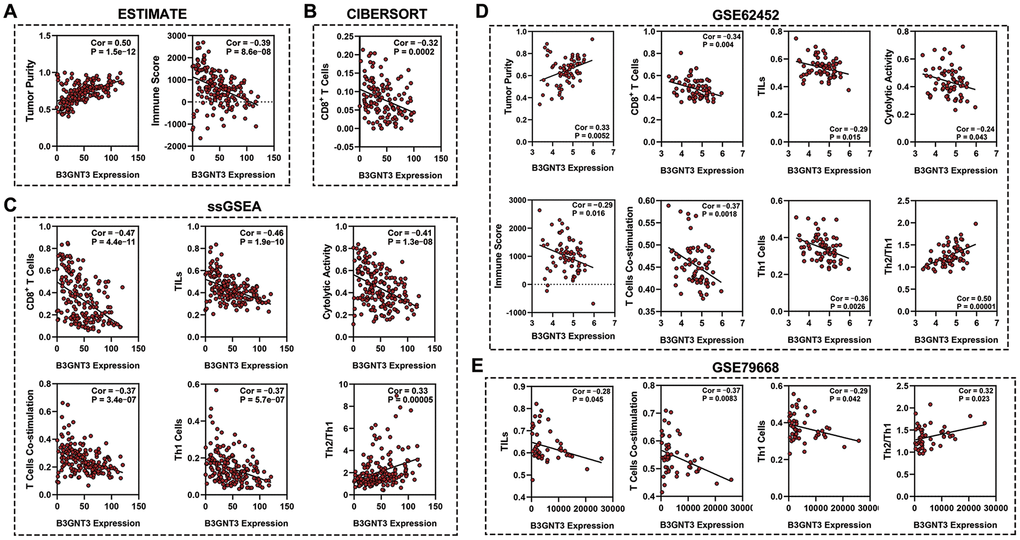
Figure 8. Association between B3GTN3 expression and the immune infiltration within tumor. (A) ESTIMATE algorithm to analyze the correlation between B3GNT3 expression and immune infiltration in PC. (B) CIBERSORT algorithm to analyze the correlation between B3GNT3 expression and immune infiltration in PC. (C) ssGSEA analysis to analyze the correlation between B3GNT3 expression and the immune infiltration in PC. (D) ESTIMATE algorithm and ssGSEA to analyze the correlation between B3GNT3 expression and immune infiltration within tumors in GSE62452 dataset. (E) ssGSEA analysis to analyze the correlation between B3GNT3 expression and immune infiltration within tumors in GSE79668 dataset. TCGA, the Cancer Genome Atlas; PC: pancreatic cancer; ssGSEA: single-sample gene set enrichment analysis; TILs: tumor-infiltrating lymphocytes; Th1 cells: Type-1 T helper cells; Th2/Th1: Type-2 T helper cells/ Type-1 T helper cells.
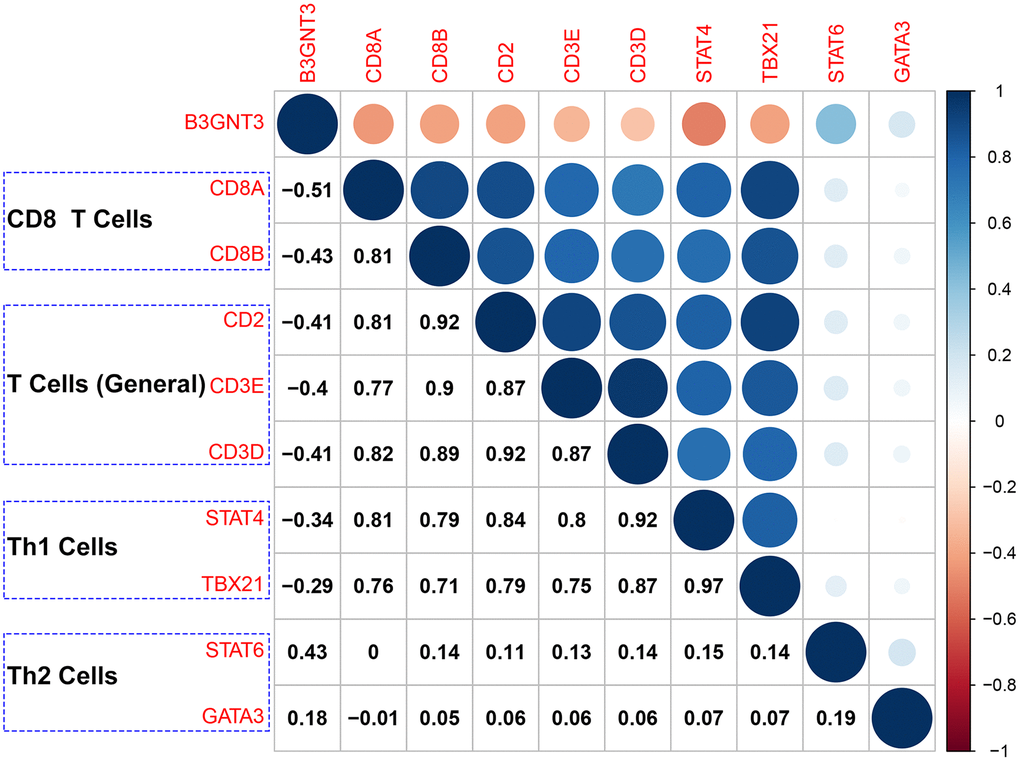
Figure 9. Correlation analysis of B3GNT3 expression and the expression of marker genes of CD8+ T cells (CD8A and CD8B), T cells (general) (CD2, CD3D, and CD3E), Th1 cells (STAT4 and TBX21), and Th2 cells (STAT6 and GATA3). Th1 cells: Type-1 T helper cells; Th2 cells: Type-2 T helper cells.
Table 3. Correlation analysis between B3GNT3 and immune cells marker in GEPIA.
| Immune cells | Gene markers | Tumor | Normal | ||||||||||||||||||||||||||||||||||||||||||||||||||||||||||||||||||||||||||||||||||||||||||||||||
| Cor | P value | Cor | P value | ||||||||||||||||||||||||||||||||||||||||||||||||||||||||||||||||||||||||||||||||||||||||||||||||
| CD8+ T Cells | CD8A | -0.36 | 8.70E-07 | 0.088 | 0.25 | ||||||||||||||||||||||||||||||||||||||||||||||||||||||||||||||||||||||||||||||||||||||||||||||
| CD8B | -0.38 | 1.50E-07 | 0.14 | 0.072 | |||||||||||||||||||||||||||||||||||||||||||||||||||||||||||||||||||||||||||||||||||||||||||||||
| T Cell (General) | CD2 | -0.38 | 1.30E-07 | 0.22 | 0.0044 | ||||||||||||||||||||||||||||||||||||||||||||||||||||||||||||||||||||||||||||||||||||||||||||||
| CD3D | -0.29 | 8.00E-05 | 0.18 | 0.022 | |||||||||||||||||||||||||||||||||||||||||||||||||||||||||||||||||||||||||||||||||||||||||||||||
| CD3E | -0.33 | 6.40E-06 | 0.15 | 0.054 | |||||||||||||||||||||||||||||||||||||||||||||||||||||||||||||||||||||||||||||||||||||||||||||||
| Th1 Cells | STAT4 | -0.45 | 3.10E-10 | 0.19 | 0.011 | ||||||||||||||||||||||||||||||||||||||||||||||||||||||||||||||||||||||||||||||||||||||||||||||
| T-bet (TBX21) | -0.38 | 1.30E-07 | 0.0036 | 0.96 | |||||||||||||||||||||||||||||||||||||||||||||||||||||||||||||||||||||||||||||||||||||||||||||||
| Th2 Cells | STAT6 | 0.48 | 9.40E-12 | 0.35 | 2.00E-06 | ||||||||||||||||||||||||||||||||||||||||||||||||||||||||||||||||||||||||||||||||||||||||||||||
| GATA3 | 0.25 | 6.50E-04 | 0.29 | 1.60E-04 | |||||||||||||||||||||||||||||||||||||||||||||||||||||||||||||||||||||||||||||||||||||||||||||||
| Bold values indicate P < 0.05 were considered statistically significant. | |||||||||||||||||||||||||||||||||||||||||||||||||||||||||||||||||||||||||||||||||||||||||||||||||||
To validate our findings from the TCGA and GEO datasets, we investigated the correlation between the expression pattern of B3GNT3 and the infiltration of CD8+ T cell by multi-color immunofluorescence in an independent dataset of 50 PC cases. Cases with less than 5% tumor or loss of tissues were excluded for the quantification of B3GNT3. Representative tumor cores were available from 46 patients. The high B3GNT3 expression group displayed a significantly increased CD8+ T cell infiltration compared to the low B3GNT3 expression group (Figure 10A–10C). Moreover, we further proved that B3GNT3 overexpression positively correlated with a worse OS in PC patients, while a higher CD8+ T cells infiltration in TME positively correlated with a better OS of PC patients (Figure 10D, 10E). Taken together, these findings suggest that B3GNT3 overexpression may inhibit TILs in PC, especially CD8+ T cells.
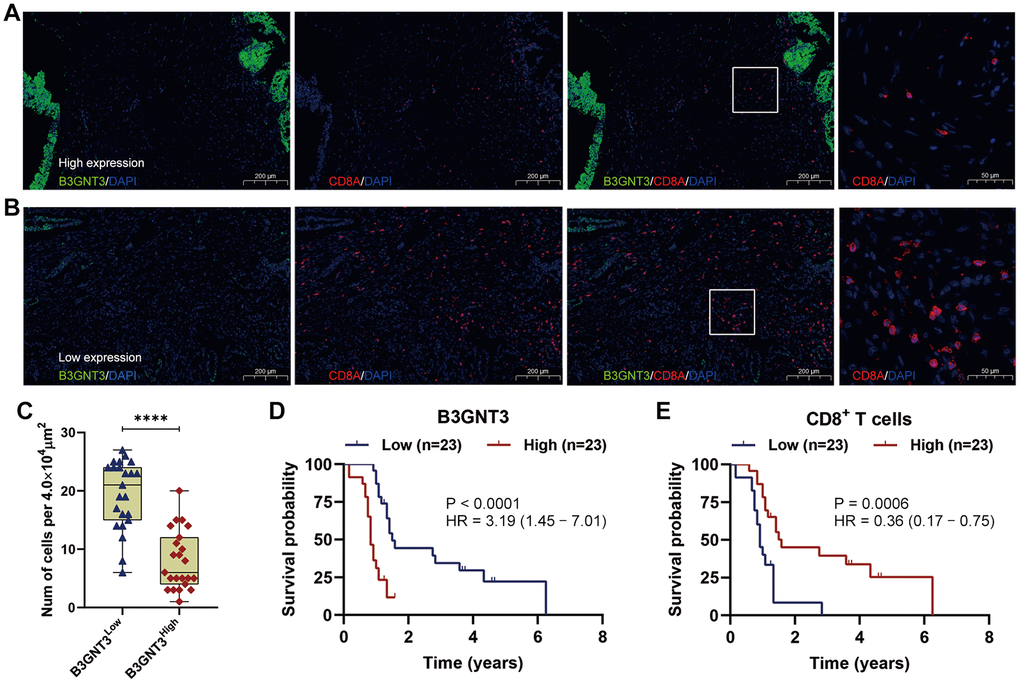
Figure 10. Multi-color immunofluorescence to investigate the relationship between B3GNT3 expression and CD8+ T cells infiltration in PC. (A) High B3GNT3 expression in multi-color immunofluorescence. (B) Low B3GNT3 expression in multi-color immunofluorescence. (C) High B3GNT3 expression group displayed a significant increased CD8+ T cells infiltration compared to low B3GNT3 expression group. (D) Patients with higher B3GNT3 expression had significant shorter OS that those with lower B3GNT3 expression. (E) Patients with higher CD8+ T cells infiltration had superior OS than those with lower CD8+ T cells infiltration.
Discussion
B3GNT3 has been demonstrated to be an oncogene in several cancers (e.g. lung cancer, pancreatic cancer, and breast cancer), and participates in lymphocyte trafficking and migration [13, 15, 16]. However, immune-related functional analyses of B3GNT3 in cancer are currently limited to triple-negative breast cancer and non-Hodgkin lymphoma [14, 16]. In this study, we aimed to delineate the biological role of B3GNT3 during pancreatic tumorigenesis and tumor immunity. Consistent with previous oncologic studies about B3GNT3, multiple PC databases indicated that B3GNT3 was notably overexpressed in tumor tissues [12, 16, 24], and positively correlated with tumor size, histologic grade, and poor survival of patients with PC, which indicates that B3GNT3 may be an unfavorable prognostic biomarker for PC. Based on these initial findings, we further explored the potential biological role of B3GNT3 during tumor growth and in the regulation of immune infiltration in PC.
Through GSEA, we found that tumors with low levels of B3GNT3 expression significantly enriched the T cell receptor signaling pathway-related gene set. Moreover, pathway enrichment analysis revealed that B3GNT3 plays a role in glycosphingolipid biosynthesis, leukocyte transendothelial migration, TGF-β signaling pathway, and EMT induced by TGF-β. Our schema was further supported by the fact that B3GNT3 knockdown significantly inhibited cell proliferation and invasion in PC cells. Importantly, the downregulation of B3GNT3 impaired the process of EMT in PC. These findings suggest that B3GNT3 overexpression in PC enhances the process of EMT in PC, thereby promoting tumor cell proliferation and invasion.
Previous studies have reported that TGF-β maintains tissue hemostasis and blocks cell cycle progression, thereby suppressing tumor formation [25, 26]. However, due to the inactivation of the TGF-β signaling mediator, SMAD4, the tumor suppressive role of TGF-β is always impaired in PC [27]. In the present study, B3GNT3 was markedly upregulated by SMAD4 mutations in PC and negatively associated with SMAD4 expression. Thus, we propose that B3GNT3 overexpression induces SMAD4 inactivation and promotes tumor growth and metastasis through TGF-β signaling pathway. However, further experimental studies are needed to demonstrate our proposed B3GNT3-SMAD4-TGF-β pathway hypothesis.
Our study also identified the novel role of B3GNT3 in tumor immunity of PC. The ESTIMATE algorithm showed that high levels of B3GNT3 expression were associated with increased tumor purity, but decreased immune score, suggesting that B3GNT3 overexpression may promote immunosuppression in PC. Both the CIBERSORT algorithm and ssGSEA demonstrated that B3GNT3 overexpression was significantly associated with a low infiltration of TILs (e.g. CD8+ T cells). Moreover, B3GNT3 was negatively correlated with CD8+ T cell markers, CD8A and CD8B, and general T cell markers, CD2, CD3D, and CD3E. Notably, multi-color immunofluorescence demonstrated that the high B3GNT3 expression group displayed a significantly increased CD8+ T cell infiltration compared to the low B3GNT3 expression group. These findings suggest that B3GNT3 overexpression may reduce CD8+ T cells infiltration in PC. A previous study reported that B3GNT3 overexpression impaired cytotoxic T cell-mediated anti-tumor immunity in triple-negative breast cancer [16]. However, this study is the first to demonstrate that B3GNT3 overexpression inhibits the infiltration of CD8+ T cells and cytolytic activity in PC.
Previous studies have reported that KRAS-mutated cancer cells help to build an immunosuppressive environment by regulating immune cells behavior in PC [28]. For example, KRAS-mutated cancer cells could induce myeloid-derived suppressor cells trafficking by secreting granulocyte macrophages and colony-stimulating factor (GM-CSF), which inhibits the behavior of CD8+ T cells [29]. KRAS activation was also reported to impede the antigen presentation pathway, thereby allowing the evasion of CD8+ T cells [30]. It has been reported that KRAS mutations in PC upregulate TGF-β levels, thereby downregulating CD8+ T cell infiltration, switching Th1/Th2, and hampering T cell co-stimulation, and subsequently contributes to immunosuppression in the TME [28, 31, 32]. Increasing studies show that the excessive TGF-β expression in tumors is highly related to the anti-tumor effect of CD8+ T cells [33]. Furthermore, Leung et al. reported that SMAD4 inactivation promotes KRAS-mediated malignant transformation, thereby promoting tumor progression in PC [34]. Our study demonstrates that high levels of B3GNT3 expression are associated with KRAS mutation and high KRAS expression. Based on our results, we propose that B3GNT3 overexpression, SMAD4 inactivation, and KRAS activation may interact to promote tumor growth and inhibit the infiltration of CD8+ T cells in PC.
In the present study, B3GNT3 overexpression was correlated with higher Th2/Th1 but a lower infiltration of Th1 cells (STAT1 and TBX21). Th2/Th1 is widely considered an independent unfavorable prognostic factor in post-surgery patients with PC [35–37]. Furthermore, Th2/Th1 has been reported to be inversely correlated with the presence of CD8+ T cells in PC [38, 39]. Th1 cells are crucial for the effective anti-cancer function of the immune system [36, 37]. Th2 cells drive tumor-promoting inflammation, leading to poor survival outcomes of PC [39]. The infiltration of CD8+ T cells in patients with PC is inhibited or impaired when Th2 dominates the TME [40]. Moreover, DeNardo et al. demonstrated that Th2 cells can produce IL4, IL10, and IL13, which impair the cytolytic activity of CD8+ T cells [41]. These results imply that B3GNT3 overexpression in PC switched Th1/Th2, which induced the domination of Th2 cells in the TME of PC, leading to an immunosuppressive TME with a limited infiltration of CD8+ T cells. Thus, targeting B3GNT3 may recover CD8+ T cell infiltration within the TME of PC, which could be a novel therapeutic strategy for PC.
The current study demonstrated that B3GNT3 overexpression may promote TGF-β-induced EMT in PC. Previously, several studies have suggested that TGF-β promotes EMT, which induces immune evasion or suppression in the TME [42, 43]. In their review, Jiang et al. found that the EMT played a pivotal role in tumor immunosuppression and immune evasion [44]. Besides, the process of EMT promotes therapeutic resistance to ICIs [45, 46]. Li et al. suggested targeting B3GNT3 as a novel strategy to enhance immune checkpoint therapies [16]. It has also been reported that inhibiting TGF-β signaling pathway could improve the efficacy of ICIs [33]. Similarly, we proposed that blocking EMT or TGF-β by targeting B3GNT3 may be an effective therapeutic direction to enhance current immune-based therapies.
As far as we know, this study is the first to describe an association between the expression of B3GNT3 and CD8+ T cell infiltration in PC. However, there are some limitations. First, the outcome of this studies was somehow influenced by the quality of data from public databases. Second, the biological role of B3GNT3 in pancreatic carcinogenesis and the modulation of tumor immunity has only been preliminarily validated in vitro and through multi-color immunofluorescence. Future studies should be conducted to determine how B3GNT3 induces immune suppression through the EMT or TGF-β signaling pathways in PC.
In conclusion, our findings indicate that B3GNT3 overexpression promoted tumor progression and was notably associated with a decreased infiltration and cytolytic activity of CD8+ T cells, but increased Th2/Th1. Thus, we established B3GNT3 as a novel prognostic biomarker, inhibiting CD8+ T cell infiltration in PC, and a promising therapeutic target in PC.
Materials and Methods
Acquisition of data
We obtained the RNA-sequencing data and corresponding clinical data of PC patients from The Cancer Genome Atlas (TCGA, https://cancergenome.nih.gov/) in February 2020. Mutation information for KRAS, TP53, SMAD4, and CDKN2A in the TCGG PC dataset were downloaded through the cBioportal database (http://www.cbioportal.org/). Of the 177 patients in TCGA PC dataset, 171 had an OS > 1 month. In addition, the relevant PC datasets were retrieved from the Gene Expression Omnibus (GEO) (http://www.ncbi.nlm.nih.gov/geo/) using the following search words: “pancreatic ductal adenocarcinoma” and “pancreatic cancer”. The exclusion criteria included: (1) studies involving only blood samples; (2) studies with fewer than 30 PC samples; (3) studies involving only PC cell lines or xenografts. Finally, four GEO datasets, including GSE62452 [GPL6244 (HuGene-1_0-st) Affymetrix Human Gene 1.0 ST Array (transcript (gene) version); 61 non-tumor samples and 69 pancreatic tumor samples], GSE60979 [GPL14550 SurePrint G3 Human GE 8x60K Microarray; 12 non-tumor samples and 49 pancreatic cancer samples], GSE28735 [GPL6244 (HuGene-1_0-st) Affymetrix Human Gene 1.0 ST Array (transcript (gene) version); 45 pairs of pancreatic tumor and adjacent non-tumor tissues], and GSE79668 (GpL11154 Illumina HiSeq 2000 (Homo sapiens); 51 pancreatic tumor samples], were selected for further analysis [47]. All datasets involved in this study are publicly available. Thus, local ethics approval was not required. A flowchart of our study is provided in Supplementary Figure 3.
Differential expression analysis for B3GNT3
Multiple datasets were utilized to evaluate B3GNT3 expression in PC. First, differential expression analysis for B3GNT3 was conducted using GSE62452 dataset and GSE60979 dataset. Then, the Oncomine database and GEPIA database were further used to analyze B3GNT3 expression in PC. Paired differential expression analysis for B3GNT3 was also conducted using GSE28735 dataset. Moreover, the HPA database was used to further validate B3GNT3 protein expression in PC samples and normal pancreatic tissues, and B3GNT3 expression in cancer cell lines.
Kaplan-Meier survival analysis
GSE62452, GSE79668 and TCGA datasets were used in survival analysis to assess the prognostic value of B3GNT3 expression in PC. We divided patients in these three PC datasets, respectively, into high- and low-B3GNT3 expression groups, according to the medium cutoff of B3GNT3 expression. KM survival curves were conducted using the “survminer” package in R.
Functional enrichment analysis
First, we performed GSEA to evaluate the differences in possible biological pathways between the high- and low-B3GNT3 expression groups in the TCGA PC dataset. An annotated gene set c2.cp.kegg.6.2.symbols.gmt obtained from the Molecular Signatures Database (MSigDB) was used as the reference gene set. Genes significantly related to B3GNT3 in the TCGA PC dataset were sniffed out with |Pearson correlation coefficient (Cor)| >0.75 and P < 0.05. These co-expressed genes of B3GNT3 were subsequently uploaded into ConsensuspathDB (http://cpdb.molgen.mpg.de/) for functional enrichment analysis, with P < 0.01 considered significant [23].
Cell culture and transfection
We purchased Human PC cell lines, PANC-1 and Aspc-1 from the Cell Bank of the Chinese Academy of Science (Shanghai, China). Cells were subsequently cultured in RPMI-1640 medium (Invitrogen, Carlsbad, CA, USA) containing 10% fetal bovine serum (FBS) (HyClone, Logan, UT, USA) and 1% penicillin/streptomycin in a humidified 5% CO2 incubator at 37° C [48]. Cells were plated in 6-well plates at a density of 1 × 10⁶ cells per well before transfection [48]. Lentiviral small hairpin RNA (shRNA) targeting B3GNT3 was synthesized and cloned into the GV248 vector (Genechem Co., Ltd, Shanghai, China). As previous studies introduced [48, 49], at 80% confluence, the B3GNT3 lentiviruses (sh-B3GNT3) and the negative control shRNA (NC) were transfected into the cells using Lipofectamine 2000 (Invitrogen). At 48 h post-transfection, the cells were harvested for further analyses. The efficacy of sh-B3GNT3 for each cell line was assessed using qRT-PCR. The PCR primers were as follows: B3GNT3 forward, 5′-CAGCACGTTCAGAACTTCCTC-3′; B3GNT3 reverse, 5′-GCGCACATAGTTGCTAGGGG-3′; GAPDH forward, 5′-TGACTTCAACAGCGACACCCA-3′; GAPDH reverse, 5′-CACCCTGTTGCTGTAGCCAAA-3′.
MTT assay
The 3-(4,5-dimethylthiazal-2-yl)-2, 5-diphenyl-tetrazolium bromide (MTT) assay was used to measure PC cell proliferation. Cells were plated in 96-well plates at 2,000 cells/well and cultured for 1-5 days. At the indicated periods, 20 μL of MTT (5 mg/mL) (Sigma-Aldrich, St. Louis, MO, USA) solution was added to each well and further incubated for 4 h at 37° C [50]. Then, 100 μL of DMSO (Corning Inc., Corning, NY, USA) was added to each well to solubilize the formation product. Finally, a microplate reader (Bio-Tek Company, Winooski, VT, USA) was utilized to measure the absorbance at 490 nm, as previously described [48, 51].
Transwell invasion assays
The cell invasion assay was conducted using Transwell Permeable Supports (Corning Inc., Corning, NY, USA), as previously described [48, 52]. Cells (1.0 × 10⁵) suspended in serum-free medium were plated in triplicate onto 8-μm Transwell filter inserts of 24-well plates pre-coated with Matrigel (10 mg/L) (BD Biosciences, San Jose, CA, USA). And 10% fetal bovine serum (FBS) was added into the lower chamber. After 18 h, the cells in the upper chamber were wiped with a cotton-tipped swab. Then, the chambers were fixed with 100% methanol and stained with 0.5% crystal violet for 20 min. Images of invaded cells were obtained through an inverted light microscope (Olympus Corp., Tokyo, Japan). Nine fields were observed at random in each group.
Western blot analysis
Radio immunoprecipitation assay lysis buffer containing proteinase inhibitors (Beyotime, Jiangsu, China) was utilized to extract protein from cultured cells. Protein concentrations were determined using the BCA Protein Assay Kit (Pierce, Rockford, IL, USA). Protein samples (30 μg) from each group were resolved on 10% SDS-PAGE and transferred onto nitrocellulose membranes [51]. Then, the membranes were then incubated with anti-B3GNT3 (NBP1-32539; Novus Biologicals), E-Cadherin (ab40772; Abcam), N-cadherin (ab76011; Abcam), vimentin (ab92547, Abcam), and anti-GAPHD (ab181602; Abcam). After washing, the membranes were subsequently incubated with secondary horseradish peroxidase-conjugated antibody (1:5000; Santa Cruz Biotechnology) for 1 h at room temperature. Protein-expressing signals were visualized using the Western Lightning Plus ECL kit (PerkinElmer, Waltham, MA, USA) and quantified by densitometry, as previously described [50].
Immune infiltration analysis in PC through multiple datasets
As previously introduced [53], we were using the “estimate” package in R to perform the ESTIMATE algorithm in the TCGA PC dataset, which was based on ssGSEA to generate a tumor purity score and an immune score [18]. PC samples with high immune scores showed high level of immune cells infiltration within the TME. A higher tumor purity score indicates a lower immune infiltration in tumor tissues. The CIBERSORT algorithm is an analytic tool that estimates specific cell type frequencies using gene expression data. Thus, we used the CIBERSORT algorithm to estimate the fraction of 22 immune cell types in each tumor tissue in the TCGA PC dataset [17]. Next, using the “gsva” package in R, ssGSEA was conducted to calculate the enrichment scores of each immune-related term in the TCGA PC dataset [19]. The gene sets of the following 29 immune-related terms (CD8+ T cells, cytolytic activity, regulatory T cells (Treg), tumor-associated macrophages (TAMs), natural killer cells (NK cells), type-2 T helper cells (Th2 cells), type-1 T helper cells (Th1 cells), antigen-presenting cell (APC) co-stimulation, antigen-presenting cell (APC) co-inhibition, type-1 IFN response, major histocompatibility complex (MHC) class-1, parainflammation, plasmacytoid dendritic cells (pDCs), T cell co-stimulation, activated dendritic cells (aDCs), check-point, T cell co-inhibition, B cells, follicular helper T cells (Tfh), neutrophils, tumor-infiltrating lymphocyte (TIL), inflammation-promoting, type-1 IFN response, human leukocyte antigen (HLA), T helper cells, chemokine receptor (CCR), mast cells, dendritic cells, and immature dendritic cells (iDCs)) were obtained from a previous study [54]. Correlation analysis between B3GNT3 expression and immune infiltration was conducted using Pearson correlation coefficients (|Cor| > 0.3 and P < 0.05) [55]. The GSE62452 and GSE79668 datasets were used to validate the immune infiltration landscape of PC using ESTIMATE and ssGSEA. Furthermore, we conducted correlation analysis between B3GNT3 and specific immune cells markers to further confirm the association between B3GNT3 and immune infiltration in PC.
Tissue microarray (TMA) construction
A total of 50 samples of PC patients were collected after R0 resection in Guangdong Provincial People’s Hospital during 2013-2020. All PC patients were regularly followed up in our institution. The OS of these 50 patients was >1 month. Thereafter, a TMA was constructed for the 50 samples using 1.5 mm tissue cores. However, the final number of samples analyzed was lower due to the absence or limited tumor cells in some samples or unavoidable loss of tissue, as commonly occurs in TMA studies [56]. All tissues were approved by the Clinical Research Ethics Committee of Guangdong Provincial People’s Hospital. Informed consent was obtained from all participants.
Multi-color immunofluorescence
We measured the expression level of B3GNT3 using multi-color immunofluorescence in the TMA slides. B3GNT3 (NBP1-32539; Novus Biologicals) and CD8A (ab17147; Abcam) were simultaneously stained in serial sections from the TMA blocks. In short, antigen retrieval was performed with citrate buffer pH 8.0 for 20 min at 97° C in a pressure-boiling container. Blocking was subsequently conducted using 0.3% bovine serum albumin in 0.05% Tween solution for 30 min [56], followed by incubation with primary antibodies at 4° C overnight. At last, fluorescein-labeled secondary antibodies were added for signaling detection at room temperature. Nuclei were detected with DAPI. The samples were photographed using a laser confocal microscope. The area quantification the FL method of Halo software v3.0.311.314 (Indica Labs, USA) was used to quantify the intensities of the B3GNT3 fluorescent signals. Then, we divided the samples into high- and low-B3GNT3 expression groups according to the medium cutoff of the B3GNT3 fluorescent signal intensity. On each slide, three stromal areas of 4 × 104 μm2 were randomly selected based on DAPI staining. Within each area, CD8+ T cells were counted manually, and the average CD8+ T cell counts within the three stromal areas (4 × 104 μm2) were calculated for each slide. Lastly, we evaluated the differences in CD8+ T cell count (per 4 × 104 μm2) between the high- and low-B3GNT3 expression groups.
Statistical analysis
All statistical analyses were performed using SPSS 25.0 software, R 3.5.2 software (http://r-project.org/), and GraphPad Prism 8.0 software (GraphPad Software, Inc.). Group differences were analyzed by Wilcoxon test or Kruskal-wallis test, and expressed as the mean ± standard deviation (SD). Correlation analysis was performed with the Pearson correlation coefficient. P < 0.05 was considered statistically significant.
Supplementary Materials
Author Contributions
Conceptualization: Z.H.K., Z.C.Z., and H.B.H.; Methodology: Z.H.K., Z.Z.X., Z.Z.D., and C.X.M.; Investigation: H.S.Z, Z.C.Z., and C.X.M.; Writing – Original Draft: Z.H.K., Z.Z.X., C.X.M., M.Z.Y., and Z.Z.D.; Writing – Review and Editing: Z.H.K., Z.D.Z., and G.Y.G.; Visualization: Z.H.K., Z.D.Z., and C.X.M.; Supervision: Z.H.K., Z.C.Z., and H.B.H.; Funding Acquisition: Z.C.Z. and H.B.H.
Acknowledgments
We gratefully acknowledge the Gene Expression Omnibus and The Cancer Genome Atlas. We would like to thank Editage (https://www.editage.cn/) for English language editing.
Conflicts of Interest
The authors declare that they have no potential conflicts of interest.
Funding
This study was supported by National Natural Science Foundation of China (project NO.: 81702783, 81672475, 82072637, and 82072635) and The Guangzhou Science and Technology Project (project NO.: 201707010323).
References
- 1. Kamisawa T, Wood LD, Itoi T, Takaori K. Pancreatic cancer. Lancet. 2016; 388:73–85. https://doi.org/10.1016/S0140-6736(16)00141-0 [PubMed]
- 2. McGuigan A, Kelly P, Turkington RC, Jones C, Coleman HG, McCain RS. Pancreatic cancer: a review of clinical diagnosis, epidemiology, treatment and outcomes. World J Gastroenterol. 2018; 24:4846–61. https://doi.org/10.3748/wjg.v24.i43.4846 [PubMed]
- 3. Cervello M, Emma MR, Augello G, Cusimano A, Giannitrapani L, Soresi M, Akula SM, Abrams SL, Steelman LS, Gulino A, Belmonte B, Montalto G, McCubrey JA. New landscapes and horizons in hepatocellular carcinoma therapy. Aging (Albany NY). 2020; 12:3053–94. https://doi.org/10.18632/aging.102777 [PubMed]
- 4. Schouwenburg MG, Suijkerbuijk KP, Koornstra RH, Jochems A, van Zeijl MC, van den Eertwegh AJ, Haanen JB, Aarts MJ, Akkooi AC, Berkmortel FW, Groot JW, Hospers GA, Kapiteijn E, et al. Switching to immune checkpoint inhibitors upon response to targeted therapy; the road to long-term survival in advanced melanoma patients with highly elevated serum LDH? Cancers (Basel). 2019; 11:1940. https://doi.org/10.3390/cancers11121940 [PubMed]
- 5. Ridolfi L, De Rosa F, Petracci E, Tanda ET, Marra E, Pigozzo J, Marconcini R, Guida M, Cappellini GC, Gallizzi G, Occelli M, Pala L, Gambale E, et al, and Italian Melanoma Intergroup (IMI). anti-PD1 antibodies in patients aged ≥ 75 years with metastatic melanoma: a retrospective multicentre study. J Geriatr Oncol. 2020; 11:515–22. https://doi.org/10.1016/j.jgo.2019.12.012 [PubMed]
- 6. Fu Y, Liu S, Zeng S, Shen H. From bench to bed: the tumor immune microenvironment and current immunotherapeutic strategies for hepatocellular carcinoma. J Exp Clin Cancer Res. 2019; 38:396. https://doi.org/10.1186/s13046-019-1396-4 [PubMed]
- 7. Ferris RL, Blumenschein G
Jr , Fayette J, Guigay J, Colevas AD, Licitra L, Harrington K, Kasper S, Vokes EE, Even C, Worden F, Saba NF, Iglesias Docampo LC, et al. Nivolumab for Recurrent Squamous-Cell Carcinoma of the Head and Neck. N Engl J Med. 2016; 375:1856–1867. https://doi.org/10.1056/NEJMoa1602252 [PubMed] - 8. Fournel L, Wu Z, Stadler N, Damotte D, Lococo F, Boulle G, Ségal-Bendirdjian E, Bobbio A, Icard P, Trédaniel J, Alifano M, Forgez P. Cisplatin increases PD-L1 expression and optimizes immune check-point blockade in non-small cell lung cancer. Cancer Lett. 2019; 464:5–14. https://doi.org/10.1016/j.canlet.2019.08.005 [PubMed]
- 9. Balachandran VP, Beatty GL, Dougan SK. Broadening the impact of immunotherapy to pancreatic cancer: challenges and opportunities. Gastroenterology. 2019; 156:2056–72. https://doi.org/10.1053/j.gastro.2018.12.038 [PubMed]
- 10. Li J, Yuan S, Norgard RJ, Yan F, Yamazoe T, Blanco A, Stanger BZ. Tumor cell-intrinsic USP22 suppresses antitumor immunity in pancreatic cancer. Cancer Immunol Res. 2020; 8:282–91. https://doi.org/10.1158/2326-6066.CIR-19-0661 [PubMed]
- 11. Hou YC, Chao YJ, Hsieh MH, Tung HL, Wang HC, Shan YS. Low CD8⁺ T cell infiltration and high PD-L1 expression are associated with level of CD44⁺/CD133⁺ cancer stem cells and predict an unfavorable prognosis in pancreatic cancer. Cancers (Basel). 2019; 11:541. https://doi.org/10.3390/cancers11040541 [PubMed]
- 12. Zhang W, Hou T, Niu C, Song L, Zhang Y. B3GNT3 expression is a novel marker correlated with pelvic lymph node metastasis and poor clinical outcome in early-stage cervical cancer. PLoS One. 2015; 10:e0144360. https://doi.org/10.1371/journal.pone.0144360 [PubMed]
- 13. Barkeer S, Chugh S, Karmakar S, Kaushik G, Rauth S, Rachagani S, Batra SK, Ponnusamy MP. Novel role of O-glycosyltransferases GALNT3 and B3GNT3 in the self-renewal of pancreatic cancer stem cells. BMC Cancer. 2018; 18:1157. https://doi.org/10.1186/s12885-018-5074-2 [PubMed]
- 14. Cerhan JR, Ansell SM, Fredericksen ZS, Kay NE, Liebow M, Call TG, Dogan A, Cunningham JM, Wang AH, Liu-Mares W, Macon WR, Jelinek D, Witzig TE, et al. Genetic variation in 1253 immune and inflammation genes and risk of non-hodgkin lymphoma. Blood. 2007; 110:4455–63. https://doi.org/10.1182/blood-2007-05-088682 [PubMed]
- 15. Gao L, Zhang H, Zhang B, Zhu J, Chen C, Liu W. B3GNT3 overexpression is associated with unfavourable survival in non-small cell lung cancer. J Clin Pathol. 2018; 71:642–47. https://doi.org/10.1136/jclinpath-2017-204860 [PubMed]
- 16. Li CW, Lim SO, Chung EM, Kim YS, Park AH, Yao J, Cha JH, Xia W, Chan LC, Kim T, Chang SS, Lee HH, Chou CK, et al. Eradication of triple-negative breast cancer cells by targeting glycosylated PD-L1. Cancer Cell. 2018; 33:187–201.e10. https://doi.org/10.1016/j.ccell.2018.01.009 [PubMed]
- 17. Newman AM, Liu CL, Green MR, Gentles AJ, Feng W, Xu Y, Hoang CD, Diehn M, Alizadeh AA. Robust enumeration of cell subsets from tissue expression profiles. Nat Methods. 2015; 12:453–57. https://doi.org/10.1038/nmeth.3337 [PubMed]
- 18. Yoshihara K, Shahmoradgoli M, Martínez E, Vegesna R, Kim H, Torres-Garcia W, Treviño V, Shen H, Laird PW, Levine DA, Carter SL, Getz G, Stemke-Hale K, et al. Inferring tumour purity and stromal and immune cell admixture from expression data. Nat Commun. 2013; 4:2612. https://doi.org/10.1038/ncomms3612 [PubMed]
- 19. Hänzelmann S, Castelo R, Guinney J. GSVA: gene set variation analysis for microarray and RNA-seq data. BMC Bioinformatics. 2013; 14:7. https://doi.org/10.1186/1471-2105-14-7 [PubMed]
- 20. Singh RR, Goldberg J, Varghese AM, Yu KH, Park W, O’Reilly EM. Genomic profiling in pancreatic ductal adenocarcinoma and a pathway towards therapy individualization: a scoping review. Cancer Treat Rev. 2019; 75:27–38. https://doi.org/10.1016/j.ctrv.2019.03.003 [PubMed]
- 21. Chiaravalli M, Reni M, O’Reilly EM. Pancreatic ductal adenocarcinoma: state-of-the-art 2017 and new therapeutic strategies. Cancer Treat Rev. 2017; 60:32–43. https://doi.org/10.1016/j.ctrv.2017.08.007 [PubMed]
- 22. Søreide K, Sund M. Epidemiological-molecular evidence of metabolic reprogramming on proliferation, autophagy and cell signaling in pancreas cancer. Cancer Lett. 2015; 356:281–88. https://doi.org/10.1016/j.canlet.2014.03.028 [PubMed]
- 23. Kamburov A, Stelzl U, Lehrach H, Herwig R. The ConsensusPathDB interaction database: 2013 update. Nucleic Acids Res. 2013; 41:D793–800. https://doi.org/10.1093/nar/gks1055 [PubMed]
- 24. Ho WL, Che MI, Chou CH, Chang HH, Jeng YM, Hsu WM, Lin KH, Huang MC. B3GNT3 expression suppresses cell migration and invasion and predicts favorable outcomes in neuroblastoma. Cancer Sci. 2013; 104:1600–08. https://doi.org/10.1111/cas.12294 [PubMed]
- 25. Chen Y, Di C, Zhang X, Wang J, Wang F, Yan JF, Xu C, Zhang J, Zhang Q, Li H, Yang H, Zhang H. Transforming growth factor β signaling pathway: A promising therapeutic target for cancer. J Cell Physiol. 2020; 235:1903–1914. https://doi.org/10.1002/jcp.29108 [PubMed]
- 26. Fang P, Li X, Dai J, Cole L, Camacho JA, Zhang Y, Ji Y, Wang J, Yang XF, Wang H. Immune cell subset differentiation and tissue inflammation. J Hematol Oncol. 2018; 11:97. https://doi.org/10.1186/s13045-018-0637-x [PubMed]
- 27. Ahmed S, Bradshaw AD, Gera S, Dewan MZ, Xu R. The TGF-β/Smad4 signaling pathway in pancreatic carcinogenesis and its clinical significance. J Clin Med. 2017; 6:5. https://doi.org/10.3390/jcm6010005 [PubMed]
- 28. Cullis J, Das S, Bar-Sagi D. Kras and tumor immunity: friend or foe? Cold Spring Harb Perspect Med. 2018; 8:a031849. https://doi.org/10.1101/cshperspect.a031849 [PubMed]
- 29. Bayne LJ, Beatty GL, Jhala N, Clark CE, Rhim AD, Stanger BZ, Vonderheide RH. Tumor-derived granulocyte-macrophage colony-stimulating factor regulates myeloid inflammation and T cell immunity in pancreatic cancer. Cancer Cell. 2012; 21:822–35. https://doi.org/10.1016/j.ccr.2012.04.025 [PubMed]
- 30. El-Jawhari JJ, El-Sherbiny YM, Scott GB, Morgan RS, Prestwich R, Bowles PA, Blair GE, Tanaka T, Rabbitts TH, Meade JL, Cook GP. Blocking oncogenic RAS enhances tumour cell surface MHC class I expression but does not alter susceptibility to cytotoxic lymphocytes. Mol Immunol. 2014; 58:160–8. https://doi.org/10.1016/j.molimm.2013.11.020 [PubMed]
- 31. Cheng H, Fan K, Luo G, Fan Z, Yang C, Huang Q, Jin K, Xu J, Yu X, Liu C. KrasG12D mutation contributes to regulatory T cell conversion through activation of the MEK/ERK pathway in pancreatic cancer. Cancer Lett. 2019; 446:103–11. https://doi.org/10.1016/j.canlet.2019.01.013 [PubMed]
- 32. Neuzillet C, Tijeras-Raballand A, Cohen R, Cros J, Faivre S, Raymond E, de Gramont A. Targeting the TGFβ pathway for cancer therapy. Pharmacol Ther. 2015; 147:22–31. https://doi.org/10.1016/j.pharmthera.2014.11.001 [PubMed]
- 33. Bai X, Yi M, Jiao Y, Chu Q, Wu K. Blocking TGF-β signaling to enhance the efficacy of immune checkpoint inhibitor. Onco Targets Ther. 2019; 12:9527–38. https://doi.org/10.2147/OTT.S224013 [PubMed]
- 34. Leung L, Radulovich N, Zhu CQ, Wang D, To C, Ibrahimov E, Tsao MS. Loss of canonical Smad4 signaling promotes KRAS driven Malignant transformation of human pancreatic duct epithelial cells and metastasis. PLoS One. 2013; 8:e84366. https://doi.org/10.1371/journal.pone.0084366 [PubMed]
- 35. Mantovani A, Allavena P, Sica A, Balkwill F. Cancer-related inflammation. Nature. 2008; 454:436–44. https://doi.org/10.1038/nature07205 [PubMed]
- 36. Mortara L, Balza E, Bruno A, Poggi A, Orecchia P, Carnemolla B. Anti-cancer therapies employing IL-2 cytokine tumor targeting: contribution of innate, adaptive and immunosuppressive cells in the anti-tumor efficacy. Front Immunol. 2018; 9:2905. https://doi.org/10.3389/fimmu.2018.02905 [PubMed]
- 37. Lin CM, Lin LW, Chen YW, Ye YL. The expression and prognostic impact of proinflammatory cytokines and their associations with carcinogens in oropharyngeal squamous cell carcinoma. Cancer Immunol Immunother. 2020; 69:549–58. https://doi.org/10.1007/s00262-020-02488-w [PubMed]
- 38. Brunetto E, De Monte L, Balzano G, Camisa B, Laino V, Riba M, Heltai S, Bianchi M, Bordignon C, Falconi M, Bondanza A, Doglioni C, Protti MP. The IL-1/IL-1 receptor axis and tumor cell released inflammasome adaptor ASC are key regulators of TSLP secretion by cancer associated fibroblasts in pancreatic cancer. J Immunother Cancer. 2019; 7:45. https://doi.org/10.1186/s40425-019-0521-4 [PubMed]
- 39. Protti MP, De Monte L. Cross-talk within the tumor microenvironment mediates Th2-type inflammation in pancreatic cancer. Oncoimmunology. 2012; 1:89–91. https://doi.org/10.4161/onci.1.1.17939 [PubMed]
- 40. Bellone G, Turletti A, Artusio E, Mareschi K, Carbone A, Tibaudi D, Robecchi A, Emanuelli G, Rodeck U. Tumor-associated transforming growth factor-beta and interleukin-10 contribute to a systemic Th2 immune phenotype in pancreatic carcinoma patients. Am J Pathol. 1999; 155:537–47. https://doi.org/10.1016/s0002-9440(10)65149-8 [PubMed]
- 41. DeNardo DG, Coussens LM. Inflammation and breast cancer. Balancing immune response: crosstalk between adaptive and innate immune cells during breast cancer progression. Breast Cancer Res. 2007; 9:212. https://doi.org/10.1186/bcr1746 [PubMed]
- 42. Hao Y, Baker D, Ten Dijke P. TGF-β-mediated epithelial-mesenchymal transition and cancer metastasis. Int J Mol Sci. 2019; 20:2767. https://doi.org/10.3390/ijms20112767 [PubMed]
- 43. Ungefroren H. TGF-β signaling in cancer: control by negative regulators and crosstalk with proinflammatory and fibrogenic pathways. Cancers (Basel). 2019; 11:384. https://doi.org/10.3390/cancers11030384 [PubMed]
- 44. Jiang Y, Zhan H. Communication between EMT and PD-L1 signaling: new insights into tumor immune evasion. Cancer Lett. 2020; 468:72–81. https://doi.org/10.1016/j.canlet.2019.10.013 [PubMed]
- 45. Hugo W, Zaretsky JM, Sun L, Song C, Moreno BH, Hu-Lieskovan S, Berent-Maoz B, Pang J, Chmielowski B, Cherry G, Seja E, Lomeli S, Kong X, et al. Genomic and transcriptomic features of response to anti-PD-1 therapy in metastatic melanoma. Cell. 2017; 168:542. https://doi.org/10.1016/j.cell.2017.01.010 [PubMed]
- 46. Soundararajan R, Fradette JJ, Konen JM, Moulder S, Zhang X, Gibbons DL, Varadarajan N, Wistuba II, Tripathy D, Bernatchez C, Byers LA, Chang JT, Contreras A, et al. Targeting the interplay between epithelial-to-mesenchymal-transition and the immune system for effective immunotherapy. Cancers (Basel). 2019; 11:714. https://doi.org/10.3390/cancers11050714 [PubMed]
- 47. Zhuang H, Huang S, Zhou Z, Ma Z, Zhang Z, Zhang C, Hou B. A four prognosis-associated lncRNAs (PALnc) based risk score system reflects immune cell infiltration and predicts patient survival in pancreatic cancer. Cancer Cell Int. 2020; 20:493. https://doi.org/10.1186/s12935-020-01588-y [PubMed]
- 48. Zhuang H, Zhang C, Hou B. GTF2IRD1 overexpression promotes tumor progression and correlates with less CD8+ T cells infiltration in pancreatic cancer. Biosci Rep. 2020; 40:BSR20202150. https://doi.org/10.1042/BSR20202150 [PubMed]
- 49. Zhou T, Li Y, Yang L, Liu L, Ju Y, Li C. Silencing of ANXA3 expression by RNA interference inhibits the proliferation and invasion of breast cancer cells. Oncol Rep. 2017; 37:388–98. https://doi.org/10.3892/or.2016.5251 [PubMed]
- 50. Shi W, Zhang C, Ning Z, Hua Y, Li Y, Chen L, Liu L, Chen Z, Meng Z. Long non-coding RNA LINC00346 promotes pancreatic cancer growth and gemcitabine resistance by sponging miR-188-3p to derepress BRD4 expression. J Exp Clin Cancer Res. 2019; 38:60. https://doi.org/10.1186/s13046-019-1055-9 [PubMed]
- 51. Ji D, Hu G, Zhang X, Yu T, Yang J. Long non-coding RNA DSCAM-AS1 accelerates the progression of hepatocellular carcinoma via sponging miR-338-3p. Am J Transl Res. 2019; 11:4290–302. [PubMed]
- 52. Li Y, Fu SY, Wang LH, Wang FY, Wang NN, Cao Q, Wang YT, Yang JY, Wu CF. Copper improves the anti-angiogenic activity of disulfiram through the EGFR/Src/VEGF pathway in gliomas. Cancer Lett. 2015; 369:86–96. https://doi.org/10.1016/j.canlet.2015.07.029 [PubMed]
- 53. Zhuang H, Zhang C, Hou B. FAM83H overexpression predicts worse prognosis and correlates with less CD8+ T cells infiltration and Ras-PI3K-Akt-mTOR signaling pathway in pancreatic cancer. Clin Transl Oncol. 2020; 22:2244–52. https://doi.org/10.1007/s12094-020-02365-z [PubMed]
- 54. Bindea G, Mlecnik B, Tosolini M, Kirilovsky A, Waldner M, Obenauf AC, Angell H, Fredriksen T, Lafontaine L, Berger A, Bruneval P, Fridman WH, Becker C, et al. Spatiotemporal dynamics of intratumoral immune cells reveal the immune landscape in human cancer. Immunity. 2013; 39:782–95. https://doi.org/10.1016/j.immuni.2013.10.003 [PubMed]
- 55. Zhuang H, Zhou Z, Ma Z, Li Z, Liu C, Huang S, Zhang C, Hou B. Characterization of the prognostic and oncologic values of ITGB superfamily members in pancreatic cancer. J Cell Mol Med. 2020. [Epub ahead of print]. https://doi.org/10.1111/jcmm.15990 [PubMed]
- 56. Schalper KA, Carvajal-Hausdorf D, McLaughlin J, Altan M, Velcheti V, Gaule P, Sanmamed MF, Chen L, Herbst RS, Rimm DL. Differential expression and significance of PD-L1, IDO-1, and B7-H4 in human lung cancer. Clin Cancer Res. 2017; 23:370–78. https://doi.org/10.1158/1078-0432.CCR-16-0150 [PubMed]