


Introduction
The clinical manifestations of patients with acute myocardial infarction (AMI) are different than other forms of cardiovascular disease and may include non-fatal ischemic events, and immediate and long-term risk of death [1]. Therefore, early risk stratification is essential for clinicians to choose the intensity of treatment by a risk assessment of individual patients [2].
Simple and well-validated tools play a pivotal role in predicting future events in the clinical practice, especially when deciding on the primary prevention and treatment for AMI patients. For example, the Global Registry of Acute Coronary Events (GRACE) risk score [3] is a reliable method for predicting adverse clinical events, including mortality and other major adverse cardiovascular events (MACE), improving prognosis and risk reclassification. However, little progress has been made to enhance the effectiveness of prognostic tools by combining new cardiac risk factors.
The primary purpose of this study was to develop and verify a robust prognostic model named Changzhou-AMI model (C-AMI), in predicting the 30-day and 1-year mortality of AMI patients. Our nomogram showed a potential advantage of predictive performance as compared with the GRACE risk score.
Results
Clinical characteristics of patients
The clinical characteristics of the training cohort and the validation cohort are shown in Table 1. The mean age of 534 patients (69.5% male) was 68.3 ± 13.9 years in the training cohort, whereas the mean age of 386 patients (74.4% male) was 65.6 ± 13.3 years in the validation cohort. The 386 individuals in the validation cohort were slightly younger, with a lower prevalence of hypertension, diabetes and greater prevalence of smoking and alcohol intake. In the training group, there was a higher prevalence of patients with ST-segment elevation myocardial infarction (STEMI), and more patients received PCI therapy. The median follow-up was 375 days (IQR: 371 - 402) for the training cohort. And the median follow-up for the validation cohort was 390 days (IQR: 376 - 406). There were 69 deaths occurred in the training cohort and 32 deaths occurred in the validation cohort, respectively.
Table 1. Basic clinical and procedural characteristics.
| Variables | Total sample (n = 920) | Derivation cohort (n = 534) | Validation cohort (n = 386) | P value | |||||||||||||||||||||||||||||||||||||||||||||||||||||||||||||||||||||||||||||||||||||||||||||||
| Demographics | |||||||||||||||||||||||||||||||||||||||||||||||||||||||||||||||||||||||||||||||||||||||||||||||||||
| Male, n (%) | 658(71.5) | 371(69.5) | 287(74.4) | 0.123 | |||||||||||||||||||||||||||||||||||||||||||||||||||||||||||||||||||||||||||||||||||||||||||||||
| Age, y | 67.18±13.70 | 68.33±13.86 | 65.59±13.29 | 0.003 | |||||||||||||||||||||||||||||||||||||||||||||||||||||||||||||||||||||||||||||||||||||||||||||||
| 20-29 | 4 (0.4) | 3 (0.6) | 1 (0.3) | ||||||||||||||||||||||||||||||||||||||||||||||||||||||||||||||||||||||||||||||||||||||||||||||||
| 30-39 | 26 (2.8) | 10 (1.9) | 16 (4.1) | ||||||||||||||||||||||||||||||||||||||||||||||||||||||||||||||||||||||||||||||||||||||||||||||||
| 40-49 | 105 (11.4) | 68 (12.7) | 37 (9.6) | ||||||||||||||||||||||||||||||||||||||||||||||||||||||||||||||||||||||||||||||||||||||||||||||||
| 50-59 | 144 (15.7) | 69 (12.9) | 75 (19.4) | ||||||||||||||||||||||||||||||||||||||||||||||||||||||||||||||||||||||||||||||||||||||||||||||||
| 60-69 | 228 (24.8) | 113 (21.2) | 115 (29.8) | ||||||||||||||||||||||||||||||||||||||||||||||||||||||||||||||||||||||||||||||||||||||||||||||||
| 70-79 | 249 (27.1) | 158 (29.6) | 91 (23.6) | ||||||||||||||||||||||||||||||||||||||||||||||||||||||||||||||||||||||||||||||||||||||||||||||||
| 80-89 | 154 (16.7) | 106 (19.9) | 48 (12.4) | ||||||||||||||||||||||||||||||||||||||||||||||||||||||||||||||||||||||||||||||||||||||||||||||||
| ≥90 | 10 (1.1) | 7 (1.3) | 3 (0.8) | ||||||||||||||||||||||||||||||||||||||||||||||||||||||||||||||||||||||||||||||||||||||||||||||||
| SBP, mmHg | 130.23±24.47 | 134.56±26.27 | 124.25±20.30 | <0.001 | |||||||||||||||||||||||||||||||||||||||||||||||||||||||||||||||||||||||||||||||||||||||||||||||
| DBP, mmHg | 79.45±17.25 | 78.22±16.37 | 81.16±18.29 | 0.011 | |||||||||||||||||||||||||||||||||||||||||||||||||||||||||||||||||||||||||||||||||||||||||||||||
| HR, bpm | 81.98±17.26 | 82.26±17.80 | 81.60±16.49 | 0.566 | |||||||||||||||||||||||||||||||||||||||||||||||||||||||||||||||||||||||||||||||||||||||||||||||
| History Variables, n (%) | |||||||||||||||||||||||||||||||||||||||||||||||||||||||||||||||||||||||||||||||||||||||||||||||||||
| Hypertension | 601(65.3) | 381(71.3) | 220(57.0) | <0.001 | |||||||||||||||||||||||||||||||||||||||||||||||||||||||||||||||||||||||||||||||||||||||||||||||
| Diabetes mellitus | 244(26.5) | 156(29.2) | 88(22.8) | 0.036 | |||||||||||||||||||||||||||||||||||||||||||||||||||||||||||||||||||||||||||||||||||||||||||||||
| Current smoker | 460(50) | 251(47.0) | 209(54.1) | 0.038 | |||||||||||||||||||||||||||||||||||||||||||||||||||||||||||||||||||||||||||||||||||||||||||||||
| Alcohol intake | 111(12.1) | 52(9.7) | 59(15.3) | 0.014 | |||||||||||||||||||||||||||||||||||||||||||||||||||||||||||||||||||||||||||||||||||||||||||||||
| Laboratory findings | |||||||||||||||||||||||||||||||||||||||||||||||||||||||||||||||||||||||||||||||||||||||||||||||||||
| WBC, 109/L | 9.57±3.69 | 9.77±3.86 | 9.29±3.44 | 0.051 | |||||||||||||||||||||||||||||||||||||||||||||||||||||||||||||||||||||||||||||||||||||||||||||||
| Neutrophil ratio (%) | 76.32±11.45 | 77.80±9.88 | 74.28±13.07 | <0.001 | |||||||||||||||||||||||||||||||||||||||||||||||||||||||||||||||||||||||||||||||||||||||||||||||
| Hemoglobin, g/L | 131.85±21.05 | 129.69±20.30 | 134.84±19.33 | <0.001 | |||||||||||||||||||||||||||||||||||||||||||||||||||||||||||||||||||||||||||||||||||||||||||||||
| Serum creatinine, mmol/L | 95.15±56.51 | 107.23±66.69 | 78.43±31.35 | <0.001 | |||||||||||||||||||||||||||||||||||||||||||||||||||||||||||||||||||||||||||||||||||||||||||||||
| eGFR, mL/min/1.73m2 | 69.69±28.13 | 61.60±26.30 | 80.90±26.73 | <0.001 | |||||||||||||||||||||||||||||||||||||||||||||||||||||||||||||||||||||||||||||||||||||||||||||||
| HDL-C, mmol/L | 1.18±0.39 | 1.23±0.39 | 1.12±0.38 | <0.001 | |||||||||||||||||||||||||||||||||||||||||||||||||||||||||||||||||||||||||||||||||||||||||||||||
| LDL-C, mmol/L | 2.44±0.81 | 2.41±0.77 | 2.49±0.86 | 0.157 | |||||||||||||||||||||||||||||||||||||||||||||||||||||||||||||||||||||||||||||||||||||||||||||||
| BNP | 2160(431,4402) | 2225(491,4313) | 1769(386,4431) | 0.26 | |||||||||||||||||||||||||||||||||||||||||||||||||||||||||||||||||||||||||||||||||||||||||||||||
| Troponin I | 2.01(0.52,8.04) | 1.51(0.48,4.51) | 3.83(0.62,14.98) | <0.001 | |||||||||||||||||||||||||||||||||||||||||||||||||||||||||||||||||||||||||||||||||||||||||||||||
| Outcomes | |||||||||||||||||||||||||||||||||||||||||||||||||||||||||||||||||||||||||||||||||||||||||||||||||||
| 30-day mortality | 70 (7.6) | 49 (9.2) | 21 (5.4) | 0.047 | |||||||||||||||||||||||||||||||||||||||||||||||||||||||||||||||||||||||||||||||||||||||||||||||
| 1-year mortality | 101 (11.0) | 69 (12.9) | 32 (8.3) | 0.035 | |||||||||||||||||||||||||||||||||||||||||||||||||||||||||||||||||||||||||||||||||||||||||||||||
| Angiographic and Procedural Characteristics | |||||||||||||||||||||||||||||||||||||||||||||||||||||||||||||||||||||||||||||||||||||||||||||||||||
| STEMI | 752(81.7) | 465(87.1) | 287(74.4) | <0.001 | |||||||||||||||||||||||||||||||||||||||||||||||||||||||||||||||||||||||||||||||||||||||||||||||
| Number of Stent | 0.005 | ||||||||||||||||||||||||||||||||||||||||||||||||||||||||||||||||||||||||||||||||||||||||||||||||||
| 0 (CAG only) | 215(23.4) | 107(20.0) | 108(28.0) | ||||||||||||||||||||||||||||||||||||||||||||||||||||||||||||||||||||||||||||||||||||||||||||||||
| 1 | 588(63.9) | 345(64.6) | 243(63.0) | ||||||||||||||||||||||||||||||||||||||||||||||||||||||||||||||||||||||||||||||||||||||||||||||||
| 2 | 71(7.7) | 42(7.9) | 29(7.5) | ||||||||||||||||||||||||||||||||||||||||||||||||||||||||||||||||||||||||||||||||||||||||||||||||
| 3 | 46(5.0) | 40(7.5) | 6(1.6) | ||||||||||||||||||||||||||||||||||||||||||||||||||||||||||||||||||||||||||||||||||||||||||||||||
| PCI | 708(77.0) | 427(80.0) | 278(72.0) | 0.005 | |||||||||||||||||||||||||||||||||||||||||||||||||||||||||||||||||||||||||||||||||||||||||||||||
| Data are expressed as mean ± SD, n (%) or median (IQR). Abbreviations: SBP: systolic blood pressure; DBP: diastolic blood pressure; HR: heart rate; WBC: white blood cell, eGFR: estimated glomerular filtration rate (mL/min/1.73m2), HDL-C: High-density lipoprotein cholesterol, LDL-C: Low-density lipoprotein cholesterol, BNP: B-type natriuretic peptide, TNI: troponin I, STEMI: ST segment elevation myocardial infarction, PCI: percutaneous coronary intervention. | |||||||||||||||||||||||||||||||||||||||||||||||||||||||||||||||||||||||||||||||||||||||||||||||||||
Nomogram prediction of all-cause mortality
The C-index for the final analysis was used to estimate and compare different variables. log-rank test was used for comparison. Variables that achieved significant P < 0.05 were entered into the multivariable Cox regression analyses. A final model was selected using a backward step-down process [4, 5]. The final model included six predictors as follows, age, estimated glomerular filtration rate (eGFR), SBP, heart rate (HR), brain natriuretic peptide (BNP), and cardiac troponin I (TNI). Hazard ratios (HR) of the predictors for 1-year mortality were calculated and listed in Table 2.
Table 2. Univariable analysis and cox proportional hazards regression analysis.
| Variable | Univa-riable P | Multivariable Analysis | Selected Predictors for Building the Model | ||||||||||||||||||||||||||||||||||||||||||||||||||||||||||||||||||||||||||||||||||||||||||||||||
| Hazard Ratio | 95% CI | P value | Hazard Ratio | 95% CI | P value | ||||||||||||||||||||||||||||||||||||||||||||||||||||||||||||||||||||||||||||||||||||||||||||||
| lower limit | upper limit | lower limit | upper limit | ||||||||||||||||||||||||||||||||||||||||||||||||||||||||||||||||||||||||||||||||||||||||||||||||
| Age, years | 0.004 | 0.080 | 0.043 | ||||||||||||||||||||||||||||||||||||||||||||||||||||||||||||||||||||||||||||||||||||||||||||||||
| ≤ 50 | Reference | ||||||||||||||||||||||||||||||||||||||||||||||||||||||||||||||||||||||||||||||||||||||||||||||||||
| 50-80 | 0.256 | 0.058 | 1.137 | 0.073 | 0.239 | 0.054 | 1.046 | 0.057 | |||||||||||||||||||||||||||||||||||||||||||||||||||||||||||||||||||||||||||||||||||||||||||
| > 80 | 0.588 | 0.327 | 1.057 | 0.076 | 0.572 | 0.323 | 1.013 | 0.056 | |||||||||||||||||||||||||||||||||||||||||||||||||||||||||||||||||||||||||||||||||||||||||||
| eGFR, mL/min/1.73m2 | < 0.001 | 0.008 | 0.002 | ||||||||||||||||||||||||||||||||||||||||||||||||||||||||||||||||||||||||||||||||||||||||||||||||
| < 30 | Reference | ||||||||||||||||||||||||||||||||||||||||||||||||||||||||||||||||||||||||||||||||||||||||||||||||||
| ≥ 30 | 1.491 | 1.109 | 2.005 | 0.008 | 1.546 | 1.171 | 2.041 | 0.002 | |||||||||||||||||||||||||||||||||||||||||||||||||||||||||||||||||||||||||||||||||||||||||||
| BNP, | < 0.001 | < 0.001 | < 0.001 | ||||||||||||||||||||||||||||||||||||||||||||||||||||||||||||||||||||||||||||||||||||||||||||||||
| ≤1000 | Reference | ||||||||||||||||||||||||||||||||||||||||||||||||||||||||||||||||||||||||||||||||||||||||||||||||||
| 1000-30000 | 0.127 | 0.045 | 0.359 | < 0.001 | 0.115 | 0.044 | 0.303 | < 0.001 | |||||||||||||||||||||||||||||||||||||||||||||||||||||||||||||||||||||||||||||||||||||||||||
| > 30000 | 0.200 | 0.084 | 0.472 | < 0.001 | 0.185 | 0.083 | 0.412 | < 0.001 | |||||||||||||||||||||||||||||||||||||||||||||||||||||||||||||||||||||||||||||||||||||||||||
| TNI, | < 0.001 | < 0.001 | < 0.001 | ||||||||||||||||||||||||||||||||||||||||||||||||||||||||||||||||||||||||||||||||||||||||||||||||
| ≤ 1 | Reference | ||||||||||||||||||||||||||||||||||||||||||||||||||||||||||||||||||||||||||||||||||||||||||||||||||
| 1-10 | 0.117 | 0.055 | 0.246 | < 0.001 | 0.121 | 0.058 | 0.252 | < 0.001 | |||||||||||||||||||||||||||||||||||||||||||||||||||||||||||||||||||||||||||||||||||||||||||
| > 10 | 0.145 | 0.072 | 0.289 | < 0.001 | 0.148 | 0.076 | 0.291 | < 0.001 | |||||||||||||||||||||||||||||||||||||||||||||||||||||||||||||||||||||||||||||||||||||||||||
| HR, bpm | < 0.001 | < 0.001 | < 0.001 | ||||||||||||||||||||||||||||||||||||||||||||||||||||||||||||||||||||||||||||||||||||||||||||||||
| ≤100 | Reference | ||||||||||||||||||||||||||||||||||||||||||||||||||||||||||||||||||||||||||||||||||||||||||||||||||
| >100 | 0.325 | 0.195 | 0.542 | < 0.001 | 0.326 | 0.196 | 0.542 | < 0.001 | |||||||||||||||||||||||||||||||||||||||||||||||||||||||||||||||||||||||||||||||||||||||||||
| SBP, mmHg | < 0.001 | < 0.001 | 0.001 | ||||||||||||||||||||||||||||||||||||||||||||||||||||||||||||||||||||||||||||||||||||||||||||||||
| ≤ 100 | Reference | ||||||||||||||||||||||||||||||||||||||||||||||||||||||||||||||||||||||||||||||||||||||||||||||||||
| 100-180 | 10.163 | 1.257 | 82.191 | 0.030 | 9.114 | 1.162 | 71.498 | 0.035 | |||||||||||||||||||||||||||||||||||||||||||||||||||||||||||||||||||||||||||||||||||||||||||
| > 180 | 2.935 | 0.394 | 21.865 | 0.293 | 2.720 | 0.371 | 19.937 | 0.325 | |||||||||||||||||||||||||||||||||||||||||||||||||||||||||||||||||||||||||||||||||||||||||||
| WBC, 109/L | 0.084 | ||||||||||||||||||||||||||||||||||||||||||||||||||||||||||||||||||||||||||||||||||||||||||||||||||
| ≤10 | |||||||||||||||||||||||||||||||||||||||||||||||||||||||||||||||||||||||||||||||||||||||||||||||||||
| >10 | |||||||||||||||||||||||||||||||||||||||||||||||||||||||||||||||||||||||||||||||||||||||||||||||||||
| LDL-C, mmol/L | 0.914 | ||||||||||||||||||||||||||||||||||||||||||||||||||||||||||||||||||||||||||||||||||||||||||||||||||
| ≤3.4 | |||||||||||||||||||||||||||||||||||||||||||||||||||||||||||||||||||||||||||||||||||||||||||||||||||
| >3.4 | |||||||||||||||||||||||||||||||||||||||||||||||||||||||||||||||||||||||||||||||||||||||||||||||||||
| Hemoglobin, g/L | 0.002 | 0.926 | |||||||||||||||||||||||||||||||||||||||||||||||||||||||||||||||||||||||||||||||||||||||||||||||||
| ≤90 | Reference | ||||||||||||||||||||||||||||||||||||||||||||||||||||||||||||||||||||||||||||||||||||||||||||||||||
| >90 | 0.962 | 0.427 | 2.170 | 0.926 | |||||||||||||||||||||||||||||||||||||||||||||||||||||||||||||||||||||||||||||||||||||||||||||||
| Gender | 0.389 | ||||||||||||||||||||||||||||||||||||||||||||||||||||||||||||||||||||||||||||||||||||||||||||||||||
| Hypertension | 0.201 | ||||||||||||||||||||||||||||||||||||||||||||||||||||||||||||||||||||||||||||||||||||||||||||||||||
| Diabetes mellitus | 0.047 | 1.083 | 0.632 | 1.857 | 0.772 | ||||||||||||||||||||||||||||||||||||||||||||||||||||||||||||||||||||||||||||||||||||||||||||||
| Current smoker | 0.014 | 0.839 | 0.475 | 1.482 | 0.545 | ||||||||||||||||||||||||||||||||||||||||||||||||||||||||||||||||||||||||||||||||||||||||||||||
| Alcohol intake | 0.701 | ||||||||||||||||||||||||||||||||||||||||||||||||||||||||||||||||||||||||||||||||||||||||||||||||||
| * HR: heart rate; SBP: systolic blood pressure; eGFR: estimated glomerular filtration rate (mL/min/1.73m2); BNP: B-type natriuretic peptide; TNI: troponin I; CI, confidence interval; WBC, white blood cell count; LDL-C, Low-density lipoprotein cholesterol. | |||||||||||||||||||||||||||||||||||||||||||||||||||||||||||||||||||||||||||||||||||||||||||||||||||
Kaplan-Meier survival curves of 1-year mortality for each predictor are illustrated in Figure 1. The survival curves showed that there were significant differences in survival of each subgroup (all P < 0.05). Then, these variables were also used to create nomograms for estimating the probability of 30-day and 1-year mortality (Figure 2). The final nomogram model was named as Changzhou AMI (for short, C-AMI) model.
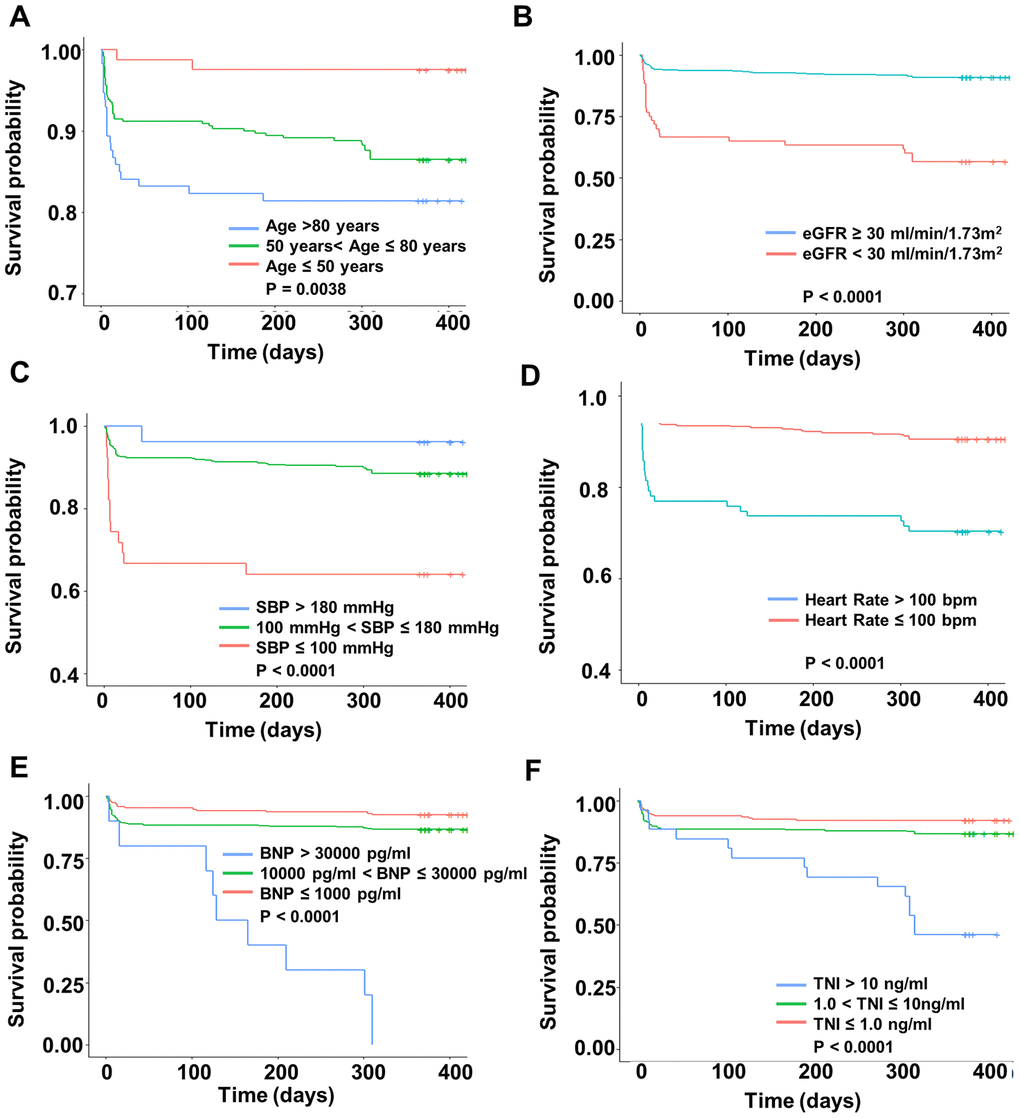
Figure 1. Kaplan-Meier survival curves of 1-year survival according to six predictors. The x-axis represents the time and the y-axis represents the overall survival in different subgroups. (A) age, (B) eGFR, (C) Systolic Blood Pressure, (D) heart rate, (E) BNP, and (F) Troponin I.
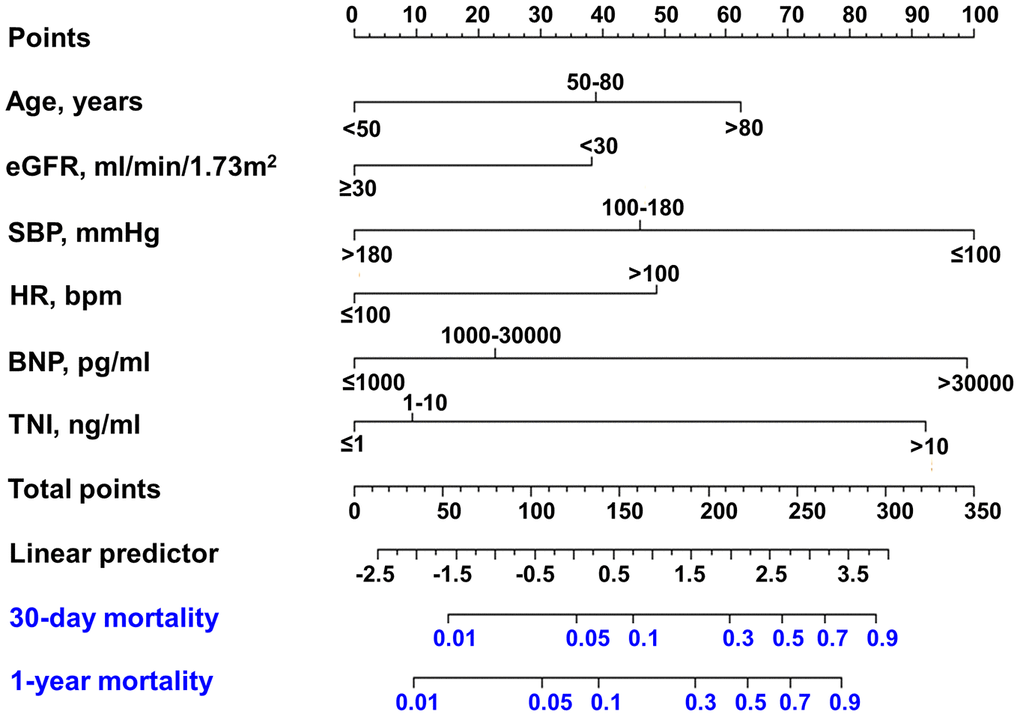
Figure 2. Nomogram developed for predicting 30-day mortality and 1-year mortality. Nomogram for 30-day mortality of AMI patients. The first row: point assignment of the variables; the second to seventh rows: six predictors; the eighth row: total points of six predictors; the ninth row: linear predictor; the tenth row: risk of 30-day mortality; and the eleventh row: risk of 1-year mortality.
Calibration and discrimination and of nomograms
For nomogram model of 30-day mortality, calibration curves of the training group and the validation group were shown in Figure 3A and 3C. And for nomogram model of 1-year mortality, the calibration curves of the training cohort and the validation cohort were shown in Figure 3B and 3D. Together, these results suggest a good fit for our model.
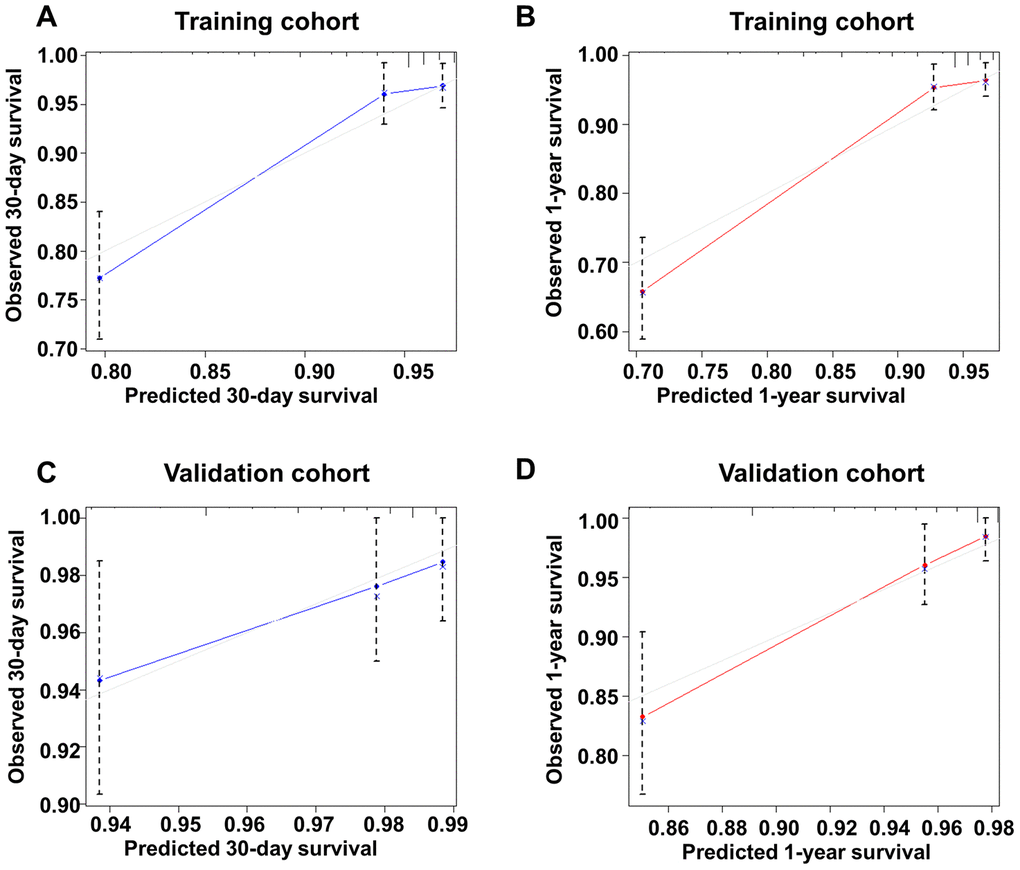
Figure 3. Calibration curve of the new model for predicting 30-day and 1-year mortality in the training group and the validation group. (A) Calibration curve of the new model for predicting 30-day in the training group. (B) Calibration curve of the new model for predicting 1-year in the training group. (C) Calibration curve of the new model for predicting 30-day in the validation group. (D) Calibration curve of the new model for predicting 1-year mortality in the validation group.
The C-index for the final 30-day mortality generated by bootstrap validations was 0.788 (95% CI: 0.729 - 0.847) in the training group and 0.696 (95% CI: 0.568 - 0.824) in the validation group. Moreover, the C-index for 1-year mortality in the training group and the validation cohort was 0.826 (95%CI: 0.780 - 0.872) and 0.775 (95%CI: 0.695 - 0.855), respectively (Figure 4). C-index of GRACE risk score for 30-day mortality was 0.762 (95% CI: 0.698 - 0.826) and for 1-year mortality was 0.722 (0.662 - 0.782) in training group. These results showed a good discrimination of the nomogram models.
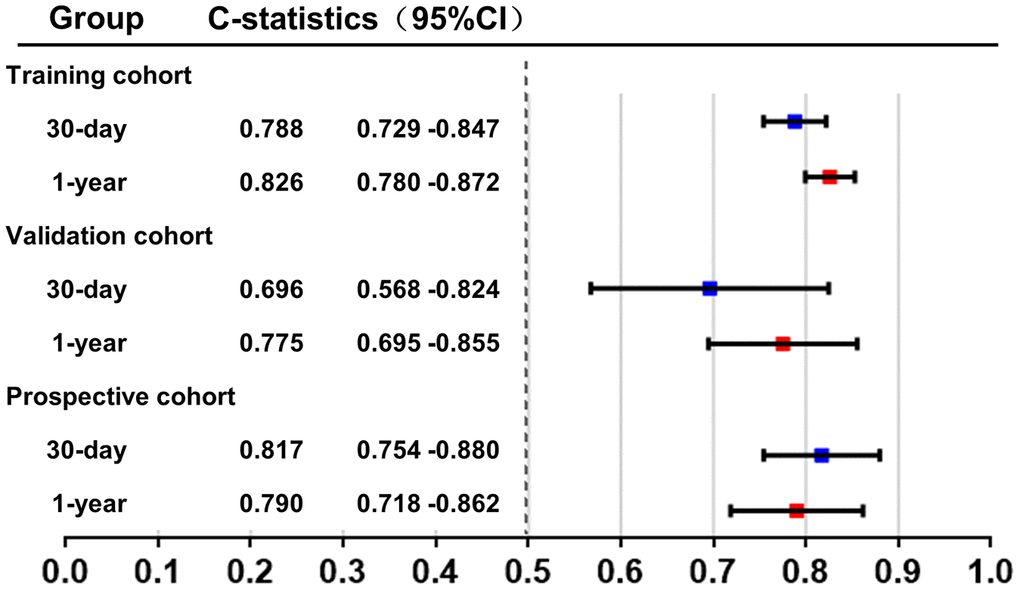
Figure 4. C-index of the new model in the training group and the validation group. C-index was calculated to evaluate the discrimination of the model and illustrated in this figure.
Comparisons between the risk predicted by the C-AMI model and that predicted by the GRACE score
In the training cohort, we also calculated the GRACE score of each patient, and then made comparisons between the risk estimated by our C-AMI model and that by the GRACE score. First, net reclassification improvement (NRI) was calculated in the training cohort. Based on the previous studies [6], we used 10% and 30% as thresholds to define the risk grade of patients at low (<10%), intermediate (10 - 30%), and high risk (>30%), C-AMI model achieved an NRI of 23.5% as compared with the GRACE risk score (<10% as low risk, 10 - 30% as moderate risk, and 30% as highest risk) for predicting 30-day mortality (Figure 5A). In 49 patients with events within 30 days, 14 patients were correctly reclassified into a higher risk category by C-AMI model. On the other hand, 6 patients out of 49 were incorrectly reclassified to lower risk categories by GRACE risk score. Moreover, C-AMI model achieved an NRI of 36.9% as compared with the GRACE risk score for predicting 1-year mortality (Figure 5B). In 69 patients with events within 1 year, 27 patients out of 69 were correctly reclassified into a higher risk category by C-AMI model. On the other hand, 13 patients out of 69 were incorrectly reclassified to lower risk categories by GRACE risk score. The integrated discrimination improvement (IDI) are also listed in Figure 5. IDI showed a significant improvement in the accuracy generated by the C-AMI model when compared with the GRACE score. These results indicate that C-AMI model has better performance in predicting mortality than GRACE score.
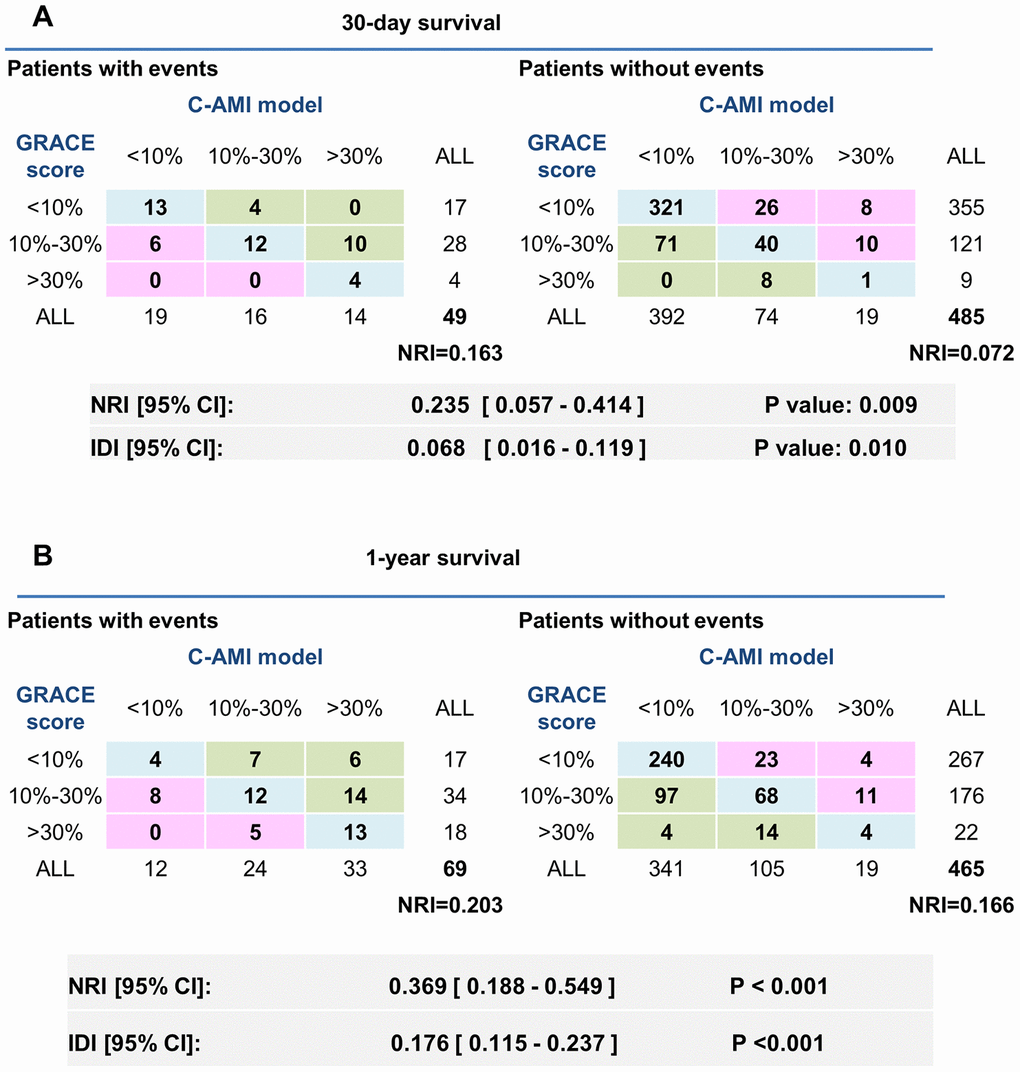
Figure 5. Comparison in predicting 30-day and 1-year mortality between the C-AMI model and the GRACE score. (A) NRI was calculated in the training cohort. We used 10% and 30% as thresholds to define patients at low (<10%), intermediate (10–30%), and high risk (>30%). IDI were also listed above. (B) NRI and IDI of the new model comparing with GRACE risk score for predicting 1-year mortality.
When C-AMI model was combined with GRACE risk score, the increase in prognostic power was paralleled by a huge increase in NRI (NRI for 30-day mortality: 37.3%; NRI for 1-years mortality: 66.1%) (Figure 6). These results were also confirmed by calculating IDI (12.2% for 30-day mortality; 23.4% for 1-year mortality). These results show that incorporating C-AMI model into GRACE risk score can significantly improve the predicting ability in patients with AMI.
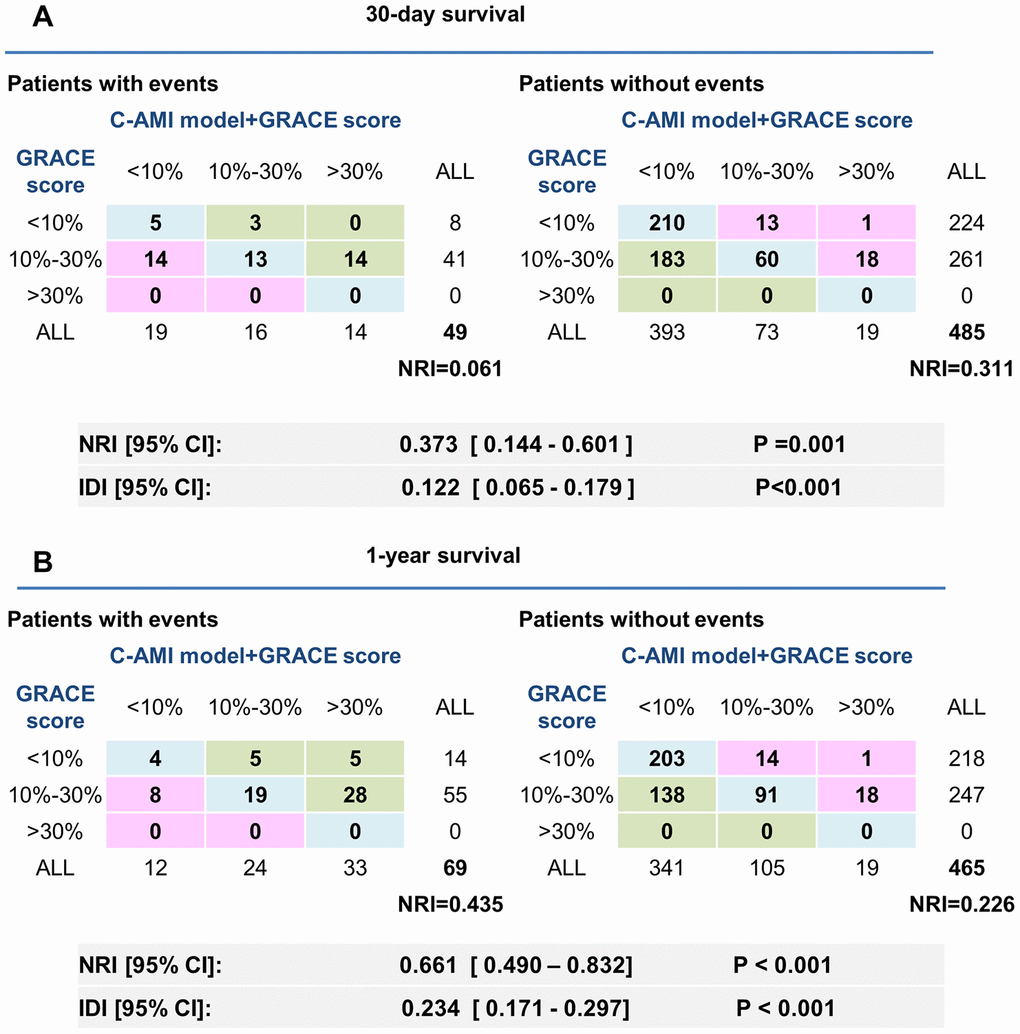
Figure 6. Adjustment of the GRACE score by C-AMI model enables a more accurate appreciation of risk stratification in AMI patients. (A, B) Reclassification ability of C-AMI model and GRACE score for 30-day (A) and 1-year mortality (B). NRI and IDI were calculated.
Sensitive analysis
A prospective cohort of 309 AMI patients (age 66.70 ± 14.43 years, 68.6% male) was used to further validate our nomogram model. The cohort was formed up with 159 patients from center-hospital area and 150 patients from yang-hu area. The C-index in this new cohort was 0.817 (95%CI: 0.754 - 0.880) for 30-day mortality and 0.790 (95%CI: 0.718 - 0.863) for 1-year mortality (Figure 4). These results confirm good discrimination of the model. The calibration curves of this new cohort were listed in Figure 7.
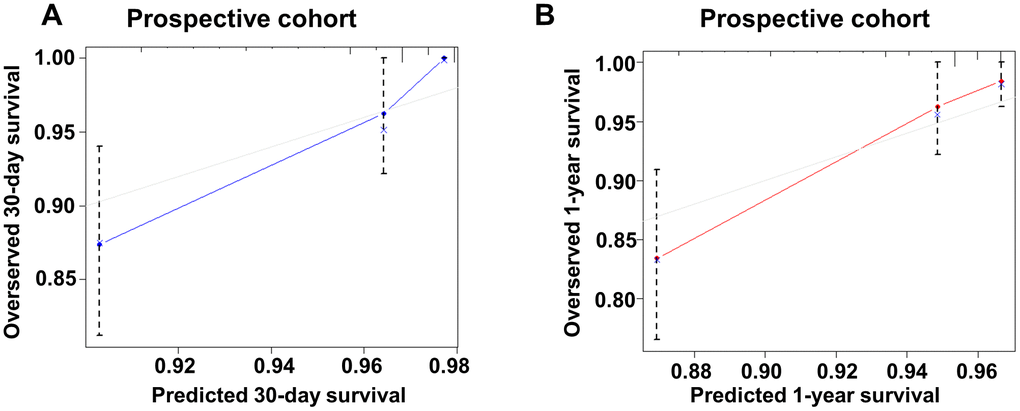
Figure 7. Calibration curve of the new model for predicting 30-day and 1-year mortality in prospective cohort. (A) Calibration curve of the new model for predicting 30-day in prospective group. (B) Calibration curve of the new model for predicting 1-year in prospective group.
Discussion
The purpose of this investigation was to develop and verify a robust prognostic model to predict 30-day and 1-year mortality of AMI patients. We tested the hypothesis that the model developed herein would exceed the prediction fidelity of the GRACE score.
This investigation established a simple-to-use nomogram to predict 30-day and 1-year mortality in AMI patients. The nomogram was developed from 534 individuals and was validated as an illustrated model for predicting mortality in AMI patients. We also validated this new model in another prospective cohort. The results indicated that C-AMI model has good discrimination and calibration in the new cohort. Nomogram model was used for illustrating our model because nomogram is an useful tool of graphically representing the model into a graph through mathematical formula [7–10]. It is easy to calculate the risk of the occurrence of the final event by summation of the corresponding points of each variable. Thus, nomogram model is more intuitive and simpler, and is widely used in the prediction and evaluation of overall survival in patients. Meanwhile, clinicians can also quickly carry out risk stratification in the emergency room with the help of nomogram to identify patients with AMI at high risk of death. Thus, the nomogram of C-AMI model may serve as a valuable tool for clinical practice, providing up to 1-year risk counseling for AMI patients and guidance on preventive treatment for patients with a high risk of mortality. However, further clinical studies should be conducted to assess the effectiveness of preventive, therapeutic strategies based on this model.
AMI is a common severe disease, causing a tremendous medical burden on patients, their families, and the society. Early assessment of the prognosis of the disease is particularly critical [11, 12]. In this study, we constructed a predictive model for 30-day and 1-year mortality in AMI patients receiving interventional therapy. A nomogram was developed for clinicians to assess preoperatively short-term prognosis of the disease, and further provide guidance on early preventive measures. Our model included 6 variables: age, TNI, eGFR, SBP, heart rate, and BNP as primary predictors. These variables are easy to obtain in the early stage of admission, so that it is more convenient for clinicians to use and carry out early risk assessment.
Also, we compared our model with the GRACE score. The GRACE score includes eight predictors [3], including age, heart rate, blood pressure, serum creatinine level, Killip grade [13], pre-hospital cardiac arrest, ST segment depression, and increased myocardial enzymes. Granger et al [14] confirmed that the GRACE model had a good predictive value for mortality in patients with the acute coronary syndrome (ACS), which is commonly associated with three clinical manifestations: STEMI, non-ST elevation myocardial infarction (NSTEMI), or unstable angina. Consistent with the GRACE score, our prediction model showed that age, heart rate and SBP were independent predictors, being closely related to prognosis of AMI. In contrast, some variables were changed in our model. First, we included eGFR but not creatinine levels since the former reflects the renal function of patients more accurately without the influence of gender and weight. Second, Killip classification was not included in our model due to the presence of subjective bias. Third, we added BNP reflecting the cardiac function which was closely related to the prognosis of acute myocardial infarction [15]. Fourth, we included the level of TNI but not myocardial enzymogram as predictors because the level of TNI has greater specificity for myocardial injury. Finally, two risk factors included in the GRACE score (prehospital cardiac arrest and ST segment suppression) were not included in our model, as they did not improve the predictive value of our model and unnecessarily increased its complexity.
We found that there was a slight improvement between the C-AMI model and the GRACE scores in predicting 30-days mortality. But we found that our model appeared to be superior to the GRACE score in predicting 1-year mortality. Previous studies have reported that GRACE score combined with other biomarkers, such as GDF15, will further improve the accuracy of prediction ability [16]. We also found that when C-AMI model was combined with GRACE score, the value in risk stratification of AMI patients was significantly improved. The combination of the two models is more conducive to distinguish those high-risk AMI patients from the population, so as to take preventive measures in advance and reduce the mortality rate.
Limitations
Our study has several limitations, mainly due to the characteristics of our database. Firstly, some new biomarkers for the prognosis of patients with AMI, such as growth differentiation factor (GDF-15) [17–20], high-sensitive troponin T, copeptin, soluble suppression of tumorigenicity 2(sST2) [18], were not taken into account in our model. Secondly, the model was developed and validated based on patients in two branches of our hospital, suggesting the presence of geographical limitations. In addition, it is necessary to confirm and modify our model in an independent external database with larger sample size. The model developed herein also only utilized six risk factors assessed at admission, which excludes the influence of other, potentially relevant factors. Thirdly, although our model calibrated well both in the development cohort and in two validation cohorts, the confidence intervals of lowest survival rate in predicted probability did not include the actual observed probability in both training and validation group. Finally, the dynamic change of some variables, especially biomarkers, in the course of the disease would lead to the change of important clinical information, influencing the prognostic evaluation. Therefore, how to integrate the dynamic change of variables into our model requires further investigation [21].
Conclusions
In summary, this investigation developed a C-AMI model to predict short-term mortality in AMI patients. The model included six risk factors that are directly obtained and routinely collected in clinical practice. In the population utilized herein, the predictive value based on this C-AMI model was superior to the GRACE score. Moreover, due to fewer variables involved, our C-AMI model is a simple and easy-to-use means of predicting short-term prognosis in AMI patients.
Materials and Methods
Ethical statements
Protocol approval was received from the institution review board at Changzhou No.2 People’s hospital. This study was approved by Changzhou No.2 People’s Hospital ethics committee. This Trial was registered in the Chinese clinical trials registry: ChiCTR1800014583. (http://www.chictr.org.cn/searchproj.aspx).
Study population
The study population is partly based on Changzhou acute myocardial infarction registry (CZ-AMI) described before [22]. Briefly, CZ-AMI registry was a retrospective study of the risk of acute kidney injury in AMI patients from two single centers between 2013 and 2017. AMI was diagnosed according to the third universal definition of myocardial infarction [23].
Totally 1229 eligible patients were enrolled in this cohort study. C-AMI model was developed based on the training cohort (534 patients from a single center named center-hospital area) and tested it in the validation cohort (386 patients from another single center named yang-hu hospital area). Moreover, a prospective cohort of 309 patients were enrolled for further validation of the nomogram-based model. The study flow chart was included in supplementary information (Supplementary Figure 1).
Data collection
The blood samples of hospitalized patients were collected and analyzed immediately at admission. Lab data (e.g. white blood cell count (WBC), the ratio of neutrophils, hemoglobin, cardiac troponin I (TnI), serum creatinine, brain natriuretic peptide (BNP) and so on) were collected. All biochemical measurements were carried out in standard laboratory techniques. The estimated glomerular filtration rate (eGFR) was calculated by the abbreviated MDRD equation according to the baseline serum creatinine concentration [24].
Basic clinic characteristics of enrolled patients were obtained by reviewing electronic medical records. The clinical variables such as age, gender, systolic blood pressure (SBP), diastolic blood pressure (DBP), heart rate, and a history of hypertension, diabetes mellitus, smoking, alcohol consumption and use of medication were documented.
Coronary angiography and interventional therapy
Coronary angiography (CAG) or percutaneous coronary intervention (PCI) was conducted by experienced physicians in digital subtraction angiography (DSA) room. The procedural data were also collected.
Follow-up and outcomes
The primary outcome of our study was 1-year all-cause mortality after AMI. The secondary outcome was 30-day all-cause mortality after AMI. Follow-ups were conducted by telephone, electronic medical record review and social security death index.
Statistical analysis
Continuous variables are summarized as mean ± the standard deviation (SD) or medians and interquartile-range (IQR) and were compared using student t test or Kruskal-Wallis test. Categorical variables are summarized as counts and percentages and were compared using chi-square or the Fisher exact test, as appropriate. Kaplan-Meier survival analysis was used to show associations between each predictor and mortality. The multivariable time-to-event analysis was performed using Cox proportional hazards regression models. Hazard ratio (HR) and 95% Confidence interval [CI] were calculated.
Nomograms for predicting the risk of 30-day mortality and 1-year mortality were then established by Cox regression analysis [4, 25, 26]. Validation of the nomogram was assessed by discrimination and calibration. Harrell’s C-statistic [27] was calculated to evaluate the discrimination of our nomogram model. Calibration curve was used to evaluate the goodness of fit. Furthermore, net reclassification improvement (NRI) and integrated discrimination improvement (IDI) were calculated to evaluate the improvement of our new model when compared to the GRACE score.
All analyses were performed by SPSS (version 22.0, IBM Corp. Armonk, NY, USA) and R 3.4.3 (the R Core Team; 2017 R; a programming environment for data analysis and graphic). A P-value of less than 0.05 was considered statistically significant.
Supplementary Materials
Author Contributions
L.S and Q-J.W conceived the experiments, Q.W, Z.S, W.Z, X.C, Y.L and Y.J conducted the experiments, Q-J.W, L.S and Q.W analyzed the results. All authors reviewed the manuscript.
Conflicts of Interest
The authors report no relationships that could be construed as a conflicts of interest.
Funding
This study was supported by grants from the National Natural Science Foundation of China (Grant No. 81901410), by Changzhou Sci and Tech Program (Grant No. CJ20190102) and by Young Talent Development Plan of Changzhou Health Commission (Grant No. CZQM2020060).
References
- 1. Barnett R. Acute myocardial infarction. Lancet. 2019; 393:2580. https://doi.org/10.1016/S0140-6736(19)31419-9 [PubMed]
- 2. Yan AT, Yan RT, Cantor WJ, Borgundvaag B, Cohen EA, Fitchett DH, Dzavik V, Ducas J, Tan M, Casanova A, Goodman SG, and TRANSFER-AMI Investigators. Relationship between risk stratification at admission and treatment effects of early invasive management following fibrinolysis: insights from the trial of routine ANgioplasty and stenting after fibrinolysis to enhance reperfusion in acute myocardial infarction (TRANSFER-AMI). Eur Heart J. 2011; 32:1994–2002. https://doi.org/10.1093/eurheartj/ehr008 [PubMed]
- 3. Fox KA, Goodman SG, Anderson FA
Jr , Granger CB, Moscucci M, Flather MD, Spencer F, Budaj A, Dabbous OH, Gore JM, and GRACE Investigators. From guidelines to clinical practice: the impact of hospital and geographical characteristics on temporal trends in the management of acute coronary syndromes. The global registry of acute coronary events (GRACE). Eur Heart J. 2003; 24:1414–24. https://doi.org/10.1016/s0195-668x(03)00315-4 [PubMed] - 4. Liang W, Zhang L, Jiang G, Wang Q, Liu L, Liu D, Wang Z, Zhu Z, Deng Q, Xiong X, Shao W, Shi X, He J. Development and validation of a nomogram for predicting survival in patients with resected non-small-cell lung cancer. J Clin Oncol. 2015; 33:861–69. https://doi.org/10.1200/JCO.2014.56.6661 [PubMed]
- 5. Harrell FE
Jr , Lee KL, Mark DB. Multivariable prognostic models: issues in developing models, evaluating assumptions and adequacy, and measuring and reducing errors. Stat Med. 1996; 15:361–87. https://doi.org/10.1002/(SICI)1097-0258(19960229)15:4<361::AID-SIM168>3.0.CO;2-4 [PubMed] - 6. Sun L, Zhou X, Jiang J, Zang X, Chen X, Li H, Cao H, Wang Q. Growth differentiation factor-15 levels and the risk of contrast induced nephropathy in patients with acute myocardial infarction undergoing percutaneous coronary intervention: a retrospective observation study. PLoS One. 2018; 13:e0197609. https://doi.org/10.1371/journal.pone.0197609 [PubMed]
- 7. Iasonos A, Schrag D, Raj GV, Panageas KS. How to build and interpret a nomogram for cancer prognosis. J Clin Oncol. 2008; 26:1364–70. https://doi.org/10.1200/JCO.2007.12.9791 [PubMed]
- 8. Balachandran VP, Gonen M, Smith JJ, DeMatteo RP. Nomograms in oncology: more than meets the eye. Lancet Oncol. 2015; 16:e173–80. https://doi.org/10.1016/S1470-2045(14)71116-7 [PubMed]
- 9. Karakiewicz PI, Briganti A, Chun FK, Valiquette L. Outcomes research: a methodologic review. Eur Urol. 2006; 50:218–24. https://doi.org/10.1016/j.eururo.2006.05.009 [PubMed]
- 10. Morris CK, Myers J, Froelicher VF, Kawaguchi T, Ueshima K, Hideg A. Nomogram based on metabolic equivalents and age for assessing aerobic exercise capacity in men. J Am Coll Cardiol. 1993; 22:175–82. https://doi.org/10.1016/0735-1097(93)90832-l [PubMed]
- 11. Leong DP, Joseph PG, McKee M, Anand SS, Teo KK, Schwalm JD, Yusuf S. Reducing the global burden of cardiovascular disease, part 2: prevention and treatment of cardiovascular disease. Circ Res. 2017; 121:695–710. https://doi.org/10.1161/CIRCRESAHA.117.311849 [PubMed]
- 12. Zhou M, Wang H, Zeng X, Yin P, Zhu J, Chen W, Li X, Wang L, Wang L, Liu Y, Liu J, Zhang M, Qi J, et al. Mortality, morbidity, and risk factors in China and its provinces, 1990-2017: a systematic analysis for the global burden of disease study 2017. Lancet. 2019; 394:1145–58. https://doi.org/10.1016/S0140-6736(19)30427-1 [PubMed]
- 13. Katsuki T. [Killip and forrester classifications for patients with acute myocardial infarction]. Nihon Rinsho. 2003 (Suppl 5); 61:456–59. [PubMed]
- 14. Granger CB, Goldberg RJ, Dabbous O, Pieper KS, Eagle KA, Cannon CP, Van De Werf F, Avezum A, Goodman SG, Flather MD, Fox KA, and Global Registry of Acute Coronary Events Investigators. Predictors of hospital mortality in the global registry of acute coronary events. Arch Intern Med. 2003; 163:2345–53. https://doi.org/10.1001/archinte.163.19.2345 [PubMed]
- 15. Olivier A, Girerd N, Michel JB, Ketelslegers JM, Fay R, Vincent J, Bramlage P, Pitt B, Zannad F, Rossignol P, and EPHESUS Investigators. Combined baseline and one-month changes in big endothelin-1 and brain natriuretic peptide plasma concentrations predict clinical outcomes in patients with left ventricular dysfunction after acute myocardial infarction: insights from the eplerenone post-acute myocardial infarction heart failure efficacy and survival study (EPHESUS) study. Int J Cardiol. 2017; 241:344–50. https://doi.org/10.1016/j.ijcard.2017.02.018 [PubMed]
- 16. Widera C, Pencina MJ, Meisner A, Kempf T, Bethmann K, Marquardt I, Katus HA, Giannitsis E, Wollert KC. Adjustment of the GRACE score by growth differentiation factor 15 enables a more accurate appreciation of risk in non-ST-elevation acute coronary syndrome. Eur Heart J. 2012; 33:1095–104. https://doi.org/10.1093/eurheartj/ehr444 [PubMed]
- 17. Sun L, Zhou X, Jiang J, Zang X, Chen X, Li H, Cao H, Wang Q. Growth differentiation factor-15 levels and the risk of contrast induced acute kidney injury in acute myocardial infarction patients treated invasively: a propensity-score match analysis. PLoS One. 2018; 13:e0194152. https://doi.org/10.1371/journal.pone.0194152 [PubMed]
- 18. Widera C, Pencina MJ, Bobadilla M, Reimann I, Guba-Quint A, Marquardt I, Bethmann K, Korf-Klingebiel M, Kempf T, Lichtinghagen R, Katus HA, Giannitsis E, Wollert KC. Incremental prognostic value of biomarkers beyond the GRACE (global registry of acute coronary events) score and high-sensitivity cardiac troponin T in non-ST-elevation acute coronary syndrome. Clin Chem. 2013; 59:1497–505. https://doi.org/10.1373/clinchem.2013.206185 [PubMed]
- 19. Sun L, Wang Q. Mid-term prognostic value of serum growth differentiation factor-15 in patients with acute coronary syndrome. Chinese Journal of Arteriosclerosis. 2017; 25:505–08.
- 20. Sun L, Zang X, Song Y, Wang Q. Relations between growth differentiation factor-15 and no-reflow in patients with acute myocardial infarction. Chinese Journal of Arteriosclerosis. 2017; 26:599–603.
- 21. Grady D, Berkowitz SA. Why is a good clinical prediction rule so hard to find? Arch Intern Med. 2011; 171:1701–02. https://doi.org/10.1001/archinternmed.2011.482 [PubMed]
- 22. Zhou X, Sun Z, Zhuang Y, Jiang J, Liu N, Zang X, Chen X, Li H, Cao H, Sun L, Wang Q. Development and validation of nomogram to predict acute kidney injury in patients with acute myocardial infarction treated invasively. Sci Rep. 2018; 8:9769. https://doi.org/10.1038/s41598-018-28088-4 [PubMed]
- 23. Thygesen K, Alpert JS, Jaffe AS, Simoons ML, Chaitman BR, White HD, Thygesen K, Alpert JS, White HD, Jaffe AS, Katus HA, Apple FS, Lindahl B, et al, and Joint ESC/ACCF/AHA/WHF Task Force for Universal Definition of Myocardial Infarction, and Authors/Task Force Members Chairpersons, and Biomarker Subcommittee, and ECG Subcommittee, and Imaging Subcommittee, and Classification Subcommittee, and Intervention Subcommittee, and Trials & Registries Subcommittee, and ESC Committee for Practice Guidelines (CPG), and Document Reviewers. Third universal definition of myocardial infarction. J Am Coll Cardiol. 2012; 60:1581–98. https://doi.org/10.1016/j.jacc.2012.08.001 [PubMed]
- 24. Levey AS, Bosch JP, Lewis JB, Greene T, Rogers N, Roth D. A more accurate method to estimate glomerular filtration rate from serum creatinine: a new prediction equation. Modification of Diet in Renal Disease Study Group. Ann Intern Med. 1999; 130:461–70. https://doi.org/10.7326/0003-4819-130-6-199903160-00002 [PubMed]
- 25. Tang LQ, Li CF, Li J, Chen WH, Chen QY, Yuan LX, Lai XP, He Y, Xu YX, Hu DP, Wen SH, Peng YT, Zhang L, et al. Establishment and validation of prognostic nomograms for endemic nasopharyngeal carcinoma. J Natl Cancer Inst. 2016; 108:djv291. https://doi.org/10.1093/jnci/djv291 [PubMed]
- 26. Callegaro D, Miceli R, Bonvalot S, Ferguson P, Strauss DC, Levy A, Griffin A, Hayes AJ, Stacchiotti S, Pechoux CL, Smith MJ, Fiore M, Dei Tos AP, et al. Development and external validation of two nomograms to predict overall survival and occurrence of distant metastases in adults after surgical resection of localised soft-tissue sarcomas of the extremities: a retrospective analysis. Lancet Oncol. 2016; 17:671–80. https://doi.org/10.1016/S1470-2045(16)00010-3 [PubMed]
- 27. Harrell CC, Kline SS. Vitamin K-supplemented snacks containing olestra: implication for patients taking warfarin. JAMA. 1999; 282:1133–34. https://doi.org/10.1001/jama.282.12.1133 [PubMed]