


Introduction
Colorectal cancer (CRC) is a commonly diagnosed malignant neoplasm which ranks third in terms of incidence and second in terms of mortality in the world [1]. Currently, the main treatment for patients with CRC remains surgical resection [2], postoperative radiotherapy [3], and chemotherapy [4]. In developed countries, overall CRC survival rates are improving because of major improvements in early diagnosis and therapy. The 5-year relative survival rate for CRC was 65% (colon was 64%, rectum was 67%) in the United States in 2019 [5], while in developing countries it is still poor for most CRC patients [6]. Three systems are used for the staging of CRC: Astle-Coller system, TNM system and Dukes staging [7]. Among them, Dukes staging is currently recognized as the most reliable indicator for assessing CRC patient’s prognosis [8]. However, the Dukes staging is not sensitive and accurate enough to evaluate CRC prognosis and recurrence [9]. Thus, it is necessary to investigate new predictive biomarkers.
Several studies have provided evidence that aberrant DNA methylation is associated with CRC outcomes [10–13]. Aberrant DNA methylation of CpG islands correlates with epigenetic gene silencing and drives tumor progression through key signaling pathways [14]. Consequently, aberrant DNA methylation has the potential to be a prognostic and predictive biomarker for CRC [8]. However, studies on promoter aberrant DNA methylation mainly focused on the detection of methylation degree while heterogeneous DNA methylation has rarely been further investigated.
Unlike homogeneous methylation, heterogeneous DNA methylation is referred to as multiple alleles with different DNA methylation patterns [15], each with a varied number of CpG sites methylated. It is the intermediate stage between fully methylated and unmethylated [16]. More so, because the methylation of individual CpG sites is not faithfully maintained by DNA methyltransferase [17], the methylation of alleles is incomplete and could reflect epigenetic instability [18]. To date, studies on the relationship between heterogeneous methylation and tumorigenesis [17–21] demonstrated that heterogeneous methylation might appear early in the progression of the tumor [19] and correlate with gene silencing. It has been proved that age [22], environmental factors [23–25], cell division [26], and other cancer-associated phenomena [27, 28] are contributing factors in the development of heterogeneous methylation.
CASK encodes the calcium/calmodulin-dependent serine protein kinase which is a member of the MAGUK (membrane-associated guanylate kinase) protein family. As the scaffold protein, it can couple diverse signal transduction pathways [29]. CASK is able to bind with four cancer-related cell adhesion receptors (syndecan-1, -2, -3, and -4) to adjust cell proliferation, migration, invasion, and gene expression through the signal pathway [29–34]. It is worth noting that CASK is associated with tumor activity inhibition as the crucial regulator in the carcinogenesis of CRC [30, 34, 35]. CASK has been reported to be over-expressed in CRC [36], gastric cancer [37], and esophageal carcinoma [38]. Moreover, there is an association between high expression of CASK and unfavorable prognosis of colorectal cancer [36]. However, there is no evidence to illustrate the relationship between CASK methylation patterns and the prognosis of patients with CRC, especially the difference in prognosis between heterogeneous and homogeneous methylation patients.
Here, we comprehensively investigated the different effects of heterogeneous and homogeneous methylation of CASK on CRC prognosis in a long-term cohort using the propensity score (PS) adjusted method [39] to control the confounders. In addition, dMS-HRM was used for the visualization and interpretation of complex heterogeneous methylation patterns [40].
Results
MS-HRM analyses of samples
Genomic DNA from 296 primary tumor tissues and 255 adjacent normal tissues of CRC patients were analyzed for methylation status by MS-HRM. Among them, 107 (47.8%) tumor samples and 65 (37.6%) adjacent normal tissue samples were defined as homogeneous methylation. In addition, we also found heterogeneously methylated samples. Their melting profiles do not conform to homogeneous methylation. Figure 1A–1E shows the typical MS-HRM melting curves of CASK heterogeneous methylation. The characteristic melting pattern of heterogeneous methylation indicated that the products derived from heterogeneously methylated samples were not a homogeneous mixture of fully methylated and fully unmethylated sequences.
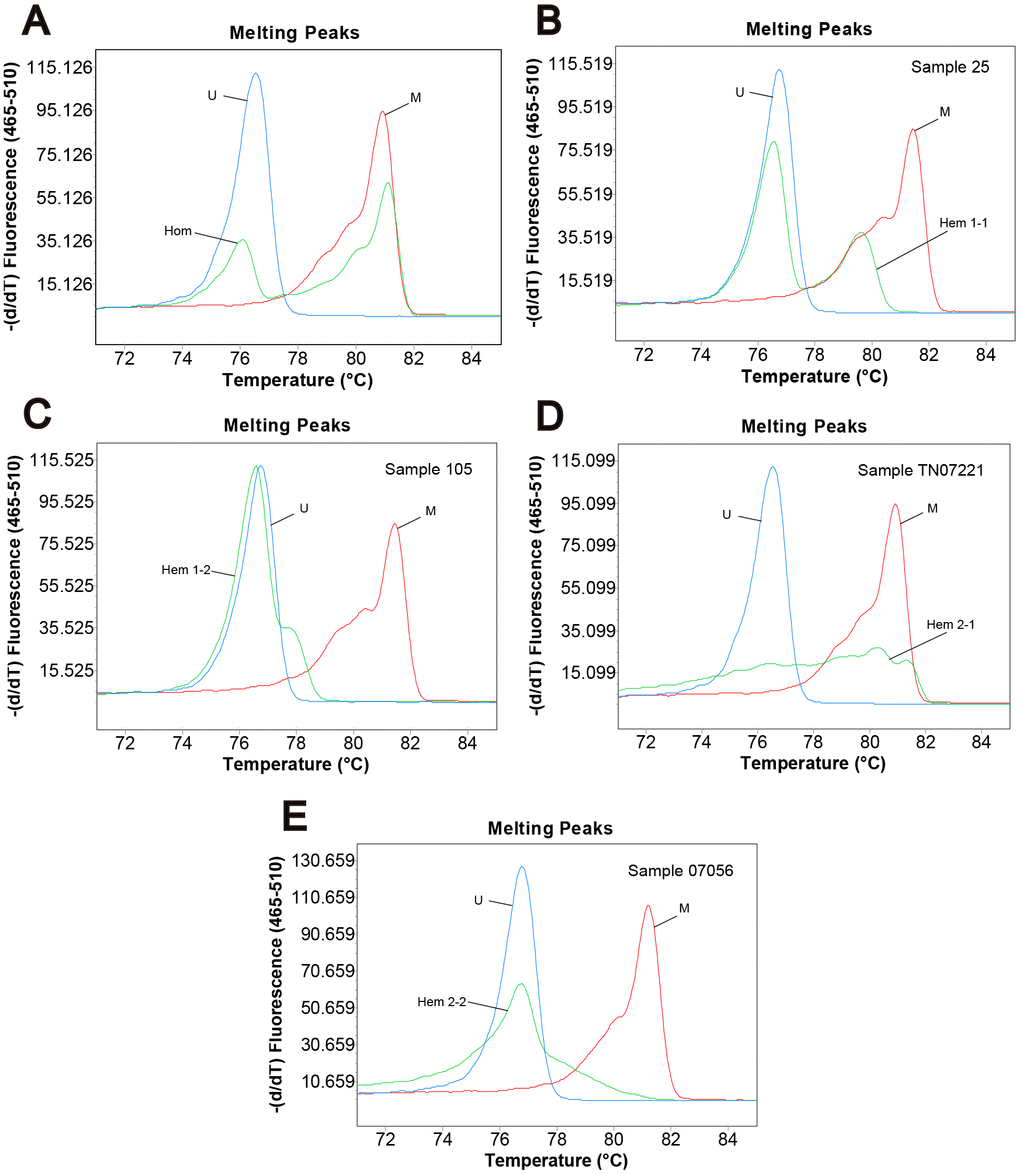
Figure 1. Methylation status of CRC samples defined by melting peak. Melting profiles of the methylation control (M), unmethylation control (U), and (A) the sample with homogeneous methylation (Hom); (B) sample 25 with heterogeneous methylation 1-1 (Hem 1-1); (C) sample 105 with heterogeneous methylation 1-2 (Hem 1-2); (D) sample TN07221 with heterogeneous methylation 2-1 (Hem 2-1); (E) sample 07056 with heterogeneous methylation 2-2 (Hem 2-2).
Post MS-HRM analyses
The PCR products of MS-HRM for heterogeneously methylated samples can be further investigated. Direct sequencing of the MS-HRM product for TN07221 (Hem 2-1) is illustrated in Figure 2. Direct sequencing presented the overall readout across the entire amplicons. The overlapping peaks indicated that the sites were a mixture of cytosine and thymine.
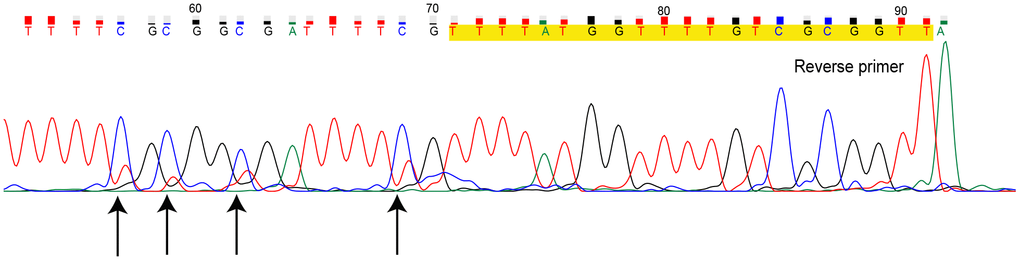
Figure 2. Direct sequencing for methylation-sensitive high-resolution melting (MS-HRM) product of sample TN07221. Primers are marked in yellow, black arrows indicate CpG sites with overlapping peak. (Dye blobs in the unidirectional Sanger sequencing result in uncertainty of bases at the beginning of sequence giving incomplete coverage. Hence, we only provided the definite part of the entire sequencing result.)
To obtain detailed profiles of methylation pattern, dMS-HRM was performed to exactly visualize the individual epiallele. Sample 25 (Hem 1-1), 105 (Hem 1-2), TN07221 (Hem 2-1), and 07056 (Hem 2-2) (Figure 1), representing four kinds of heterogeneous methylation, were analyzed digitally. Figure 3 displays the visualized methylation profiles of the selected samples. They all contained multiple heterogeneously methylated alleles and melted unevenly. We chose dMS-HRM products of sample TN07221 with Hem 2-1 heterogeneous methylation for subsequent Sanger sequencing because of its wide range of variation. It was also the best sample to illustrate the correlation between peak position and the degree of methylation. As the quantities of methylated CpG sites in allele increased, the Tm also increased, and the position of the peak was closer to methylated control. Sanger sequencing of digitally obtained clones is shown in Figure 4 as the validation.
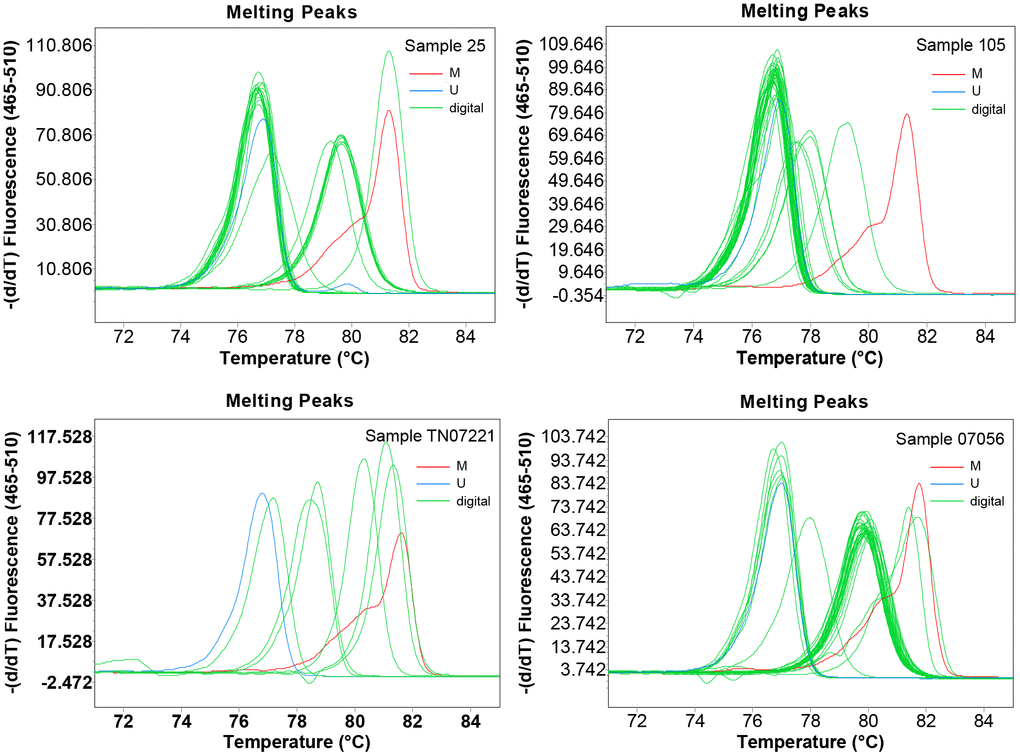
Figure 3. The visualized methylation profiles of four samples performed using digital methylation-sensitive high-resolution melting (dMS-HRM). M: methylation control; U: unmethylation control; digital: digital output of amplicons.
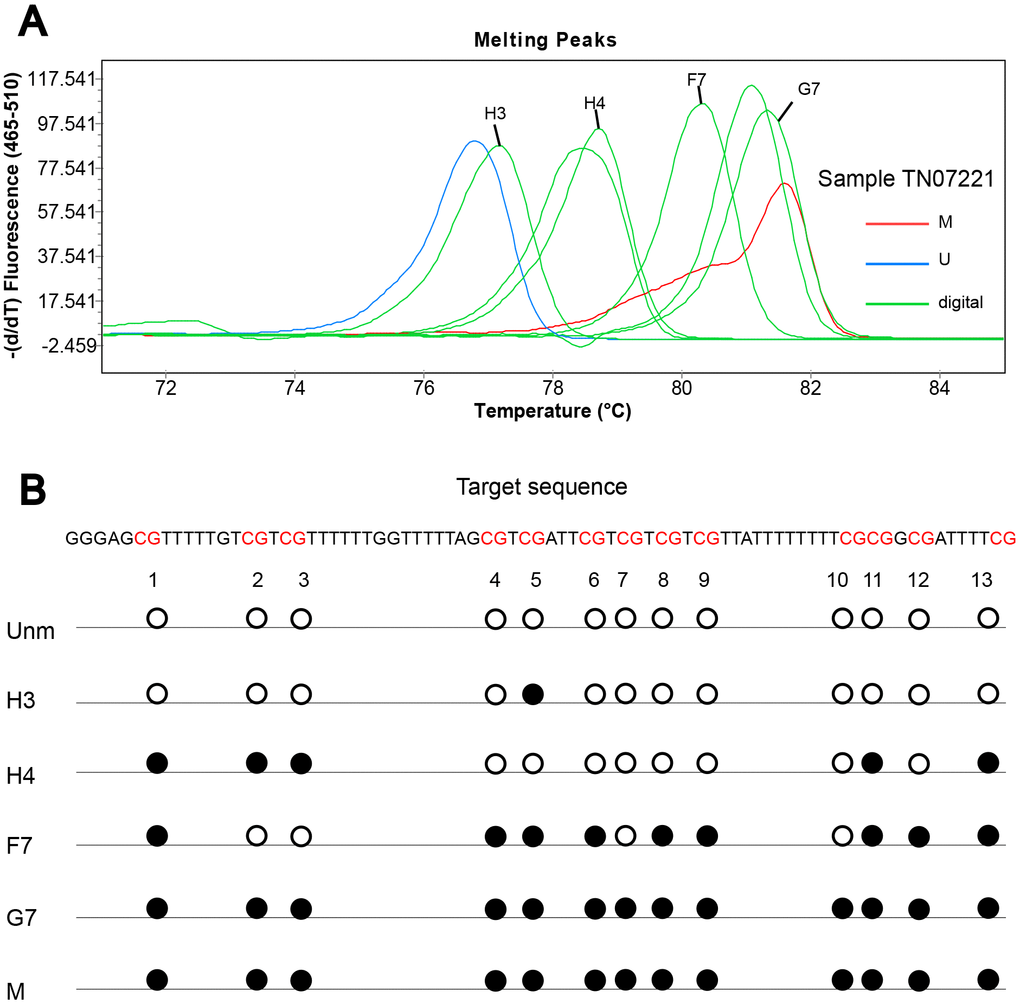
Figure 4. Sanger sequencing of digitally obtained clones from sample TN07221. (A) Products numbered H3, H4, F7 and G7 were sequenced; (B) solid circle and hollow circle illustrate methylated and unmethylated CpG sites, respectively.
Different distribution of heterogeneous and homogeneous methylation
We found that heterogeneous methylation was not only in the tumor, but also in non-neoplastic tissue surrounding the tumor. The proportion of heterogeneous methylation in adjacent normal tissue (62.4%) was higher than the tumor (52.2%) (Supplementary Table 1). Furthermore, heterogeneous methylation of CASK occurred more frequently in CRC patients with lower levels of tumor invasion (T1-T3, P = 0.002) and male patients (P < 0.001) (Supplementary Table 2). And the different distribution of heterogeneous and homogeneous methylation between tumor tissues and adjacent normal tissue samples was statistically significant (P = 0.042) (Supplementary Table 1).
Table 1. Characteristics of study subjects and comparisons of survival time between groups.
| Baseline characteristics | Overall survival time (months) | P‡ | Disease-free Survival (months) | P‡ | |||||||||||||||||||||||||||||||||||||||||||||||||||||||||||||||||||||||||||||||||||||||||||||||
| Mean (SE) | Median† | Mean (SE) | Median† | ||||||||||||||||||||||||||||||||||||||||||||||||||||||||||||||||||||||||||||||||||||||||||||||||
| Age | |||||||||||||||||||||||||||||||||||||||||||||||||||||||||||||||||||||||||||||||||||||||||||||||||||
| < 50 | 71.457 (5.077) | 83 | 66.331 (5.613) | 58 | |||||||||||||||||||||||||||||||||||||||||||||||||||||||||||||||||||||||||||||||||||||||||||||||
| ≥ 50 | 78.786 (2.545) | > 102 | 0.220 | 76.296 (2.744) | > 102 | 0.135 | |||||||||||||||||||||||||||||||||||||||||||||||||||||||||||||||||||||||||||||||||||||||||||||
| Gender | |||||||||||||||||||||||||||||||||||||||||||||||||||||||||||||||||||||||||||||||||||||||||||||||||||
| Male | 78.680 (2.933) | > 83 | 75.413 (3.210) | > 96 | |||||||||||||||||||||||||||||||||||||||||||||||||||||||||||||||||||||||||||||||||||||||||||||||
| Female | 74.833 (3.620) | 96 | 0.470 | 72.496 (1.476) | 96 | 0.478 | |||||||||||||||||||||||||||||||||||||||||||||||||||||||||||||||||||||||||||||||||||||||||||||
| Primary site | |||||||||||||||||||||||||||||||||||||||||||||||||||||||||||||||||||||||||||||||||||||||||||||||||||
| Colon | 78.532 (3.907) | > 98 | 76.149 (4.165) | > 98 | |||||||||||||||||||||||||||||||||||||||||||||||||||||||||||||||||||||||||||||||||||||||||||||||
| Rectum | 76.547 (2.856) | 96 | 0.482 | 73.314 (3.129) | 102 | 0.522 | |||||||||||||||||||||||||||||||||||||||||||||||||||||||||||||||||||||||||||||||||||||||||||||
| Dukes staging | |||||||||||||||||||||||||||||||||||||||||||||||||||||||||||||||||||||||||||||||||||||||||||||||||||
| A/B | 89.056 (2.574) | >102 | 86.734 (2.889) | >102 | |||||||||||||||||||||||||||||||||||||||||||||||||||||||||||||||||||||||||||||||||||||||||||||||
| C/D | 63.337 (3.615) | 58 | < 0.001 | 59.721 (3.819) | 47 | < 0.001 | |||||||||||||||||||||||||||||||||||||||||||||||||||||||||||||||||||||||||||||||||||||||||||||
| TNM staging | |||||||||||||||||||||||||||||||||||||||||||||||||||||||||||||||||||||||||||||||||||||||||||||||||||
| I/II | 89.126 (2.624) | > 96 | 87.299 (2.886) | > 96 | |||||||||||||||||||||||||||||||||||||||||||||||||||||||||||||||||||||||||||||||||||||||||||||||
| III/IV | 62.504 (3.553) | 57 | < 0.001 | 58.752 (3.764) | 47 | < 0.001 | |||||||||||||||||||||||||||||||||||||||||||||||||||||||||||||||||||||||||||||||||||||||||||||
| Tumor invasion | |||||||||||||||||||||||||||||||||||||||||||||||||||||||||||||||||||||||||||||||||||||||||||||||||||
| T1-T3 | 83.660 (2.995) | > 98 | 80.996 (3.303) | > 98 | |||||||||||||||||||||||||||||||||||||||||||||||||||||||||||||||||||||||||||||||||||||||||||||||
| T4 | 72.234 (3.490) | 81 | 0.013 | 68.969 (3.731) | 81 | 0.021 | |||||||||||||||||||||||||||||||||||||||||||||||||||||||||||||||||||||||||||||||||||||||||||||
| Lymph node metastasis | |||||||||||||||||||||||||||||||||||||||||||||||||||||||||||||||||||||||||||||||||||||||||||||||||||
| N0 | 88.315 (2.659) | > 96 | 86.520 (2.907) | > 96 | |||||||||||||||||||||||||||||||||||||||||||||||||||||||||||||||||||||||||||||||||||||||||||||||
| N1/N2 | 62.911 (3.580) | 58 | < 0.001 | 59.061 (3.802) | 47 | < 0.001 | |||||||||||||||||||||||||||||||||||||||||||||||||||||||||||||||||||||||||||||||||||||||||||||
| Distant metastasis | |||||||||||||||||||||||||||||||||||||||||||||||||||||||||||||||||||||||||||||||||||||||||||||||||||
| M0 | 79.819 (2.275) | > 102 | 77.058 (2.482) | > 102 | |||||||||||||||||||||||||||||||||||||||||||||||||||||||||||||||||||||||||||||||||||||||||||||||
| M1 | 25.308 (6.284) | 18 | < 0.001 | 24.615 (6.413) | 18 | < 0.001 | |||||||||||||||||||||||||||||||||||||||||||||||||||||||||||||||||||||||||||||||||||||||||||||
| Histological grade§ | |||||||||||||||||||||||||||||||||||||||||||||||||||||||||||||||||||||||||||||||||||||||||||||||||||
| G1/G2 | 80.841 (2.413) | > 102 | 78.146 (2.640) | > 102 | |||||||||||||||||||||||||||||||||||||||||||||||||||||||||||||||||||||||||||||||||||||||||||||||
| G3/G4 | 61.493 (6.719) | 63 | 0.006 | 57.659 (7.107) | 43 | 0.003 | |||||||||||||||||||||||||||||||||||||||||||||||||||||||||||||||||||||||||||||||||||||||||||||
| Histological type§ | |||||||||||||||||||||||||||||||||||||||||||||||||||||||||||||||||||||||||||||||||||||||||||||||||||
| Adenocarcinoma | 76.451 (2.597) | 98 | 73.266 (2.827) | 102 | |||||||||||||||||||||||||||||||||||||||||||||||||||||||||||||||||||||||||||||||||||||||||||||||
| Other types | 80.805 (4.687) | > 75 | 0.559 | 78.366 (5.069) | > 69 | 0.476 | |||||||||||||||||||||||||||||||||||||||||||||||||||||||||||||||||||||||||||||||||||||||||||||
| Pathological classification§ | |||||||||||||||||||||||||||||||||||||||||||||||||||||||||||||||||||||||||||||||||||||||||||||||||||
| Protuberant | 84.870 (2.600) | > 94 | 82.224 (2.857) | > 94 | |||||||||||||||||||||||||||||||||||||||||||||||||||||||||||||||||||||||||||||||||||||||||||||||
| Other types | 66.478 (4.222) | 71 | < 0.001 | 63.034 (4.523) | 63 | < 0.001 | |||||||||||||||||||||||||||||||||||||||||||||||||||||||||||||||||||||||||||||||||||||||||||||
| Preoperative CEA | |||||||||||||||||||||||||||||||||||||||||||||||||||||||||||||||||||||||||||||||||||||||||||||||||||
| 0-5ng/ml | 86.999 (3.161) | > 75 | 86.425 (3.256) | > 96 | |||||||||||||||||||||||||||||||||||||||||||||||||||||||||||||||||||||||||||||||||||||||||||||||
| ≥ 5ng/ml | 70.345 (3.092) | 80 | < 0.001 | 65.720 (3.396) | 71 | < 0.001 | |||||||||||||||||||||||||||||||||||||||||||||||||||||||||||||||||||||||||||||||||||||||||||||
| Preoperative CA19-9 | |||||||||||||||||||||||||||||||||||||||||||||||||||||||||||||||||||||||||||||||||||||||||||||||||||
| 0-37U/ml | 90.190 (2.293) | > 102 | 88.674 (2.468) | > 102 | |||||||||||||||||||||||||||||||||||||||||||||||||||||||||||||||||||||||||||||||||||||||||||||||
| ≥ 37U/ml | 44.764 (3.591) | 36 | < 0.001 | 37.710 (3.812) | 26 | < 0.001 | |||||||||||||||||||||||||||||||||||||||||||||||||||||||||||||||||||||||||||||||||||||||||||||
| Postoperative chemotherapy | |||||||||||||||||||||||||||||||||||||||||||||||||||||||||||||||||||||||||||||||||||||||||||||||||||
| No | 77.694 (3.136) | 102 | 77.258 (3.172) | > 102 | |||||||||||||||||||||||||||||||||||||||||||||||||||||||||||||||||||||||||||||||||||||||||||||||
| Yes | 77.231 (3.329) | > 96 | 0.988 | 70.847 (3.902) | > 96 | 0.414 | |||||||||||||||||||||||||||||||||||||||||||||||||||||||||||||||||||||||||||||||||||||||||||||
| Postoperative radiotherapy | |||||||||||||||||||||||||||||||||||||||||||||||||||||||||||||||||||||||||||||||||||||||||||||||||||
| No | 78.283 (2.481) | > 96 | 75.990 (2.652) | > 102 | |||||||||||||||||||||||||||||||||||||||||||||||||||||||||||||||||||||||||||||||||||||||||||||||
| Yes | 49.337 (8.017) | 46 | 0.004 | 38.198 (9.017) | 25 | 0.001 | |||||||||||||||||||||||||||||||||||||||||||||||||||||||||||||||||||||||||||||||||||||||||||||
| Postoperative biotherapy | |||||||||||||||||||||||||||||||||||||||||||||||||||||||||||||||||||||||||||||||||||||||||||||||||||
| No | 76.212 (2.591) | 102 | 73.685 (2.770) | > 102 | |||||||||||||||||||||||||||||||||||||||||||||||||||||||||||||||||||||||||||||||||||||||||||||||
| Yes | 88.329 (4.772) | > 80 | 0.075 | 83.256 (5.866) | > 69 | 0.143 | |||||||||||||||||||||||||||||||||||||||||||||||||||||||||||||||||||||||||||||||||||||||||||||
| Methylation status | |||||||||||||||||||||||||||||||||||||||||||||||||||||||||||||||||||||||||||||||||||||||||||||||||||
| Unm | 77.940 (4.469) | > 83 | 74.401 (4.953) | > 81 | |||||||||||||||||||||||||||||||||||||||||||||||||||||||||||||||||||||||||||||||||||||||||||||||
| Tpm | 76.956 (2.635) | 102 | 0.802 | 74.202 (2.842) | > 102 | 0.834 | |||||||||||||||||||||||||||||||||||||||||||||||||||||||||||||||||||||||||||||||||||||||||||||
| Hom | 70.179 (3.904) | 80 | 68.150 (4.158) | 94 | |||||||||||||||||||||||||||||||||||||||||||||||||||||||||||||||||||||||||||||||||||||||||||||||
| Thm | 82.172 (3.511) | > 98 | 0.023 | 79.248 (3.825) | > 98 | 0.030 | |||||||||||||||||||||||||||||||||||||||||||||||||||||||||||||||||||||||||||||||||||||||||||||
| †The mean survival time was underestimated because the largest observation was censored and the estimation was restricted to the largest event time. | |||||||||||||||||||||||||||||||||||||||||||||||||||||||||||||||||||||||||||||||||||||||||||||||||||
| ‡P value was calculated using Log-tank test for comparing survival rates between two groups. | |||||||||||||||||||||||||||||||||||||||||||||||||||||||||||||||||||||||||||||||||||||||||||||||||||
| §G1-highly differentiated, G2-moderately differentiated, G3-poorly differentiated, G4-undifferentiated. Other types of histological type include mucinous adenocarcinoma, undifferentiated carcinoma, squamous cell carcinoma, papillary adenocarcinoma, signet ring cell carcinoma and other types. Other types of pathological classification include ulcer, invasion, narrow, nodular and other types. | |||||||||||||||||||||||||||||||||||||||||||||||||||||||||||||||||||||||||||||||||||||||||||||||||||
Association between different CASK methylation status and prognosis of CRC
The mean and median survival times for all subjects are shown in Table 1. Patients with homogeneous methylation presented statistically significant lower survival rates. The 8-year OS rate was 27% in homogeneous methylation group versus 56% in heterogeneous methylation group (P = 0.023) (Supplementary Table 3). When compared with unmethylation, homogeneous methylation predicted more unfavorable survival (HRmultivariate-adjusted: 2.473, 95% CI: 1.136-5.382, P = 0.022); however, there was no statistically significant association between heterogeneous methylation (Tpm and Thm) and CRC prognosis (Supplementary Table 4).
We found that the effects of homogeneous and heterogeneous methylation on CRC prognosis were distinctly different. The results of univariate and multivariate Cox analysis demonstrate that patients with CASK homogeneous methylation presented poorer OS and DFS compared with heterogeneous methylation (Supplementary Tables 5, 6). The Kaplan-Meier survival curves are shown in Supplementary Figure 1. In addition, compared with Hem 1-1 and Hem 2-1 respectively, the unfavorable effect of CASK homogeneous methylation on CRC prognosis also persisted (Supplementary Table 6).
We further performed PS regression analysis to minimize the potential effects of confounding factors [16 factors including age, gender, primary site, staging, etc. (details are shown in baseline characteristics of Table 1)], and to assess the effect estimates between categorical variables and the outcome variables [41]. Compared with heterogeneous methylation, the association between CASK homogeneous methylation and unfavorable survival was still statistically significant. The HRPS-adjusted for OS was 1.919 (95% CI: 1.146-3.212, P = 0.013) and for DFS was 1.913 (95% CI: 1.146-3.194, P = 0.013) (Table 2).
Table 2. Comparison of the unadjusted and the adjusted effect estimates (Hom vs Thm).
| HRs for CASK methylation and CRC prognosis | HR (95% CI) | P† | confounding RR‡ | P§ | |||||||||||||||||||||||||||||||||||||||||||||||||||||||||||||||||||||||||||||||||||||||||||||||
| OS | |||||||||||||||||||||||||||||||||||||||||||||||||||||||||||||||||||||||||||||||||||||||||||||||||||
| Unadjusted | 1.603 (1.062-2.419) | 0.025 | |||||||||||||||||||||||||||||||||||||||||||||||||||||||||||||||||||||||||||||||||||||||||||||||||
| Variable adjusted | 2.501 (1.383-4.525) | 0.002 | 1.560 | 0.227 | |||||||||||||||||||||||||||||||||||||||||||||||||||||||||||||||||||||||||||||||||||||||||||||||
| PS-adjusted | 1.919 (1.146-3.212) | 0.013 | 1.197 | 0.594 | |||||||||||||||||||||||||||||||||||||||||||||||||||||||||||||||||||||||||||||||||||||||||||||||
| DFS | |||||||||||||||||||||||||||||||||||||||||||||||||||||||||||||||||||||||||||||||||||||||||||||||||||
| Unadjusted | 1.567 (1.039-2.364) | 0.032 | |||||||||||||||||||||||||||||||||||||||||||||||||||||||||||||||||||||||||||||||||||||||||||||||||
| Variable adjusted | 2.495 (1.394-4.464) | 0.002 | 1.592 | 0.201 | |||||||||||||||||||||||||||||||||||||||||||||||||||||||||||||||||||||||||||||||||||||||||||||||
| PS-adjusted | 1.913 (1.146-3.194) | 0.013 | 1.221 | 0.552 | |||||||||||||||||||||||||||||||||||||||||||||||||||||||||||||||||||||||||||||||||||||||||||||||
| †P value was calculated using Cox regression analysis. | |||||||||||||||||||||||||||||||||||||||||||||||||||||||||||||||||||||||||||||||||||||||||||||||||||
| ‡Confounding RR was defined as the ratio of the PS-adjusted HR and the unadjusted HR or the variable-adjusted HR and the unadjusted HR. | |||||||||||||||||||||||||||||||||||||||||||||||||||||||||||||||||||||||||||||||||||||||||||||||||||
| §Test for heterogeneity between HRs was conducted by Comprehensive Meta-Analysis (version 2.0). | |||||||||||||||||||||||||||||||||||||||||||||||||||||||||||||||||||||||||||||||||||||||||||||||||||
Subgroup and sensitivity analysis
According to the result of the subgroup analysis (Table 3), we observed that the disadvantageous effect of CASK homogeneous methylation on survival was still significant among older (≥ 50), Dukes staging C/D, and rectal cancer patients. Next, we compared unadjusted and adjusted effect estimates using "confounding RR", and found there was no heterogeneity between them (P > 0.050) (Table 2).
Table 3. Subgroup analysis for association between CASK methylation status and CRC prognosis (Hom vs Thm).
| Subgroup | Hom, No | Thm, No | PS-adjusted† (OS) HR (95% CI) | P‡ | PS-adjusted† (DFS) HR (95% CI) | P‡ | |||||||||||||||||||||||||||||||||||||||||||||||||||||||||||||||||||||||||||||||||||||||||||||
| Gender | |||||||||||||||||||||||||||||||||||||||||||||||||||||||||||||||||||||||||||||||||||||||||||||||||||
| Male | 20 | 83 | 1.754 (0.826-3.724) | 0.144 | 1.770 (0.838-3.738) | 0.135 | |||||||||||||||||||||||||||||||||||||||||||||||||||||||||||||||||||||||||||||||||||||||||||||
| Female | 87 | 34 | 1.928 (0.949-3.917) | 0.070 | 1.915 (0.949-3.868) | 0.070 | |||||||||||||||||||||||||||||||||||||||||||||||||||||||||||||||||||||||||||||||||||||||||||||
| Age | |||||||||||||||||||||||||||||||||||||||||||||||||||||||||||||||||||||||||||||||||||||||||||||||||||
| < 50 | 20 | 26 | 1.147 (0.383-3.435) | 0.806 | 1.216 (0.405-3.654) | 0.728 | |||||||||||||||||||||||||||||||||||||||||||||||||||||||||||||||||||||||||||||||||||||||||||||
| ≥ 50 | 87 | 91 | 2.299 (1.277-4.141) | 0.006 | 2.143 (1.196-3.838) | 0.010 | |||||||||||||||||||||||||||||||||||||||||||||||||||||||||||||||||||||||||||||||||||||||||||||
| Tumor site | |||||||||||||||||||||||||||||||||||||||||||||||||||||||||||||||||||||||||||||||||||||||||||||||||||
| Rectal | 65 | 72 | 2.012 (1.050-3.855) | 0.035 | 1.972 (1.034-3.763) | 0.039 | |||||||||||||||||||||||||||||||||||||||||||||||||||||||||||||||||||||||||||||||||||||||||||||
| Colon | 42 | 45 | 1.780 (0.762-4.156) | 0.183 | 1.805 (0.777-4.195) | 0.170 | |||||||||||||||||||||||||||||||||||||||||||||||||||||||||||||||||||||||||||||||||||||||||||||
| Dukes staging | |||||||||||||||||||||||||||||||||||||||||||||||||||||||||||||||||||||||||||||||||||||||||||||||||||
| A/B | 64 | 59 | 1.688 (0.682-4.080) | 0.262 | 1.663 (0.680-4.071) | 0.265 | |||||||||||||||||||||||||||||||||||||||||||||||||||||||||||||||||||||||||||||||||||||||||||||
| C/D | 43 | 58 | 2.138 (1.153-3.964) | 0.016 | 2.196 (1.196-4.032) | 0.011 | |||||||||||||||||||||||||||||||||||||||||||||||||||||||||||||||||||||||||||||||||||||||||||||
| †HR values were the effect estimates adjusted by propensity score. | |||||||||||||||||||||||||||||||||||||||||||||||||||||||||||||||||||||||||||||||||||||||||||||||||||
| ‡P value was calculated using Cox regression model. | |||||||||||||||||||||||||||||||||||||||||||||||||||||||||||||||||||||||||||||||||||||||||||||||||||
Association between different CASK methylation status and prognosis of CRC in the validation TCGA dataset
We evaluated the methylation status of the three probes (cg02161125, cg03983969, and cg12614178) annotated by HM450 and located in the target sequence of our study in 379 CRC tissues. The methylation data were downloaded from TCGA Data Portal (http://tcga-data.nci.nih.gov/tcga/) [42]. We defined samples with high different methylation levels (cutoff was set according to the SD for beta values of three probes) of the three adjacent sites as heterogeneous methylation, otherwise as homogenous methylation. At last, 169 samples were defined as heterogeneous methylation (169/379). We also observed a tendency that homogeneous methylation had poorer survival than heterogeneous methylation even without statistical significance (HRmultivariate-adjusted: 1.700, 95% CI: 0.819-3.532, P = 0.155) (Supplementary Table 7). Subgroup analysis also had the same trend as our initial findings (Supplementary Table 8).
Discussion
To the best of our knowledge, this is the first study to reveal the different effects between CASK promoter heterogeneous and homogeneous methylation on the prognosis of CRC patients. MS-HRM allowed us to evaluate heterogeneous methylation in a large sample and minimize analysis costs. The dMS-HRM performed a detailed analysis of representative samples. It also enabled us to obtain detailed heterogeneous methylation patterns both cost and time-effectively [40]. The PS-adjusted method can substantially minimize the number of independent variables included in the regression model and reduce the bias caused by collinearity [43].
Our results indicated that heterogeneous methylation of CASK promoter was distinctly different from homogeneous methylation on CRC prognosis, and homogeneous methylation patients with a more unfavorable prognosis. Furthermore, the results of multivariate Cox analysis and PS regression adjusted analysis suggested that this association was not affected by known confounding factors. The results were also verified to some extent by data from the TCGA database. Additionally, the unfavorable association was also observed in the older (≥ 50), Dukes staging C/D, and rectal cancer patients. There was no statistically significant association in the subgroup analysis based on gender, which may be due to our limited sample size. We confirmed there was no evidence of heterogeneity by assessing confounding RR. Based on the above analyses, our results were reliable to identify the different effects of CASK promoter heterogeneous methylation and homogeneous methylation on prognosis. We also found a weak correlation (r = -0.106, P = 0.038) between the methylation level of CASK (cg12614178) and the expression level in the TCGA database (Supplementary Figure 2). And, it has been proven that high expression of CASK is associated with poor prognosis of CRC [36]. It is reasonable that we speculate CASK methylation may affect the prognosis of CRC via gene expression. Further investigation is needed.
In the current study, we found that both tumor and non-neoplastic tissue surrounding the tumor presented heterogeneous methylation. This validated the findings of Azhikina et al. in previous study [19]. The heterogeneity of methylation appeared more in normal tissue surrounding tumor. Methylation of cancer-related genes in promoter regions may initially occur in normal tissues adjacent tumors. It may imply an early stage before pathological changes. More so, heterogeneous methylation is considered as the intermediate stage between fully methylation and unmethylation [16]. As was reported by previous research, during cancer progression from a benign tumor to malignancy, a single CpG site is independently methylated, and the methylation of specific CpG sites is "seeded" over time until all CpG sites are methylated [44]. Thus, it is reasonable that we found heterogeneous methylation was more likely to occur in patients with lower levels of tumor invasion (T1-T3).
When DNA methylation is regarded as a cancer biomarker, methylation heterogeneity is generally not taken into consideration. The methylation level is mostly reported as an average of the entire amplicon. Moreover, heterogeneous methylated samples are often ignored or sometimes mistaken for homogeneous methylation or unmethylation. Consequently, the correct interpretation of the methylation patterns will be compromised, and some reports may have misestimated the frequency of methylation events. Studies about the effects of positive methylation should pay attention to different methylation types and the difference between them to get a correct and comprehensive interpretation.
Previous studies found that many promoter regions of genes were heterogeneously methylated, such as GHSR in breast cancer [20], CDKN2B in acute myeloid leukemia [40], DAPK1 and LPL in chronic lymphocytic leukemia [45, 46], RARB [47] and SOX18 [19] in non-small cell lung cancer, and ABO, RUNX3, CDH1, CDH13 in oral tongue squamous cell carcinomas [18]. Nevertheless, the evaluation of heterogeneous DNA methylation has not been performed extensively in a relatively large and long-term cohort. Also, few investigations have been focused on the clinical consequences of this process. The study on chronic lymphocytic leukemia evaluated the relationship between heterogeneous methylation and time to treatment (TTT) [46]. It indicated that patients with LPL full (8/112) or heterogeneous methylation (64/112) predicted longer TTT. The study on oral tongue squamous cell carcinomas assessed the effect of heterogeneous methylation on survival which found that patients with RUNX3 heterogeneous methylation (18/108) had a worse survival than unmethylation [18]. Consequently, the effect of heterogeneous methylation on prognosis may vary due to different gene and cancer.
Many techniques are not suitable to evaluate heterogeneous methylation. Direct sequencing and pyrosequencing can estimate the average methylation degree at each CpG site, while the number of methylated templates cannot be inferred. Thus, the explanation of the results is often challenging [48]. Bisulfite sequencing of the individual clone is effective but expensive and strenuous [17, 49]. Massively parallel deep sequencing is an exact research technique, but it is high-cost and complex [50, 51]. Denaturing Gradient Gel Electrophoresis can visualize heterogeneous methylation [52, 53], droplet digital PCR (ddPCR) can be used to identify and quantify heterogeneously methylated epialleles as a new technique [21], and EpiHRMAssay can provide additional information for assessing heterogeneous methylation [54]. But these techniques are expensive and have not been widely used.
MS-HRM assays are able to identify heterogeneously methylated samples readily [55]. As a fast, sensitive, reliable, and robust method for distinguishing heterogeneous methylation, MS-HRM can qualitatively estimate heterogeneous methylation. Digital PCR of a single template eliminates cloning bias and PCR bias well [56]. Consequently, dMS-HRM is an effective tool to precisely identify methylation patterns which will be confirmed by subsequent sequencing. We combined these two methods to assess the CASK heterogeneous methylation. The representative samples pre-screened by MS-HRM were performed for dMS-HRM. The comprehensive methylation pictures of the target sequence were provided. Aimed to provide an interpretable visualization of heterogeneous methylation and reveal the heterogeneous methylation status of each individual CpG dinucleotide, we performed sequencing. Our findings showed that the products of heterogeneously methylated amplicons were composed of alleles that only differ in a few CpG sites, and Tm increased with quantities of methylated CpG sites in allele. In keeping with our result, previous studies reported that heterogeneously methylated samples led to extensive heteroduplex formation. The formation of heteroduplexes was due to the presence of molecules that differ by only a few bases [40] [45].
Our research also has several limitations. Above all, heterogeneous methylation can only be estimated in a qualitative manner. However, MS-HRM is a specific, sensitive, and economical method that is most suitable for detecting heterogeneous methylation. And heterogeneous methylation patterns were further assessed by subsequent analyses (dMS-HRM and sequencing) in this research.
Furthermore, it is not clear that the mechanisms of which CASK promoter heterogeneous and homogenous methylation differently affect the prognosis of CRC. To our knowledge, we show for the first time the different effects of homogeneous and heterogeneous methylation on the prognosis of CRC patients. A hypothesis has been proposed that heterogeneous methylation may not be sufficient to eliminate the transcription like homogeneous methylation, but may only interfere with the transcription process or be a "passenger" of the carcinogenesis [20]. More so it has been proven that various levels of methylation density of CpG sites correlated with the status of gene silencing [17]. The mechanism for the different prognostic effects of heterogeneous and homogeneous methylation is still unclear and further studies are still essential.
Currently, digital PCR assays are frequently used in liquid biopsies to investigate DNA methylation biomarkers [57–59]. But it cannot accurately quantify heterogeneous DNA methylation. Particularly, all methylated clones need to be sequenced when further investigate heterogeneous methylation. It high-cost and difficult to analyze heterogeneous methylation comprehensively [15]. Thus, the role of heterogeneous methylation in cancer diagnosis and prognosis prediction is usually neglected. Meanwhile, dMS-HRM can easily identify and screen single template clones by melting curves. It can significantly reduce the amount of sequencing and obtain exhaustive methylation patterns. Therefore, dMS-HRM which uses low copy and heterogenous methylated DNA in liquid biopsies might be expected to be applied in CRC diagnosis, prognosis evaluation, prediction of therapeutic efficacy, and recurrence monitoring. The future development of biomarkers that combined homogeneous methylation status and heterogeneity will improve comprehensive outcome prediction.
Future research should pay more attention to the presence of heterogeneous methylation when analyzing the methylation level of the specific gene sequences. It is inadvisable to ignore heterogeneous methylation or treat them as homogenous methylation when analyzing prognosis.
Conclusions
CRC patients with homogenous methylation in CASK promoter showed a more unfavorable prognosis than those with heterogeneous methylation. Combine MS-HRM and dMS-HRM can identify and visualize heterogeneous methylation patterns.
Materials and Methods
Patients and tissue specimens
This study included primary CRC patients who were diagnosed at the Third Affiliated Hospital of Harbin Medical University between November 2004 and January 2008. All tumor specimens were obtained after participants provided informed consent. Tumors and adjacent normal tissues were excised at the time of surgery and rapidly frozen in liquid nitrogen. They were recognized by two independent senior pathologists and then stored at -80°C refrigerator in the laboratory. We also collected clinicopathological data based medical records (Table 1). The study is consistent with the Declaration of Helsinki in 2000. All procedures performed in this study are in accordance with the ethical standards of the Institutional Review Board of Harbin Medical University.
Finally, 296 CRC patients (122 females and 174 males) were included in this study. Patients were followed at 3-6-month intervals in the first year after surgery, and then annually. The last follow-up date was March 15, 2014. At the end of follow-up, 122 (41.22%) patients were confirmed dead, 140 (47.30%) patients were still alive, and 34 (11.48%) patients were lost to follow up (Supplementary Figure 3). The overall survival (OS) time was defined as the length of time from the date of surgery to either the death of patients or the last follow-up time. The disease-free survival (DFS) refers to the period from the date of surgery to the recurrence or metastasis of cancer or the death of patients due to disease progression.
Genomic DNA extraction and sodium bisulfite modification
Genomic DNA was extracted from tumor tissues and adjacent normal tissues using phenol-chloroform procedure and stored at -80°C [60]. About 2000ng of genomic DNA was subjected to sodium bisulfite modification using the EpiTect Fast DNA Bisulfite kit (Qiagen, Hilden, Germany) according to the manufacturer’s protocol. Human WGA (the whole genome amplified) Methylated and Non-methylated DNA (Zymo Research Corp, Irvine, CA, USA) were converted in the same way as the fully methylated and unmethylated DNA controls. Bisulfited DNA samples were preserved at -20°C for the subsequent experiments avoiding repeated freezing and thawing. The purity and concentration of DNA samples were measured by Nanodrop 2000 spectrophotometer (Thermo Scientific, USA).
Methylation-sensitive high-resolution melting (MS-HRM)
MS-HRM [61, 62] was performed on LightCycler 480 (Roche Diagnostics, Penzberg, Germany) using matching Multiwell Plate 96. The specific amplified region corresponds to nucleotides 41782664-41782781 (UCSC: hg19 uc004dfl. 4). The amplicon (118bp, including 13 CpG dinucleotides) was located at the promoter of the CASK gene. Primers were designed according to the principles outlined in Wojdacz et al. [63] using Primer Premier 5.0 (Premier Biosoft International, Palo Alto, CA). The primer sequences, the mixture for each reaction, and cycling protocol are listed in Supplementary Table 9. The set of methylation standards included 100%, 50%, 25%, 10%, 5%, 1%. Supplementary Figure 4 shows typical MS-HRM melting profiles of the CASK promoter region in standard substance. Methylation standards and a non-template control (NTC) were included in each run to control the sensitivity of detection. Additionally, all samples were detected in duplicate. In total, 48 samples (randomly selected from previous batches) were retested at different times to control the reproducibility of detection. We discovered high consistency (κ value = 0.943, P < 0.001). Details are shown in (Supplementary Table 10).
The data were analyzed using gene scanning and melting temperature (Tm) calling modules of LightCyler 480 Gene Scanning software version 1.5 (Roche Diagnostics, Penzberg, Germany). The results were jointly determined by two independent operators with the same criteria.
Definition of methylation status
Heterogeneously methylated amplicons did not melt uniformly and presented with the highly distinct melting curves generated by the heteroduplex formation between strands that only differ at a few CpG sites [40, 45, 55]. MS-HRM can easily distinguish heterogeneous from homogeneous DNA methylation. The methylation profiles were interpreted using both the melting peaks and normalized melting curves [20, 55].
The definition of different methylation status was according to the characteristic melting peaks [64]. Types were as follows: (1) unmethylation (Unm); (2) total positive methylation (Tpm); (3) homogeneous methylation (Hom); (4) total heterogeneous methylation (Thm); (5) early melting heterogeneous methylation 1 (Hem 1-1); (6) early melting heterogeneous methylation 2 (Hem 1-2); (7) cross peak heterogeneous methylation 1 (Hem 2-1); (8) cross peak heterogeneous methylation 2 (Hem 2-2). Table 4 describes the detailed characteristics of different methylation status. The examples of different kinds of methylation profiles detected in our analysis are presented in Figure 1.
Table 4. Characteristics of different methylation status.
| Methylation status | Characteristics of melting peak |
| Unm | Unmethylated peak |
| Tpm | Thm+Hom |
| Hom | Homogeneous methylated peak, could be semi-quantitative according to normalized melting curves |
| Thm | Hem 1-1+Hem 1-2+Hem 2-1+Hem 2-2 |
| Hem 1-1 | Methylation melting peak before homogeneous methylation melting profile |
| Hem 1-2 | Methylation melting peak earlier than Hem 1-1 |
| Hem 2-1 | Broad melting peak crossing methylation and unmethylation profiles |
| Hem 2-2 | Wider peak than unmethylation peak |
Digital methylation-sensitive high-resolution melting (dMS-HRM) and sequencing
Heterogeneously methylated samples were readily identified using MS-HRM by the characteristic melting patterns. Furthermore, dMS-HRM could provide a visual interpretation of complex methylation patterns [40]. The basis of dMS-HRM is to individually amplify a single DNA template isolated by dilution to discriminate different alleles [65, 66].
Ten-fold serial dilutions of heterogeneously methylated amplicons were made. The replicates of each dilution were amplified to choose the most appropriate dilution for further analysis. Multiple replicates for the selected dilution and methylated control DNA (100% and 0% methylated DNA) were performed using MS-HRM. We analyzed the result to get the digital output of the amplicons. The primer sequence, reaction mixture, and instrument of dMS-HRM were the same with MS-HRM. The cycling protocol of dMS-HRM is shown in Supplementary Table 9.
According to the principle, each well contained no template, single template, or occasionally more than one amplifiable template. And, the expected distribution conformed to Poisson distribution. Amplifications can be easily identified by melting curves with different forms. Melting curves from a single template showed a sharp and smooth single peak. Melting curves generated from multiple templates presented two peaks or more complex patterns.
Replicates with a single sharp melting peak (single template) were selected for sequencing (Sangon Biotech, Shanghai) to visualize the complex heterogeneously methylated amplicons. The sequencing data were analyzed and visualized using the Chromas version 2.6.6 (Technelysium Pty Ltd, South Brisbane, Queensland, Australia).
Statistical analysis
Means and standard deviations (SD) were calculated for continuous variables. Categorical variables were presented as counts and frequencies, and the different distributions between categorical variables were compared by the Chi-square test. Cox regression model was adopted to estimate the impact of clinicopathologic characteristics and methylation status on patient outcomes. The associations were reported as hazard ratios (HRs) and 95% confidence intervals (CIs). The survival rates were estimated using life table. Survival curves were performed using the Kaplan-Meier method.
The PS-adjusted method, which is a robust method to balance the comparability of multiple confounding variables to achieve an effect similar to randomization in the observational study [39], was adopted to eliminate the potential confounding effects in this study. Moreover, the missing values were complemented by multiple imputations. We further conducted subgroup analysis according to gender, age, tumor site, and Dukes staging. In order to assess the stability of our results, we performed subsequent sensitivity analysis by calculating "confounding RR" which was defined as the ratio of the PS-adjusted HR and the unadjusted HR or the variable-adjusted HR and the unadjusted HR [67].
Besides, we analyzed the relationship between CASK methylation status and CRC prognosis in the Cancer Genome Atlas (TCGA) database to validate our results externally. The best cutoff was calculated by X-tile version 3.6.1 (Yale University, USA) [68]. All statistical analyses were performed using SPSS version 23.0 (IBM, Inc, USA). All P values were two-sided, and P < 0.050 was considered statistically significant.
Availability of data and materials
All data analyzed in the current study are available from the corresponding author on reasonable request.
Author Contributions
YSZ, BBC and HRS contributed to study conception and design. JX, YYZ, and LZ collected the samples. SMS, LYZ, and DZ collected clinicopathological data. HRS and HH contributed to technical support about MS-HRM. YL performed methylation analyses and drafted the manuscript. YSZ, HRS, and YL contributed to the analysis and interpretation of data. YSZ, HRS, JMF and YL revised the manuscript until submit. JUO reviewed the manuscript for clarity. YL and HRS contributed to manuscript submission. All authors read and approved the final manuscript.
Acknowledgments
The authors would like to thank Zuoming Zhang and Xinyan Liu for their assistance in DNA sample preparation. We thank Wenzhen Xie for her assistance in the analysis of data. We also appreciate the technical support from technical staff of Roche.
Conflicts of Interest
The authors declare that they have no conflicts of interest.
Funding
This work was supported by the National Natural Science Foundation of China (81473055 and 30972539).
References
- 1. Bray F, Ferlay J, Soerjomataram I, Siegel RL, Torre LA, Jemal A. Global cancer statistics 2018: GLOBOCAN estimates of incidence and mortality worldwide for 36 cancers in 185 countries. CA Cancer J Clin. 2018; 68:394–424. https://doi.org/10.3322/caac.21492 [PubMed]
- 2. Kim NK, Kim YW, Han YD, Cho MS, Hur H, Min BS, Lee KY. Complete mesocolic excision and central vascular ligation for colon cancer: principle, anatomy, surgical technique, and outcomes. Surg Oncol. 2016; 25:252–62. https://doi.org/10.1016/j.suronc.2016.05.009 [PubMed]
- 3. Ren Y, Fleischmann D, Foygel K, Molvin L, Lutz AM, Koong AC, Jeffrey RB, Tian L, Willmann JK. Antiangiogenic and radiation therapy: early effects on in vivo computed tomography perfusion parameters in human colon cancer xenografts in mice. Invest Radiol. 2012; 47:25–32. https://doi.org/10.1097/RLI.0b013e31823a82f6 [PubMed]
- 4. Manjelievskaia J, Brown D, McGlynn KA, Anderson W, Shriver CD, Zhu K. Chemotherapy use and survival among young and middle-aged patients with colon cancer. JAMA Surg. 2017; 152:452–59. https://doi.org/10.1001/jamasurg.2016.5050 [PubMed]
- 5. Miller KD, Nogueira L, Mariotto AB, Rowland JH, Yabroff KR, Alfano CM, Jemal A, Kramer JL, Siegel RL. Cancer treatment and survivorship statistics, 2019. CA Cancer J Clin. 2019; 69:363–85. https://doi.org/10.3322/caac.21565 [PubMed]
- 6. Agyemang-Yeboah F, Yorke J, Obirikorang C, Nsenbah Batu E, Acheampong E, Amankwaa Frimpong E, Odame Anto E, Amankwaa B. Colorectal cancer survival rates in Ghana: a retrospective hospital-based study. PLoS One. 2018; 13:e0209307. https://doi.org/10.1371/journal.pone.0209307 [PubMed]
- 7. Akkoca AN, Yanık S, Ozdemir ZT, Cihan FG, Sayar S, Cincin TG, Cam A, Ozer C. TNM and modified dukes staging along with the demographic characteristics of patients with colorectal carcinoma. Int J Clin Exp Med. 2014; 7:2828–35. [PubMed]
- 8. Okugawa Y, Grady WM, Goel A. Epigenetic alterations in colorectal cancer: emerging biomarkers. Gastroenterology. 2015; 149:1204–25.e12. https://doi.org/10.1053/j.gastro.2015.07.011 [PubMed]
- 9. Winawer S, Fletcher R, Rex D, Bond J, Burt R, Ferrucci J, Ganiats T, Levin T, Woolf S, Johnson D, Kirk L, Litin S, Simmang C, and Gastrointestinal Consortium Panel. Colorectal cancer screening and surveillance: clinical guidelines and rationale-update based on new evidence. Gastroenterology. 2003; 124:544–60. https://doi.org/10.1053/gast.2003.50044 [PubMed]
- 10. Ogino S, Nosho K, Kirkner GJ, Kawasaki T, Chan AT, Schernhammer ES, Giovannucci EL, Fuchs CS. A cohort study of tumoral LINE-1 hypomethylation and prognosis in colon cancer. J Natl Cancer Inst. 2008; 100:1734–38. https://doi.org/10.1093/jnci/djn359 [PubMed]
- 11. Antelo M, Balaguer F, Shia J, Shen Y, Hur K, Moreira L, Cuatrecasas M, Bujanda L, Giraldez MD, Takahashi M, Cabanne A, Barugel ME, Arnold M, et al. A high degree of LINE-1 hypomethylation is a unique feature of early-onset colorectal cancer. PLoS One. 2012; 7:e45357. https://doi.org/10.1371/journal.pone.0045357 [PubMed]
- 12. Ahn JB, Chung WB, Maeda O, Shin SJ, Kim HS, Chung HC, Kim NK, Issa JP. DNA methylation predicts recurrence from resected stage III proximal colon cancer. Cancer. 2011; 117:1847–54. https://doi.org/10.1002/cncr.25737 [PubMed]
- 13. Rhee YY, Kim MJ, Bae JM, Koh JM, Cho NY, Juhnn YS, Kim D, Kang GH. Clinical outcomes of patients with microsatellite-unstable colorectal carcinomas depend on L1 methylation level. Ann Surg Oncol. 2012; 19:3441–48. https://doi.org/10.1245/s10434-012-2410-7 [PubMed]
- 14. Baylin SB, Ohm JE. Epigenetic gene silencing in cancer - a mechanism for early oncogenic pathway addiction? Nat Rev Cancer. 2006; 6:107–16. https://doi.org/10.1038/nrc1799 [PubMed]
- 15. Mikeska T, Candiloro IL, Dobrovic A. The implications of heterogeneous DNA methylation for the accurate quantification of methylation. Epigenomics. 2010; 2:561–73. https://doi.org/10.2217/epi.10.32 [PubMed]
- 16. Wojdacz TK. The limitations of locus specific methylation qualification and quantification in clinical material. Front Genet. 2012; 3:21. https://doi.org/10.3389/fgene.2012.00021 [PubMed]
- 17. Cameron EE, Baylin SB, Herman JG. p15(INK4B) CpG island methylation in primary acute leukemia is heterogeneous and suggests density as a critical factor for transcriptional silencing. Blood. 1999; 94:2445–51. [PubMed]
- 18. Lim AM, Candiloro IL, Wong N, Collins M, Do H, Takano EA, Angel C, Young RJ, Corry J, Wiesenfeld D, Kleid S, Sigston E, Lyons B, et al. Quantitative methodology is critical for assessing DNA methylation and impacts on correlation with patient outcome. Clin Epigenetics. 2014; 6:22. https://doi.org/10.1186/1868-7083-6-22 [PubMed]
- 19. Azhikina T, Kozlova A, Skvortsov T, Sverdlov E. Heterogeneity and degree of TIMP4, GATA4, SOX18, and EGFL7 gene promoter methylation in non-small cell lung cancer and surrounding tissues. Cancer Genet. 2011; 204:492–500. https://doi.org/10.1016/j.cancergen.2011.07.010 [PubMed]
- 20. Wojdacz TK, Windeløv JA, Thestrup BB, Damsgaard TE, Overgaard J, Hansen L. Identification and characterization of locus-specific methylation patterns within novel loci undergoing hypermethylation during breast cancer pathogenesis. Breast Cancer Res. 2014; 16:R17. https://doi.org/10.1186/bcr3612 [PubMed]
- 21. Menschikowski M, Jandeck C, Friedemann M, Richter S, Thiem D, Lange BS, Suttorp M. Identification and quantification of heterogeneously-methylated DNA fragments using epiallele-sensitive droplet digital polymerase chain reaction (EAST-ddPCR). Cancer Genomics Proteomics. 2018; 15:299–312. https://doi.org/10.21873/cgp.20088 [PubMed]
- 22. Horvath S. DNA methylation age of human tissues and cell types. Genome Biol. 2013; 14:R115. https://doi.org/10.1186/gb-2013-14-10-r115 [PubMed]
- 23. Cao Y. Environmental pollution and DNA methylation: carcinogenesis, clinical significance, and practical applications. Front Med. 2015; 9:261–74. https://doi.org/10.1007/s11684-015-0406-y [PubMed]
- 24. Ambatipudi S, Cuenin C, Hernandez-Vargas H, Ghantous A, Le Calvez-Kelm F, Kaaks R, Barrdahl M, Boeing H, Aleksandrova K, Trichopoulou A, Lagiou P, Naska A, Palli D, et al. Tobacco smoking-associated genome-wide DNA methylation changes in the EPIC study. Epigenomics. 2016; 8:599–618. https://doi.org/10.2217/epi-2016-0001 [PubMed]
- 25. Shukla SD, Velazquez J, French SW, Lu SC, Ticku MK, Zakhari S. Emerging role of epigenetics in the actions of alcohol. Alcohol Clin Exp Res. 2008; 32:1525–34. https://doi.org/10.1111/j.1530-0277.2008.00729.x [PubMed]
- 26. Zheng SC, Widschwendter M, Teschendorff AE. Epigenetic drift, epigenetic clocks and cancer risk. Epigenomics. 2016; 8:705–19. https://doi.org/10.2217/epi-2015-0017 [PubMed]
- 27. Bird A. DNA methylation patterns and epigenetic memory. Genes Dev. 2002; 16:6–21. https://doi.org/10.1101/gad.947102 [PubMed]
- 28. Zerihun MB, Vaillant C, Jost D. Effect of replication on epigenetic memory and consequences on gene transcription. Phys Biol. 2015; 12:026007. https://doi.org/10.1088/1478-3975/12/2/026007 [PubMed]
- 29. Cohen AR, Woods DF, Marfatia SM, Walther Z, Chishti AH, Anderson JM. Human CASK/LIN-2 binds syndecan-2 and protein 4.1 and localizes to the basolateral membrane of epithelial cells. J Cell Biol. 1998; 142:129–38. https://doi.org/10.1083/jcb.142.1.129 [PubMed]
- 30. Ryu HY, Lee J, Yang S, Park H, Choi S, Jung KC, Lee ST, Seong JK, Han IO, Oh ES. Syndecan-2 functions as a docking receptor for pro-matrix metalloproteinase-7 in human colon cancer cells. J Biol Chem. 2009; 284:35692–701. https://doi.org/10.1074/jbc.M109.054254 [PubMed]
- 31. Zimmermann P, David G. The syndecans, tuners of transmembrane signaling. FASEB J. 1999; 13:S91–100. https://doi.org/10.1096/fasebj.13.9001.s91 [PubMed]
- 32. Carey DJ. Syndecans: multifunctional cell-surface co-receptors. Biochem J. 1997; 327:1–16. https://doi.org/10.1042/bj3270001 [PubMed]
- 33. Esteller M. Epigenetics in cancer. N Engl J Med. 2008; 358:1148–59. https://doi.org/10.1056/NEJMra072067 [PubMed]
- 34. Park H, Kim Y, Lim Y, Han I, Oh ES. Syndecan-2 mediates adhesion and proliferation of colon carcinoma cells. J Biol Chem. 2002; 277:29730–36. https://doi.org/10.1074/jbc.M202435200 [PubMed]
- 35. Kwon MJ, Kim Y, Choi Y, Kim SH, Park S, Han I, Kang DH, Oh ES. The extracellular domain of syndecan-2 regulates the interaction of HCT116 human colon carcinoma cells with fibronectin. Biochem Biophys Res Commun. 2013; 431:415–20. https://doi.org/10.1016/j.bbrc.2012.12.155 [PubMed]
- 36. Wei JL, Fu ZX, Fang M, Zhou QY, Zhao QN, Guo JB, Lu WD, Wang H. High expression of CASK correlates with progression and poor prognosis of colorectal cancer. Tumour Biol. 2014; 35:9185–94. https://doi.org/10.1007/s13277-014-2179-3 [PubMed]
- 37. Zhou X, Xu G, Yin C, Jin W, Zhang G. Down-regulation of miR-203 induced by helicobacter pylori infection promotes the proliferation and invasion of gastric cancer by targeting CASK. Oncotarget. 2014; 5:11631–40. https://doi.org/10.18632/oncotarget.2600 [PubMed]
- 38. Wang Q, Lu J, Yang C, Wang X, Cheng L, Hu G, Sun Y, Zhang X, Wu M, Liu Z. CASK and its target gene reelin were co-upregulated in human esophageal carcinoma. Cancer Lett. 2002; 179:71–77. https://doi.org/10.1016/s0304-3835(01)00846-1 [PubMed]
- 39. Rosenbaum PR, Rubin DB. The Central Role of the Propensity Score in Observational Studies for Causal Effects. Biometrika. 1983; 70:41–55. https://doi.org/10.1093/biomet/70.1.41
- 40. Candiloro IL, Mikeska T, Hokland P, Dobrovic A. Rapid analysis of heterogeneously methylated DNA using digital methylation-sensitive high resolution melting: application to the CDKN2B (p15) gene. Epigenetics Chromatin. 2008; 1:7. https://doi.org/10.1186/1756-8935-1-7 [PubMed]
- 41. D’Agostino RB
Jr . Propensity score methods for bias reduction in the comparison of a treatment to a non-randomized control group. Stat Med. 1998; 17:2265–81. https://doi.org/10.1002/(sici)1097-0258(19981015)17:19<2265::aid-sim918>3.0.co;2-b [PubMed] - 42. Weinstein JN, Collisson EA, Mills GB, Shaw KR, Ozenberger BA, Ellrott K, Shmulevich I, Sander C, Stuart JM, and Cancer Genome Atlas Research Network. The cancer genome atlas pan-cancer analysis project. Nat Genet. 2013; 45:1113–20. https://doi.org/10.1038/ng.2764 [PubMed]
- 43. Cochran WG. The effectiveness of adjustment by subclassification in removing bias in observational studies. Biometrics. 1968; 24:295–313. [PubMed]
- 44. Oster B, Thorsen K, Lamy P, Wojdacz TK, Hansen LL, Birkenkamp-Demtröder K, Sørensen KD, Laurberg S, Orntoft TF, Andersen CL. Identification and validation of highly frequent CpG island hypermethylation in colorectal adenomas and carcinomas. Int J Cancer. 2011; 129:2855–66. https://doi.org/10.1002/ijc.25951 [PubMed]
- 45. Candiloro IL, Mikeska T, Dobrovic A. Assessing combined methylation-sensitive high resolution melting and pyrosequencing for the analysis of heterogeneous DNA methylation. Epigenetics. 2011; 6:500–07. https://doi.org/10.4161/epi.6.4.14853 [PubMed]
- 46. Daugaard I, Hussmann D, Kristensen L, Kristensen T, Kjeldsen TE, Nyvold CG, Larsen TS, Møller MB, Hansen LL, Wojdacz TK. Chronic lymphocytic leukemia patients with heterogeneously or fully methylated LPL promotor display longer time to treatment. Epigenomics. 2018; 10:1155–66. https://doi.org/10.2217/epi-2018-0020 [PubMed]
- 47. Kristensen LS, Wojdacz TK, Thestrup BB, Wiuf C, Hager H, Hansen LL. Quality assessment of DNA derived from up to 30 years old formalin fixed paraffin embedded (FFPE) tissue for PCR-based methylation analysis using SMART-MSP and MS-HRM. BMC Cancer. 2009; 9:453. https://doi.org/10.1186/1471-2407-9-453 [PubMed]
- 48. Wojdacz TK, Møller TH, Thestrup BB, Kristensen LS, Hansen LL. Limitations and advantages of MS-HRM and bisulfite sequencing for single locus methylation studies. Expert Rev Mol Diagn. 2010; 10:575–80. https://doi.org/10.1586/erm.10.46 [PubMed]
- 49. Dodge JE, List AF, Futscher BW. Selective variegated methylation of the p15 CpG island in acute myeloid leukemia. Int J Cancer. 1998; 78:561–67. https://doi.org/10.1002/(sici)1097-0215(19981123)78:5<561::aid-ijc6>3.0.co;2-r [PubMed]
- 50. Korshunova Y, Maloney RK, Lakey N, Citek RW, Bacher B, Budiman A, Ordway JM, McCombie WR, Leon J, Jeddeloh JA, McPherson JD. Massively parallel bisulphite pyrosequencing reveals the molecular complexity of breast cancer-associated cytosine-methylation patterns obtained from tissue and serum DNA. Genome Res. 2008; 18:19–29. https://doi.org/10.1101/gr.6883307 [PubMed]
- 51. Varley KE, Mutch DG, Edmonston TB, Goodfellow PJ, Mitra RD. Intra-tumor heterogeneity of MLH1 promoter methylation revealed by deep single molecule bisulfite sequencing. Nucleic Acids Res. 2009; 37:4603–12. https://doi.org/10.1093/nar/gkp457 [PubMed]
- 52. Aggerholm A, Guldberg P, Hokland M, Hokland P. Extensive intra- and interindividual heterogeneity of p15INK4B methylation in acute myeloid leukemia. Cancer Res. 1999; 59:436–41. [PubMed]
- 53. Daskalakis M, Nguyen TT, Nguyen C, Guldberg P, Köhler G, Wijermans P, Jones PA, Lübbert M. Demethylation of a hypermethylated P15/INK4B gene in patients with myelodysplastic syndrome by 5-aza-2'-deoxycytidine (decitabine) treatment. Blood. 2002; 100:2957–64. https://doi.org/10.1182/blood.V100.8.2957 [PubMed]
- 54. Cirilli M, Delfino I, Caboni E, Muleo R. EpiHRMAssay, in tube and in silico combined approach for the scanning and epityping of heterogeneous DNA methylation. Biol Methods Protoc. 2017; 2:bpw008. https://doi.org/10.1093/biomethods/bpw008 [PubMed]
- 55. Hussmann D, Hansen LL. Methylation-sensitive high resolution melting (MS-HRM). Methods Mol Biol. 2018; 1708:551–71. https://doi.org/10.1007/978-1-4939-7481-8_28 [PubMed]
- 56. Kraytsberg Y, Khrapko K. Single-molecule PCR: an artifact-free PCR approach for the analysis of somatic mutations. Expert Rev Mol Diagn. 2005; 5:809–15. https://doi.org/10.1586/14737159.5.5.809 [PubMed]
- 57. Denis JA, Nectoux J, Lamy PJ, Rouillac Le Sciellour C, Guermouche H, Alary AS, Kosmider O, Sarafan-Vasseur N, Jovelet C, Busser B, Nizard P, Taly V, Fina F. Development of digital PCR molecular tests for clinical practice: principles, practical implementation and recommendations. Ann Biol Clin (Paris). 2018; 76:505–23. https://doi.org/10.1684/abc.2018.1372 [PubMed]
- 58. Board RE, Knight L, Greystoke A, Blackhall FH, Hughes A, Dive C, Ranson M. DNA methylation in circulating tumour DNA as a biomarker for cancer. Biomark Insights. 2008; 2:307–19. [PubMed]
- 59. Lissa D, Robles AI. Methylation analyses in liquid biopsy. Transl Lung Cancer Res. 2016; 5:492–504. https://doi.org/10.21037/tlcr.2016.10.03 [PubMed]
- 60. Inoko H, Ando A, Ito M, Tsuji K. Southern hybridization analysis of DNA polymorphism in the HLA-D region. Hum Immunol. 1986; 16:304–13. https://doi.org/10.1016/0198-8859(86)90058-3 [PubMed]
- 61. Wojdacz TK, Dobrovic A, Hansen LL. Methylation-sensitive high-resolution melting. Nat Protoc. 2008; 3:1903–08. https://doi.org/10.1038/nprot.2008.191 [PubMed]
- 62. Wojdacz TK, Dobrovic A. Methylation-sensitive high resolution melting (MS-HRM): a new approach for sensitive and high-throughput assessment of methylation. Nucleic Acids Res. 2007; 35:e41. https://doi.org/10.1093/nar/gkm013 [PubMed]
- 63. Wojdacz TK, Hansen LL, Dobrovic A. A new approach to primer design for the control of PCR bias in methylation studies. BMC Res Notes. 2008; 1:54. https://doi.org/10.1186/1756-0500-1-54 [PubMed]
- 64. Gao HL, Wang X, Sun HR, Zhou JD, Lin SQ, Xing YH, Zhu L, Zhou HB, Zhao YS, Chi Q, Liu YP. Methylation status of transcriptional modulatory genes associated with colorectal cancer in northeast China. Gut Liver. 2018; 12:173–82. https://doi.org/10.5009/gnl17163 [PubMed]
- 65. Pohl G, Shih IeM. Principle and applications of digital PCR. Expert Rev Mol Diagn. 2004; 4:41–47. https://doi.org/10.1586/14737159.4.1.41 [PubMed]
- 66. Vogelstein B, Kinzler KW. Digital PCR. Proc Natl Acad Sci USA. 1999; 96:9236–41. https://doi.org/10.1073/pnas.96.16.9236 [PubMed]
- 67. Greenland S. Quantitative methods in the review of epidemiologic literature. Epidemiol Rev. 1987; 9:1–30. https://doi.org/10.1093/oxfordjournals.epirev.a036298 [PubMed]
- 68. Camp RL, Dolled-Filhart M, Rimm DL. X-tile: a new bio-informatics tool for biomarker assessment and outcome-based cut-point optimization. Clin Cancer Res. 2004; 10:7252–59. https://doi.org/10.1158/1078-0432.CCR-04-0713 [PubMed]