


Introduction
Tuberculosis (TB), a communicable respiratory disease, is major threat to human health in the world, especially in low and middle income countries in Asia [1–3]. There are approximately 10.4 million new cases and 1.7 million deaths worldwide in 2016 [4]. Although the advanced developments in diagnosis and treatment, accurate diagnosis of TB is still difficult and the healthcare and economic burdens of TB remain high. Complicated interactions among host, pathogen, and environmental factors contributed to the development of TB, of which the symptoms contain severe persistent coughing, fever, hemoptysis, chest pain and weight loss [5]. Family and twin studies [6–8] have reported that host genetic components play important roles in contributing risk to TB. Thereby, substantial interests in identifying the genetic components implicated in the aetiology of TB are growing.
In previous decades, TB has been a focus of many candidate gene-based and genome-wide association studies (GWAS). For candidate gene-based association studies on TB, which are dependent on a prior hypothesis that we know the knowledge of the functions of candidate genes, numerous genes with pressing single nucleotide polymorphisms (SNPs) have been identified to be associated with TB [9–15]. For example, genetic variations in TLR genes have reported to show associations with TB and clinical outcomes in previous studies [9–11]. With the advances of next-generation sequencing or microarray technology, the approach of GWAS based on powerful hypothesis-free methodology has been extensively applied to investigate the genetic architectures of complex diseases including TB and identify thousands of common risk SNPs. Since the first GWAS on TB was reported in the year of 2010 [16], subsequently many GWASs [17–25] have demonstrated associations between numerous common SNPs and TB among European and other ancestry populations. For example, there were 4 common SNPs identified to be significantly associated with TB via GWASs in Russian or African populations [16–18]. Nevertheless, despite intensifying GWAS studies have been conducted, much of the heritability of TB remains missing.
The vast majority of GWAS-identified significant or suggestive SNPs associated with complex diseases were located in non-coding genomic regions [8, 26]. Consistently, most of previously identified susceptibility variants associated with TB were mapped into non-coding regions [27]. Thus, it is plausible to infer that these GWAS-identified variants may have regulatory effects on influencing the expression level of specific gene instead of altering the function of its protein. A recent multi-cohort study [28] demonstrated that aberrant expression signature of a three-gene set (GBP5, DUSP3, and KLF2) is highly diagnostic for active TB. Furthermore, an accruing number of studies have concentrated on exploration of susceptibility genes whose aberrant expression are associated with diseases and traits of medical importance in humans due to pleiotropy [28–32]. For example, by using an integrative analysis of GWAS summary-level, mQTL and eQTL data, our team [33] previously found 34 important genes including PRKCZ, ARHGEF3, and CDKN1A with various critical SNPs contribute risk to the comorbidity of schizophrenia and smoking behaviors. Many novel risk genes identified by numerous integrative genomics studies were hard to be detected by a GWAS alone.
To the best of our knowledge, there was no systematical integrative genomics analysis on TB conducted to reveal the genome-wide regulatory effects of SNPs on gene expression. In the present study, we applied a two-stage designed analysis to identified risk SNPs, genes and pathways for TB. We first used the Sherlock integrative analysis to identify cis- and trans-regulatory effects of SNPs on expression abundance of interested genes via incorporating a large-scale GWAS summary dataset (N = 452,264) with a blood-based eQTL dataset (N = 1,490). Then, using the Sherlock analysis with same parameters, we adopted two independent eQTL datasets based on blood (N = 369) and lung tissue (N = 383) to replicate the results in the discovery stage. Furthermore, we employed a series of bioinformatics analyses including MAGMA analysis, in silico permutation analysis, pathways/diseases-based enrichment analysis, network-based enrichment analysis, DGIdb enrichment analysis, and co-expression analysis based on multi-omics data to highlight TB-associated risk genes with strong evidence.
Results
Identification of TB-associated genes in the discovery stage
In the discovery stage, we conducted a Sherlock Bayesian integrative analysis by incorporating GWAS summary statistics (Dataset #1; N = 452,264) with eQTL data (Dataset #3; N = 1,490) to identify aberrant expressed genes with eSNPs implicated in TB risk (Figure 1). There were a number of 694 genes identified to be significantly associated with TB risk (Gene set #1, Simulated P ≤ 0.05; Figure 2A and Supplementary Table 1). For example, the top-ranked significant genes were SIPA1L1 (Simulated P = 1.26 × 10⁻⁵), GSTA2 (Simulated P = 1.61 × 10⁻⁴), TIGD6 (Simulated P = 3.02 × 10⁻⁴), TSPYL4 (Simulated P = 4.22 × 10⁻⁴), and POLG2 (Simulated P = 4.68 × 10⁻⁴). Interestingly, among these identified significant genes, 4 genes of C2CD2, HLA-DRB6, HLA-DQB1, and LPCAT2 have been reported to be associated with TB in earlier studies (Supplementary Figure 1 and Supplementary Table 1). In addition, there existed 7 genes documented to be associated with respiratory relevant diseases, such as asthma and chronic obstructive pulmonary disease (Supplementary Figure 1 and Supplementary Table 1); and 38 genes identified to be associated with lung function and related diseases, such as lung cancer and adenocarcinoma (Supplementary Figure 1 and Supplementary Table 1).
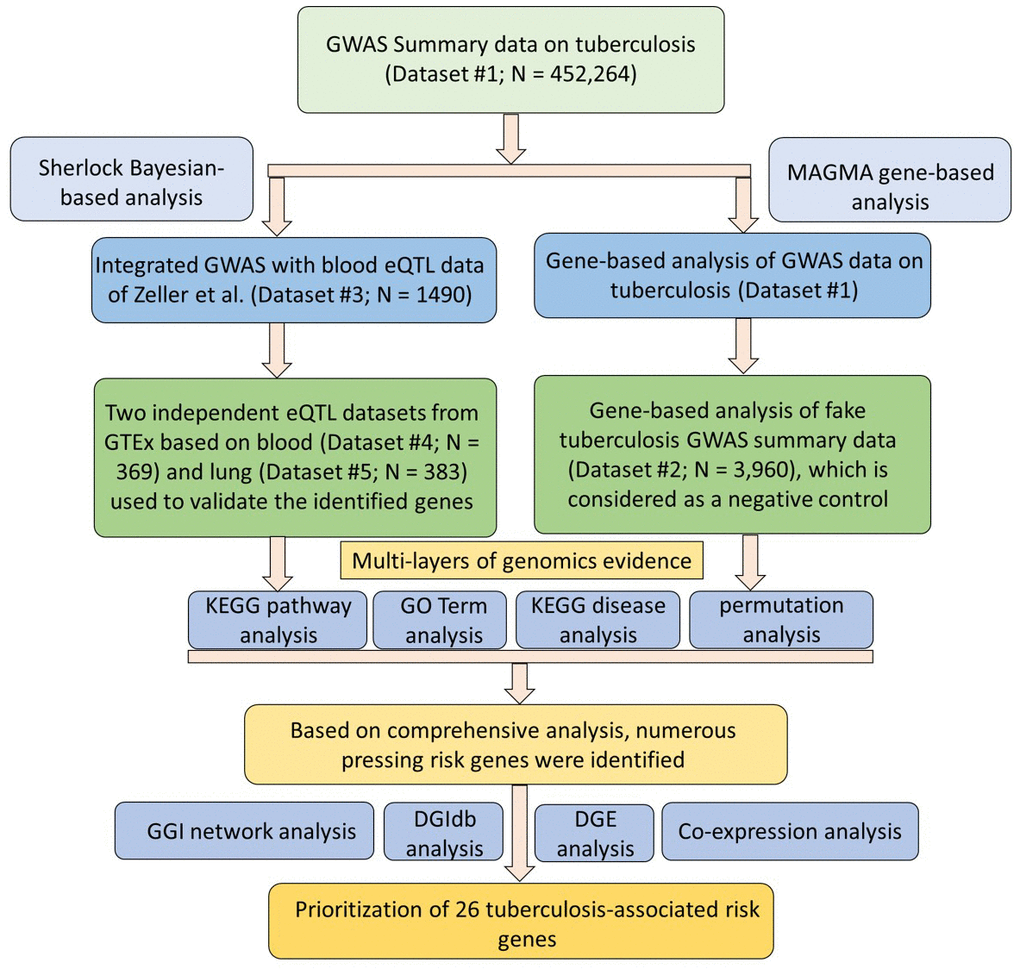
Figure 1. Workflow of current comprehensive genomics analysis.
Table 1. Sherlock-based Bayesian genomics analysis identifies 26 candidate genes associated with tuberculosis risk.
| Gene | Simulated P values in Gene set #1 | Simulated P values in Gene set #2 | Simulated P values in Gene set #3 | MAGMA-based P values in Gene set #4 | MAGMA-based P values in Gene set #5* | T-test P values in GSE133803 | Anova P values in GSE1440943 | Anova P values in GSE1440944 | Anova P values in GSE139825 | ||||||||||||||||||||||||||||||||||||||||||||||||||||||||||||||||||||||||||||||||||||||||||
| CDC16 | 6.21E-3 | 1.20E-2 | 1.38E-2 | 5.45E-3 | NA | 5.63E-4 | 8.16E-4 | 8.17E-2 | 8.34E-02 | ||||||||||||||||||||||||||||||||||||||||||||||||||||||||||||||||||||||||||||||||||||||||||
| HIATL1 | 1.51E-2 | 2.05E-2 | 1.16E-2 | 0.12 | 0.59 | 1.83E-7 | 7.33E-4 | 2.17E-2 | 0.11 | ||||||||||||||||||||||||||||||||||||||||||||||||||||||||||||||||||||||||||||||||||||||||||
| RCN3 | 2.01E-2 | 1.40E-2 | 7.14E-3 | 4.41E-3 | 0.81 | 8.73E-3 | 0.13 | 1.56E-2 | 0.78 | ||||||||||||||||||||||||||||||||||||||||||||||||||||||||||||||||||||||||||||||||||||||||||
| FCHO1 | 2.93E-2 | 1.31E-2 | 1.64E-2 | 3.53E-2 | 0.80 | 0.27 | 4.01E-2 | 9.03E-7 | 7.12E-03 | ||||||||||||||||||||||||||||||||||||||||||||||||||||||||||||||||||||||||||||||||||||||||||
| CDK10 | 3.08E-2 | 3.35E-2 | 3.70E-2 | 2.62E-2 | NA | 0.49 | 8.70E-3 | 8.92E-5 | 7.93E-02 | ||||||||||||||||||||||||||||||||||||||||||||||||||||||||||||||||||||||||||||||||||||||||||
| SCAPER | 3.60E-2 | 1.95E-2 | 1.62E-2 | 1.38E-2 | 0.20 | 8.84E-4 | 0.14 | 3.34E-2 | 0.65 | ||||||||||||||||||||||||||||||||||||||||||||||||||||||||||||||||||||||||||||||||||||||||||
| LIG3 | 3.98E-2 | 1.66E-2 | 3.73E-2 | 2.91E-2 | 0.28 | 1.86E-3 | 8.88E-2 | 2.23E-2 | 8.15E-02 | ||||||||||||||||||||||||||||||||||||||||||||||||||||||||||||||||||||||||||||||||||||||||||
| RRM1 | 4.82E-2 | 2.67E-2 | 2.04E-2 | 0.49 | 0.29 | 3.24E-3 | 1.29E-2 | 5.23E-4 | 0.11 | ||||||||||||||||||||||||||||||||||||||||||||||||||||||||||||||||||||||||||||||||||||||||||
| PDK1 | 3.79E-3 | 2.54E-2 | 1.87E-3 | 5.61E-3 | 3.51E-3 | 0.83 | 1.14E-2 | 7.84E-4 | 3.77E-02 | ||||||||||||||||||||||||||||||||||||||||||||||||||||||||||||||||||||||||||||||||||||||||||
| TMEM99 | 5.18E-3 | 1.86E-2 | 3.02E-3 | 1.36E-3 | 0.47 | 2.00E-3 | NA | NA | 0.11 | ||||||||||||||||||||||||||||||||||||||||||||||||||||||||||||||||||||||||||||||||||||||||||
| SPATA20 | 7.80E-3 | 4.13E-3 | 3.51E-3 | 4.55E-4 | 0.39 | 1.98E-3 | 0.23 | 0.38 | 2.23E-02 | ||||||||||||||||||||||||||||||||||||||||||||||||||||||||||||||||||||||||||||||||||||||||||
| TDRKH | 8.18E-3 | 1.01E-2 | 8.50E-3 | 1.17E-2 | 0.15 | 0.83 | 0.14 | 1.45E-3 | 7.42E-02 | ||||||||||||||||||||||||||||||||||||||||||||||||||||||||||||||||||||||||||||||||||||||||||
| NPHP4 | 1.15E-2 | 3.69E-2 | 2.98E-2 | 2.01E-2 | 0.35 | 0.32 | 0.42 | 8.73E-2 | 0.15 | ||||||||||||||||||||||||||||||||||||||||||||||||||||||||||||||||||||||||||||||||||||||||||
| CLN8 | 2.10E-2 | 1.13E-2 | 1.19E-2 | 1.46E-2 | 0.40 | 8.18E-6 | 0.10 | 0.17 | 1.04E-02 | ||||||||||||||||||||||||||||||||||||||||||||||||||||||||||||||||||||||||||||||||||||||||||
| DHX57 | 3.05E-2 | 1.48E-2 | 8.48E-3 | 1.19E-2 | 0.20 | 0.48 | 2.80E-2 | 0.10 | 0.18 | ||||||||||||||||||||||||||||||||||||||||||||||||||||||||||||||||||||||||||||||||||||||||||
| RPS5 | 3.71E-2 | 4.65E-2 | 4.41E-2 | 0.19 | 0.93 | 2.11E-4 | 3.73E-4 | 8.54E-2 | 2.71E-04 | ||||||||||||||||||||||||||||||||||||||||||||||||||||||||||||||||||||||||||||||||||||||||||
| MAP1S | 4.03E-2 | 8.39E-3 | 6.70E-3 | 1.30E-2 | 6.0E-2 | 1.01E-2 | NA | NA | 0.78 | ||||||||||||||||||||||||||||||||||||||||||||||||||||||||||||||||||||||||||||||||||||||||||
| HDAC10 | 2.34E-3 | 2.36E-2 | 2.53E-2 | 0.21 | NA | 0.42 | 0.15 | 4.23E-2 | 0.89 | ||||||||||||||||||||||||||||||||||||||||||||||||||||||||||||||||||||||||||||||||||||||||||
| TBRG4 | 1.67E-2 | 4.53E-2 | 3.66E-2 | 0.25 | 0.80 | 0.11 | 0.11 | 2.99E-3 | 0.28 | ||||||||||||||||||||||||||||||||||||||||||||||||||||||||||||||||||||||||||||||||||||||||||
| CARD9 | 1.73E-2 | 3.86E-2 | 1.74E-2 | 0.13 | NA | 5.48E-2 | NA | NA | 0.21 | ||||||||||||||||||||||||||||||||||||||||||||||||||||||||||||||||||||||||||||||||||||||||||
| ZNF354A | 1.74E-2 | 3.75E-2 | 4.14E-2 | 2.74E-2 | 0.98 | 0.29 | NA | NA | 3.80E-02 | ||||||||||||||||||||||||||||||||||||||||||||||||||||||||||||||||||||||||||||||||||||||||||
| ZNF266 | 3.66E-2 | 3.94E-2 | 3.09E-2 | 1.09E-2 | 0.41 | 0.11 | NA | NA | 0.18 | ||||||||||||||||||||||||||||||||||||||||||||||||||||||||||||||||||||||||||||||||||||||||||
| ZNF502 | 4.23E-2 | 2.18E-2 | 1.99E-2 | 1.23E-2 | 0.53 | 0.14 | NA | NA | 0.14 | ||||||||||||||||||||||||||||||||||||||||||||||||||||||||||||||||||||||||||||||||||||||||||
| ZNF197 | 4.32E-2 | 1.81E-2 | 2.57E-2 | 9.53E-4 | 0.71 | 5.40E-2 | NA | NA | 6.69E-03 | ||||||||||||||||||||||||||||||||||||||||||||||||||||||||||||||||||||||||||||||||||||||||||
| NUDT13 | 3.27E-2 | 3.78E-2 | 3.57E-2 | 6.0E-2 | 0.78 | 0.28 | 0.41 | 0.56 | 0.22 | ||||||||||||||||||||||||||||||||||||||||||||||||||||||||||||||||||||||||||||||||||||||||||
| RPS23 | 7.88E-7 | 2.22E-2 | 1.66E-2 | 0.54 | 2.26E-2 | 5.45E-5 | 0.24 | 0.82 | 0.49 | ||||||||||||||||||||||||||||||||||||||||||||||||||||||||||||||||||||||||||||||||||||||||||
| Note: NA means not available, which were largely due to that the expression levels of these genes very lower or the qualities were not feasible. | |||||||||||||||||||||||||||||||||||||||||||||||||||||||||||||||||||||||||||||||||||||||||||||||||||
| *Gene set #5 is generated from MAGMA analysis on fake tuberculosis as a negative control. | |||||||||||||||||||||||||||||||||||||||||||||||||||||||||||||||||||||||||||||||||||||||||||||||||||
To annotate the molecular functions and biological pathways of these 694 identified genes, we performed a functional enrichment analysis by using the KOBAS tool. As for pathway enrichment analysis, 305 pathways were significantly enriched by these TB-associated genes (FDR ≤ 0.05; Figure 2B and Supplementary Table 2). For example, the pathways of metabolism (FDR = 1.78 × 10⁻²⁸), immune system (FDR = 2.12 × 10⁻²¹), metabolic pathways (FDR = 7.75 × 10⁻¹⁹), and tuberculosis (FDR = 4.44 × 10⁻⁵). Furthermore, 231 GO-terms (FDR ≤ 0.05; Figure 2C and Supplementary Table 3) and 50 diseases-terms (FDR ≤ 0.05; Figure 2D and Supplementary Table 4) were significantly overrepresented by these TB-relevant genes.
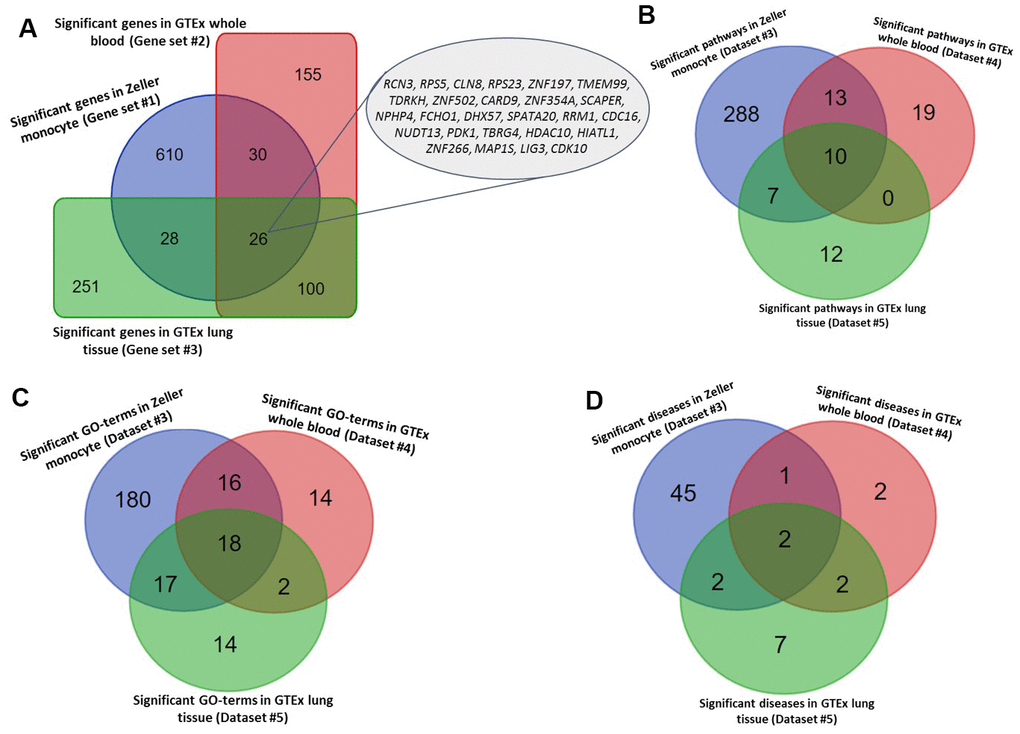
Figure 2. Identified tuberculosis-related risk genes, pathways, and GO-terms. (A) Common significant genes identified from the Sherlock analysis based on Gene sets #1, #2, and #3. (B) Common significant pathways enriched by genes identified from the Sherlock analysis cross 3 gene sets (i.e., Gene sets #1, #2, and #3). (C) Common significant GO-terms enriched by genes identified from the Sherlock analysis cross 3 gene sets (i.e., Gene sets #1, #2, and #3). (D) Common significant KEGG or NHGRI GWAS Catalog diseases enriched by genes identified from the Sherlock analysis cross 3 gene sets (i.e., Gene sets #1, #2, and #3).
Table 2. 10 common pathways enriched by tuberculosis-associated genes across 3 identified gene sets.
| Pathway ID | Common pathways | Gene set #1 | Gene set #2 | Gene set #3 | |||||||||||||||||||||||||||||||||||||||||||||||||||||||||||||||||||||||||||||||||||||||||||||||
| Proportion of risk genes | FDR | Proportion of risk genes | FDR | Proportion of risk genes | FDR | ||||||||||||||||||||||||||||||||||||||||||||||||||||||||||||||||||||||||||||||||||||||||||||||
| R-HSA-1430728 | Metabolism | 4.96% | 1.78E-28 | 1.35% | 1.19E-4 | 1.69% | 3.16E-5 | ||||||||||||||||||||||||||||||||||||||||||||||||||||||||||||||||||||||||||||||||||||||||||||
| R-HSA-74160 | Gene expression (Transcription) | 4.97% | 1.06E-19 | 1.17% | 1.90E-2 | 1.80% | 1.24E-4 | ||||||||||||||||||||||||||||||||||||||||||||||||||||||||||||||||||||||||||||||||||||||||||||
| R-HSA-392499 | Metabolism of proteins | 3.93% | 3.94E-16 | 1.29% | 3.72E-4 | 1.64% | 5.19E-5 | ||||||||||||||||||||||||||||||||||||||||||||||||||||||||||||||||||||||||||||||||||||||||||||
| R-HSA-73857 | RNA Polymerase II Transcription | 4.71% | 8.33E-16 | 1.22% | 1.90E-2 | 1.67% | 1.37E-3 | ||||||||||||||||||||||||||||||||||||||||||||||||||||||||||||||||||||||||||||||||||||||||||||
| R-HSA-212436 | Generic Transcription Pathway | 4.78% | 7.63E-15 | 1.17% | 3.79E-2 | 1.84% | 4.24E-4 | ||||||||||||||||||||||||||||||||||||||||||||||||||||||||||||||||||||||||||||||||||||||||||||
| R-HSA-597592 | Post-translational protein modification | 4.32% | 4.60E-14 | 1.42% | 1.09E-3 | 1.63% | 1.34E-3 | ||||||||||||||||||||||||||||||||||||||||||||||||||||||||||||||||||||||||||||||||||||||||||||
| R-HSA-5653656 | Vesicle-mediated transport | 5.38% | 1.36E-10 | 1.64% | 1.68E-2 | 1.79% | 3.09E-2 | ||||||||||||||||||||||||||||||||||||||||||||||||||||||||||||||||||||||||||||||||||||||||||||
| R-HSA-1643685 | Disease | 4.29% | 3.11E-10 | 1.81% | 1.33E-4 | 1.43% | 4.22E-2 | ||||||||||||||||||||||||||||||||||||||||||||||||||||||||||||||||||||||||||||||||||||||||||||
| R-HSA-199991 | Membrane Trafficking | 5.23% | 2.17E-9 | 1.74% | 1.10E-2 | 1.74% | 4.22E-2 | ||||||||||||||||||||||||||||||||||||||||||||||||||||||||||||||||||||||||||||||||||||||||||||
| R-HSA-382551 | Transport of small molecules | 3.33% | 7.01E-4 | 1.53% | 2.19E-2 | 1.67% | 3.98E-2 | ||||||||||||||||||||||||||||||||||||||||||||||||||||||||||||||||||||||||||||||||||||||||||||
| Note: Proportion of risk genes: these identified risk genes accounted for the proportion of all genes in each pathway enriched by these genes. FDR values were calculated by using the method of Benjamini-Hochberg false discovery rate (FDR) correction. | |||||||||||||||||||||||||||||||||||||||||||||||||||||||||||||||||||||||||||||||||||||||||||||||||||
Validation of TB-associated genes in the replication stage
Furthermore, we utilized two independent eQTL datasets (Datasets #4 and #5) to carry out the Sherlock Bayesian analysis with same parameters for validation. Based on these two independent datasets, we identified 311 significant genes for Dataset #4 based on whole blood samples (Gene set #2, Simulated P ≤ 0.05; Supplementary Table 5) and 405 significant genes for Dataset #5 based on lung tissues (Gene set #3, Simulated P ≤ 0.05; Supplementary Table 6). Among these genes, 3 genes of ESPPRB, GLRX5, and LRPAP1 have been reported to be linked with TB in earlier studies (Supplementary Figure 2). 30 and 18 genes have been documented to be associated with lung-related diseases (Supplementary Table 5) and respiratory-related diseases (Supplementary Table 6), separately. Interestingly, there existed 7 genes showing associations with both lung-related diseases and respiratory disease (Supplementary Figure 2). Compared with genes identified in the discovery stage (Gene set #1), we found 26 genes were significantly replicated by the Sherlock analysis of both datasets in the replication stage (Gene sets #2 and #3) (Figure 2A and Table 1). Most of these 26 highlighted genes were highly expressed in human lung tissue (Supplementary Figures 3–15).
For the functional enrichment analyses of these two gene sets, 40 pathways, 50 GO-terms, and 7 diseases-terms (FDR ≤ 0.05; Supplementary Tables 7–9) were significantly overrepresented by Gene set #2, as well as 29 pathways, 51 GO-terms, and 13 diseases-terms (FDR ≤ 0.05; and Supplementary Tables 10–12) were significantly enriched by Gene set #3. Furthermore, we found 10 common pathways, 18 common GO-terms, and 2 common enriched diseases (FDR ≤ 0.05; Figure 2B–2D, Tables 2, 3, and Supplementary Table 13) were significantly enriched by all the 3 independent gene sets.
Table 3. 18 common GO-terms enriched by tuberculosis-associated genes across 3 identified gene sets.
| GO-terms ID | GO-terms | Gene set #1 | Gene set #2 | Gene set #3 | |||||||||||||||||||||||||||||||||||||||||||||||||||||||||||||||||||||||||||||||||||||||||||||||
| Proportion of risk genes | FDR | Proportion of risk genes | FDR | Proportion of risk genes | FDR | ||||||||||||||||||||||||||||||||||||||||||||||||||||||||||||||||||||||||||||||||||||||||||||||
| GO:0005622 | Intracellular | 4.44% | 4.09E-24 | 1.26% | 2.89E-4 | 1.53% | 1.07E-4 | ||||||||||||||||||||||||||||||||||||||||||||||||||||||||||||||||||||||||||||||||||||||||||||
| GO:0110165 | Cellular Anatomical Entity | 3.77% | 2.12E-21 | 0.91% | 2.42E-2 | 1.47% | 3.36E-5 | ||||||||||||||||||||||||||||||||||||||||||||||||||||||||||||||||||||||||||||||||||||||||||||
| GO:0044237 | Cellular Metabolic Process | 3.80% | 4.45E-15 | 1.04% | 1.97E-2 | 1.18% | 3.51E-2 | ||||||||||||||||||||||||||||||||||||||||||||||||||||||||||||||||||||||||||||||||||||||||||||
| GO:0043227 | Membrane-Bounded Organelle | 3.79% | 4.45E-15 | 1.33% | 1.74E-4 | 1.63% | 5.19E-5 | ||||||||||||||||||||||||||||||||||||||||||||||||||||||||||||||||||||||||||||||||||||||||||||
| GO:0043229 | Intracellular Organelle | 3.76% | 1.97E-13 | 1.77% | 8.74E-8 | 1.61% | 1.36E-4 | ||||||||||||||||||||||||||||||||||||||||||||||||||||||||||||||||||||||||||||||||||||||||||||
| GO:0005488 | Binding | 3.47% | 2.19E-13 | 1.38% | 4.34E-5 | 1.56% | 5.19E-5 | ||||||||||||||||||||||||||||||||||||||||||||||||||||||||||||||||||||||||||||||||||||||||||||
| GO:0005737 | Cytoplasm | 3.90% | 5.71E-13 | 1.46% | 1.63E-4 | 1.40% | 8.80E-3 | ||||||||||||||||||||||||||||||||||||||||||||||||||||||||||||||||||||||||||||||||||||||||||||
| GO:0005515 | Protein Binding | 3.85% | 5.71E-13 | 1.24% | 3.39E-3 | 1.90% | 1.41E-5 | ||||||||||||||||||||||||||||||||||||||||||||||||||||||||||||||||||||||||||||||||||||||||||||
| GO:1901363 | Heterocyclic Compound Binding | 5.17% | 6.56E-12 | 1.60% | 6.97E-3 | 2.09% | 9.91E-4 | ||||||||||||||||||||||||||||||||||||||||||||||||||||||||||||||||||||||||||||||||||||||||||||
| GO:0019222 | Regulation Of Metabolic Process | 3.83% | 5.78E-8 | 1.68% | 4.24E-4 | 2.15% | 5.19E-5 | ||||||||||||||||||||||||||||||||||||||||||||||||||||||||||||||||||||||||||||||||||||||||||||
| GO:0016787 | Hydrolase Activity | 4.72% | 4.28E-7 | 1.52% | 4.74E-2 | 1.85% | 3.47E-2 | ||||||||||||||||||||||||||||||||||||||||||||||||||||||||||||||||||||||||||||||||||||||||||||
| GO:0031982 | Vesicle | 4.20% | 3.60E-6 | 1.95% | 1.57E-3 | 1.95% | 1.14E-2 | ||||||||||||||||||||||||||||||||||||||||||||||||||||||||||||||||||||||||||||||||||||||||||||
| GO:0008152 | Metabolic Process | 2.45% | 2.16E-5 | 1.03% | 6.97E-3 | 1.19% | 1.14E-2 | ||||||||||||||||||||||||||||||||||||||||||||||||||||||||||||||||||||||||||||||||||||||||||||
| GO:0005654 | Nucleoplasm | 4.43% | 5.31E-5 | 2.11% | 6.08E-3 | 2.11% | 2.70E-2 | ||||||||||||||||||||||||||||||||||||||||||||||||||||||||||||||||||||||||||||||||||||||||||||
| GO:0000166 | Nucleotide Binding | 4.51% | 3.62E-4 | 1.86% | 4.95E-2 | 3.45% | 1.24E-4 | ||||||||||||||||||||||||||||||||||||||||||||||||||||||||||||||||||||||||||||||||||||||||||||
| GO:0003723 | Rna Binding | 5.16% | 1.42E-2 | 3.87% | 6.80E-3 | 4.52% | 3.95E-3 | ||||||||||||||||||||||||||||||||||||||||||||||||||||||||||||||||||||||||||||||||||||||||||||
| GO:1901265 | Nucleoside Phosphate Binding | 3.35% | 2.00E-2 | 2.32% | 6.61E-3 | 2.32% | 2.70E-2 | ||||||||||||||||||||||||||||||||||||||||||||||||||||||||||||||||||||||||||||||||||||||||||||
| GO:1990904 | Ribonucleoprotein Complex | 6.33% | 3.85E-2 | 5.06% | 2.19E-2 | 6.33% | 9.07E-3 | ||||||||||||||||||||||||||||||||||||||||||||||||||||||||||||||||||||||||||||||||||||||||||||
| Note: Proportion of risk genes: these identified risk genes accounted for the proportion of all genes in each pathway enriched by these genes. FDR values were calculated by using the method of Benjamini-Hochberg false discovery rate (FDR) correction. | |||||||||||||||||||||||||||||||||||||||||||||||||||||||||||||||||||||||||||||||||||||||||||||||||||
MAGMA-based gene analysis for technical replication
By performing MAGMA gene-level analysis of TB-based GWAS, we identified 1,017 genes were significantly or suggestively associated with TB (Gene set #4, MAGMA-based P ≤ 0.05; Supplementary Table 14). Among them, 128 genes have been documented to be associated with TB or at least one of other respiratory related traits or diseases in the database of GWAS Catalog (Supplementary Figure 16 and Supplementary Table 14). Compared with 3 independent Sherlock-identified gene sets, 18 of 26 common genes were significantly replicated by using MAGMA analysis (Figure 3A and Table 1). As a negative control, genes identified from MAGMA analysis on fake TB (Gene set #5) have obviously lower overlap with Sherlock-identified common genes than those with genes from MAGMA analysis on TB (Figure 3B and Table 1). In addition, we used the MAGMA tool to perform a pathway enrichment analysis based on the KEGG pathway resource. We found that 19 pathways showed significant or suggestive enrichment (P < 0.05). Of them, 15 pathways were enriched by genes identified from Sherlock analysis in the discovery stage (P < 0.05, Supplementary Table 15).
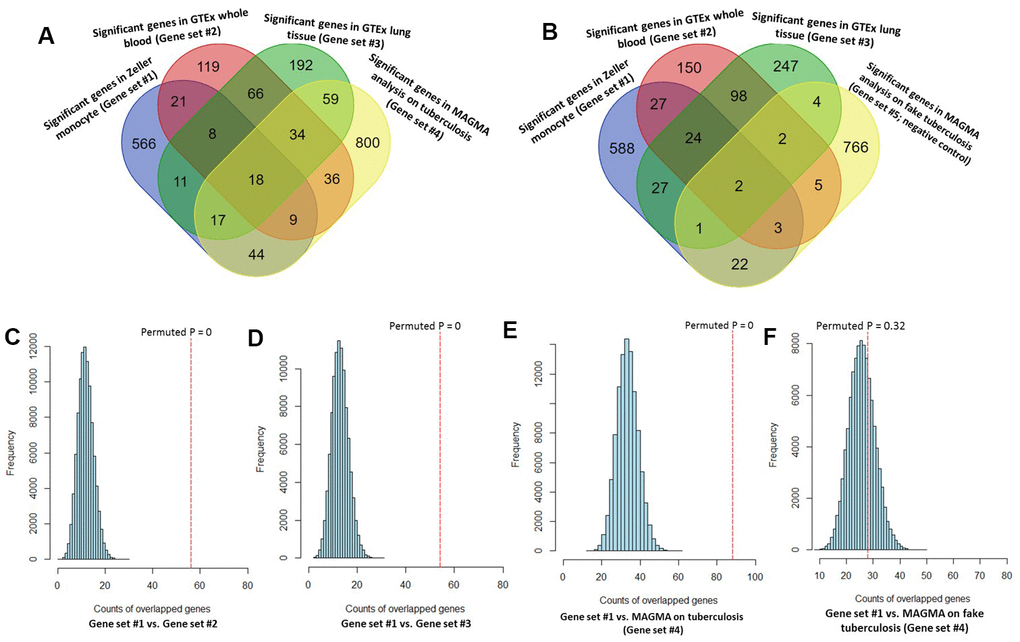
Figure 3. Consistent evidence support Sherlock-identified genes implicated in tuberculosis (TB). (A) Venn diagram shows that common genes between Sherlock-identified genes of Gene sets #1, #2, and #3 and MAGMA-identified genes on TB (Gene set #4). (B) Venn diagram shows that common genes between Sherlock-identified genes of Gene sets #1, #2, and #3 and MAGMA-identified genes on fake TB (Gene set #5). (C–F) Computer-based permutation analysis; (C) for the overlap between Gene set #1 and Gene set #2; (D) for the overlap between Gene set #1 and Gene set #3; (E) for the overlap between Gene set #1 and Gene set #4; (F) for the overlap between Gene set #1 and Gene set #5.
Consistently, by using permutation analyses, genes identified from the discovery stage (Gene set #1) were significantly higher overlapped with identified genes from Gene sets #2, #3, and #4 in the replication stage than that of 100,000 times of random selections (Permuted P = 0, 0, 0 separately; Figure 3C–3E). Furthermore, there was no difference in overlap between genes from Gene set #1 with genes from Gene set #5 and genes from random selections (Permuted P = 0.32; Figure 3F). Additionally, to further determine whether these identified TB-associated genes were due to genetic determinants rather than false discoveries, we compared the results from MAGMA analysis on TB (Gene set #4) and fake TB (Gene set #5) with significant genes identified from 3 times of independent Sherlock analyses (Gene sets #1, #2, and #3) at 3 distinct P value thresholds (i.e., P = 0.05, 0.01, or 0.001), respectively. Consistently, we found that the overlapped gene rates between Sherlock-identified genes and MAGMA-identified genes were remarkably higher than that with MAGMA analysis on fake TB across 3 different thresholds (Figure 4A–4C). Together, these results further confirm that our identified genes are potentially convincing candidate genes for TB.
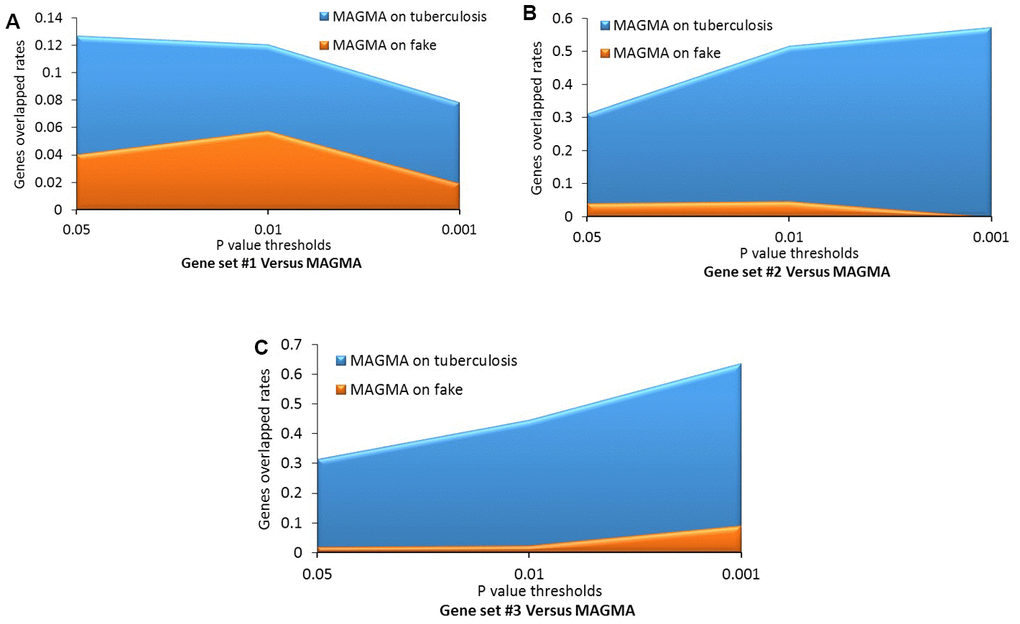
Figure 4. Comparative analysis of genes identified from the Sherlock analysis with that from the MAGMA analysis of tuberculosis (TB) and fake TB. (A) Gene set #1 versus MAGMA; (B) Gene set #2 versus MAGMA; (C) Gene set #3 versus MAGMA.
GGI network constructed by 26 highlighted TB-risk genes
Based on independent biological and technical replications, we highlighted 26 genes as important candidates conferring susceptibility to TB. Based on these 26 genes, we performed a GGI network enrichment analysis. Figure 5 demonstrates that most of these highlighted genes were highly connected with each other. The majority of interactions in the constructed network were depended on co-expression, which accounted for 71.52% of interactions (Supplementary Table 16 and Supplementary Figure 17). For example, the hub gene of RPS5 had co-expression evidence with NPHP4 and PDK1. Furthermore, the hub gene of RPS23 showed a genetic interaction with SCAPER, as well as the SCAPER gene interacted with TDRKH based on evidence of genetic interactions. It should be noted that 5 TB-associated genes of CLN8, TMEM99, CARD9, SPATA20, and DHX57 had no interactions with other genes in this constructed network (Figure 5).
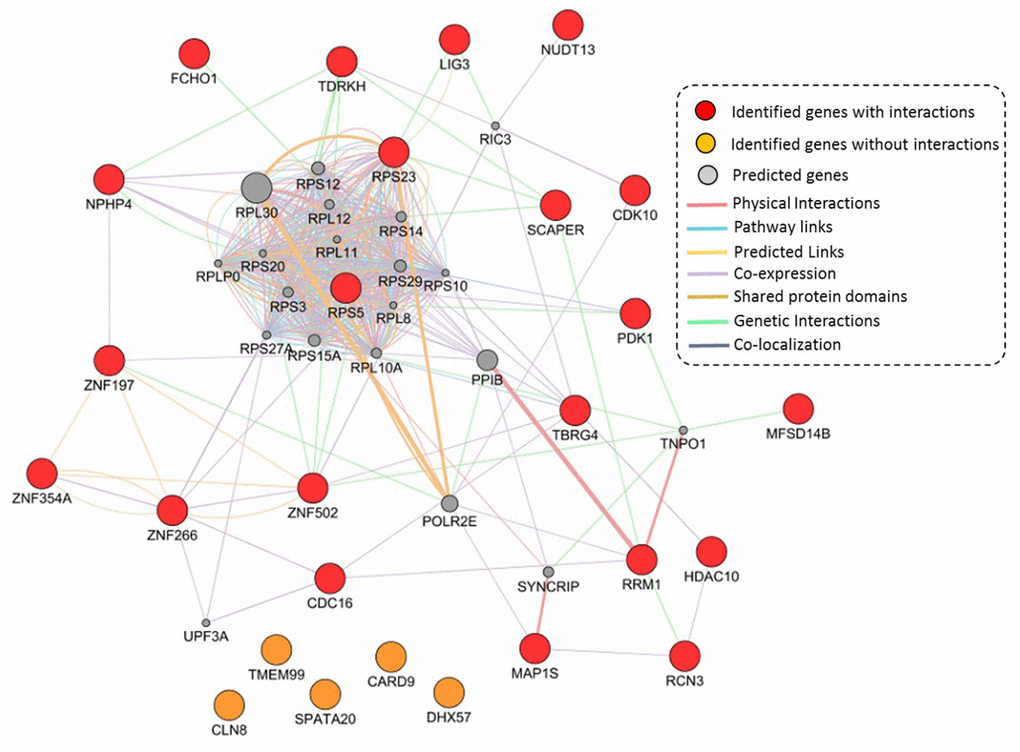
Figure 5. Constructed GGI network by using identified 26 TB-associated genes. These 21 identified genes with interactions are marked with red color, 5 identified genes without interactions are marked with orange color, and 20 predicted genes are colored with gray color.
Differential gene expression analysis of these 26 highlighted genes
By utilizing the expression data of GSE133803, we performed a DGE analysis of these 26 highlighted genes and found 12 genes were significantly expressed between MTB-infected cells and controls (Figure 6A, Table 1, and Supplementary Table 17); for example, CDC16 (P = 5.63 × 10⁻⁴), RPS5 (P = 2.11 × 10⁻⁴), HIATL1 (P = 1.83 × 10⁻⁷), and RPS23 (P = 5.45 × 10⁻⁵). 2 genes of CARD9 (P = 0.055) and ZNF197 (P = 0.054) were identified to be suggestively significant (Supplementary Table 17). In light of most of interactions among genes were derived from co-expression (71.52%) in our GGI network analysis, we further conducted a Pearson correlation analysis to uncover whether the co-expression patterns of these highlighted genes altered or not between MTB-infected cells and uninfected cells. We detected that there was remarkable differences in co-expression patterns among 26 highlighted genes between MTB-infected cells and uninfected cells (Figure 6B, 6C and Supplementary Tables 18, 19). For example, the positive correlation coefficient of RPS23 with NUDT13 was decreased from 0.99 in uninfected cells to 0.34 in MTB-infected cells. Furthermore, the correlation coefficient between RCN3 and CLN8 was changed from 0.41 in uninfected cells to -0.92 in MTB-infected cells.
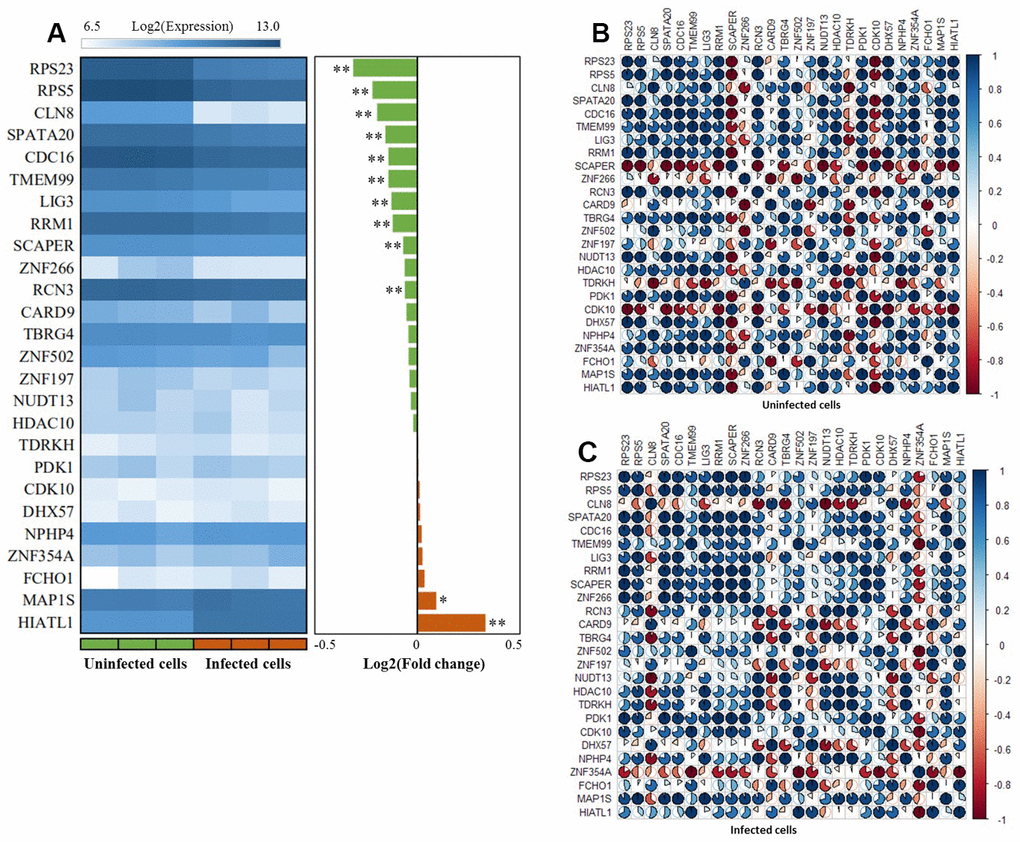
Figure 6. The expression patterns of these 26 risk genes between infected cells and uninfected cells based on the GSE133803 dataset. (A) Heatmap showing the expression levels of 26 risk genes between infected cells and uninfected cells; * represents the t-test P value < 0.05, ** represents the t-test P value < 0.01; (B) The co-expression patterns of 26 risk genes based on the Pearson correlation analysis in uninfected cells; (C) The co-expression patterns of 26 risk genes based on the Pearson correlation analysis in infected cells.
By analyzing the GSE1440943 dataset based on blood samples, 8 significant genes and 1 suggestive genes showed differential expressions between MTB-infected mice with 5 different time points and uninfected mice (Table 1, Figure 7 and Supplementary Figure 18). Furthermore, we analyzed the GSE1440944 dataset based on lung tissues and identified 11 significant genes and 3 suggestive genes have differential expressions between MTB-infected with 5 different time points and uninfected mice (Table 1, Figure 7 and Supplementary Figure 19). There existed a consistent finding of significant genes between both datasets (Table 1 and Figure 7). For example, 2 genes of FCHO1 and RPS5 showed significantly higher expression in MTB-infected mice at 5 time points than in uninfected mice in both blood (Figure 7A: Anova P = 0.04; and Figure 7C: Anova P = 3.73 × 10⁻⁴) and lung samples (Figure 7B: Anova P = 9.03 × 10⁻⁷ and Figure 7D: Anova P = 0.085). Consistently, by using the dataset of GSE139825 based on human alveolar macrophages, 7 significant genes (Anova P < 0.05; Supplementary Figure 20) and 4 suggestive genes (Anova P < 0.1; Supplementary Figure 21) showed differential expressions between TB group and control group. For example, RPS5 (Anova P = 2.74 × 10⁻⁴) and FCHO1 (Anova P = 7.12 × 10⁻³).
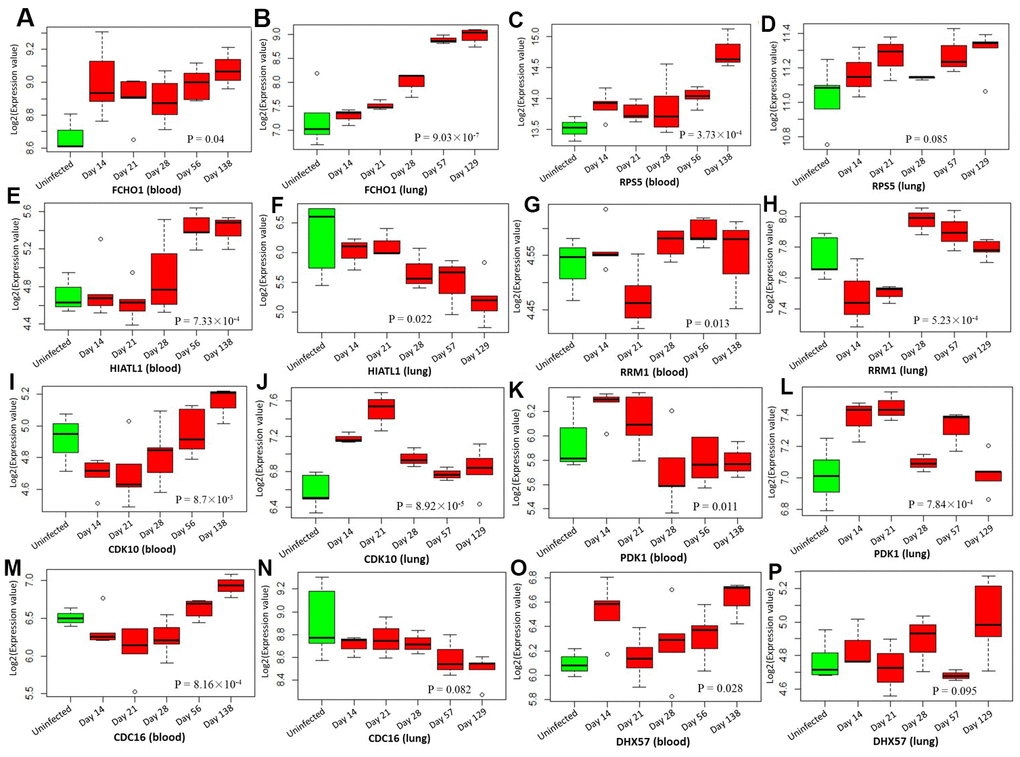
Figure 7. Boxplots show the differential expression levels of tuberculosis-risk genes between uninfected mice and infected mice with 5 distinct time points based on two GSE1440943 (blood) and GSE1440944 (lung) datasets. (A) FCHO1 for blood; (B) FCHO1 for lung; (C) RPS5 for blood; (D) RPS5 for lung; (E) HIATL1 for blood; (F) HIATL1 for lung; (G) RRM1 for blood; (H) RRM1 for lung; (I) CDK10 for blood; (J) CDK10 for lung; (K) PDK1 for blood; (L) PDK1 for lung; (M) CDC16 for blood; (N) CDC16 for lung; (O) DHX57 for blood; (P) DHX57 for lung. P values were generated by Anova test.
Identification of risk eSNPs among these 26 highlighted TB-risk genes
For each highlighted gene, there were multiple eSNPs showing significant association with the expression of this gene and TB risk simultaneously (Supplementary Table 20). To name a few, with respect to the gene of CDC16, 2 cis-regulatory eSNPs of rs7987202 (PeQTL = 4.70 × 10⁻¹³ and PGWAS = 2.53 × 10⁻³) and rs9590408 (PeQTL = 3.79 × 10-49 and PGWAS = 2.02 × 10⁻³) and 1 trans-regulatory eSNPs of rs948182 (PeQTL = 4.13 × 10⁻⁶ and PGWAS = 2.01 × 10⁻²) were identified. 1 eSNP of rs3118766 (PeQTL = 5.45 × 10⁻⁷ and PGWAS = 7.32 × 10⁻⁴) has cis-regulatory effect on HIATL1 gene. 3 eSNPs of rs2946863 (PeQTL = 3.26 × 10⁻⁷ and PGWAS = 6.42 × 10⁻³), rs2878342 (PeQTL = 2.70 × 10⁻¹² and PGWAS = 3.82 × 10⁻³), rs3810194 (PeQTL = 6.65 × 10⁻⁶ and PGWAS = 1.43 × 10⁻²) have cis-regulatory functions on RCN3 gene. Furthermore, with regard to FCHO1 gene, 3 cis-eSNPs (rs4280376: PeQTL = 1.95 × 10⁻¹⁰ and PGWAS = 5.86 × 10⁻², rs4808683: PeQTL = 9.98 × 10⁻¹⁵ and PGWAS = 3.39 × 10⁻³, rs8107550: PeQTL = 2.85 × 10⁻⁶ and PGWAS = 4.40 × 10⁻³) and 1 trans-eSNP (rs1058348: PeQTL = 3.24 × 10⁻⁷ and PGWAS = 2.78 × 10⁻²) were identified.
Discussion
TB is an infectious disease and remains a leading public health problem in developing world and an increasing threat in developed countries [1–3]. There were approximately one third of the world populations estimated to be infected with the TB pathogen, Mycobacterium tuberculosis, but only about 10% of infected individuals eventually become active TB patients [3], suggesting genetic heterogeneity potentially contribute differential susceptibility to infection. Consistently, host genetic factors having important roles in determining susceptibility to Mycobacterium tuberculosis are well-indicated by twin, family linkage, candidate gene analyses, and mouse models [6–8, 34, 35]. Hitherto, more than 10 GWASs on TB have been reported [17–25], and many TB-associated genetic loci have been identified and documented in the NHGRI GWAS Catalog [36]. Nevertheless, some identified genetic variants were hard to be replicated [37, 38], which could be attributed to the genetic heterogeneity of samples used, underpowered GWASs, or small effect sizes of variants. Lack of replications lead to these GWAS-identified SNPs have not translated into clinical practice so far. Thus, there exists a strong interest in improving our understanding of the pathophysiological mechanisms of genetic components on TB with the use of advanced genetics- and genomics-based methods.
For the method of GWAS, it has been widely used to identify genetic loci conveying risk to complex diseases [39]. With the use of GWAS, a growing and large number of SNPs have been documented to be of significant associations with hundreds of phenotypes [36, 40, 41]. However, due to the stringent correction for multiple testing of GWAS, many SNPs with small-to-moderate effects which not reach a genome-wide significance but have important functional roles were largely neglected. In light of many SNP-SNP pairs have highly LD accompanied with similar level of significance when calculate the P-values, thus to pinpoint the exact causative variants of these GWAS-identified associations is still a big challenge. Generally, a large proportion of identified risk SNPs were annotated into noncoding regions of genome in GWASs on complex diseases including TB [8, 26, 28], indicating these SNPs may influence the gene expression levels by cis- and/or trans-regulatory mechanisms to involve in TB risk. Considerable work on exploring the links between genetic variants and RNA expression is interested and warranted. For our current study, we conducted an integrative genomics analysis by combining multi-layers of omics data, including genomics, eQTL, RNA expression, eSNPs, and gene-gene interactions, to identify more susceptible SNPs, genes, and pathways implicated in the etiology of TB risk.
We first performed a Sherlock-based Bayesian analysis through incorporating a large-scale GWAS summary dataset on TB with a discovery eQTL dataset to identify susceptible genes and eSNPs. At this discovery stage, a number of 694 significant genes were identified to be associated with TB. Of note, we noticed that 49 genes of 694 significant genes have been documented to be associated with TB, lung-related or respiratory-related diseases in earlier studies. For example, 4 genes of C2CD2 [20], HLA-DRB6 [42], LPCAT2 [43], and HLA-DQB1 [42, 44] were associated with TB risk, and RUNX [45] showed association with asthma or allergic disease risk. In addition, RUFY1, DEPDC7, and IRF4 were reported to be involved in lung cancer [46]. To validate the findings in the discovery stage, we conducted Sherlock analysis based on 2 independent eQTL datasets and found that there were 26 genes significantly replicated. Of note, 1 common gene of CARD9 was previously identified to be associated with lung function (FVC) [47, 48]. Additionally, based on these significantly identified genes in both discovery and replication stage, we found 10 important biological pathways implicated in TB risk, providing a mechanistic clue for performing molecular studies for TB. Based on multiple layers of protein and genomics evidence deposited in public databases, we found these 26 genes were highly connective with each other in the constructed network, indicating these genes jointly impact on TB susceptibility. Noteworthy, all these 26 genes encompassed at least one eSNPs which are significantly associated with both expression of gene and TB risk. Meanwhile, we also utilized MAGMA analysis of GWAS on TB as an independent technical validation. Interestingly, 18 of 26 (69.23%) common genes were significantly replicated in MAGMA analysis.
Since there existed a high proportion of co-expression links among these 26 genes in our constructed network, we inferred that the co-expression patterns might be changed according to the different disease status of TB. In line with our speculation, the co-expression patterns among 26 genes were prominently altered between MTB-infected and uninfected cells. By performing the DGE analysis based on 4 independent expression datasets, we found that 21 of 26 genes had significantly differential expressions between TB group and control group in mesenchymal stem cells, mice blood and lung tissues, as well as human alveolar macrophages; such as, CDC16, HIATL1, RCN3, FCHO1, and RPS5. These results are consistent with the primary assumption of the Sherlock-based Bayesian inference algorithm that aberrant expression of genes are more likely to convey risk to complex diseases [29]. For the original GWAS reported by Canela-Xandri and coworkers [49], there was no SNP reaching genome-wide significance to be associated with TB. Due to the strict genome-wide significance threshold applied by the GWAS, numerous susceptible genes and SNPs with small-to-moderate effects on TB being neglected. As the method of reported studies [50–53], based on the two-stage designed integrative genomics analysis, we highlighted 26 genes with multiple eSNPs as important candidates for revealing the pathogenesis of TB risk.
The protein of CDC16, encoded by the highlighted gene of CDC16, is a protein ubiquitin ligase and is one of components of the multiprotein APC complex. CDC16 has been reported as a binding partner of chitooligosaccharide deacetylase homolog (YDJC) in breast cancer cells [54]. Overexpression of CDC16 enhanced the ubiquitination of YDJC in an orthotopic mouse model [55]. Kim and coworkers reported that suppression of YDJC or boosting of CDC16 interaction with YDJC might be implicated in the progression of lung cancer [56]. Previous studies have reported that TB is considered as a potential risk factor for the development of lung cancer [57, 58]. In our current analysis, there were 3 eSNPs (rs7987202, rs9590408, and rs948182) with cis- or trans-regulatory effects in CDC16 gene identified to be associated with TB risk. As for the highlighted gene of RCN3, it encodes reticulocalbin 3 (Rcn3), which is an endoplasmic reticulum lumen protein mapped in the secretory pathway. Jin and colleagues [59] showed that Rcn3 protein has an indispensable physiological role in the maturation of perinatal lung and neonatal respiratory adaption by using an Rcn3 knockout mouse model. Furthermore, they demonstrated that upregulated expression of Rcn3 in maturating alveolar epithelial type II cells (AECIIs) seems to have a contribution to the survival and wound healing of AECIIs, indicating Rcn3 has a critical part in mediating pulmonary injury remodeling [60]. Hou and coworkers [61] suggested that there is a potential association between the depletion of Rcn3 protein and development of non-small cell lung cancer. We noticed 3 eSNPs of rs2946863, rs2878342, and rs3810194 in RCN3 were associated with TB risk in our integrative genomics analysis.
Some limitations of our current analysis need to comment. Although we employed multiple omics datasets, there were other datasets missed. For example, in our current study, gene expression datasets were mainly based on blood samples. Only two datasets of eQTL Dataset #5 and GSE1449044 were derived from mice lung tissue. More molecular studies for exploring the functions of genes identified from our current analysis are warrant to assess tissues that could be more related to the etiology of TB, for example, human lung tissue. Furthermore, due to the heterogeneity of different datasets, we applied different correction methods for multiple testing at each individual dataset; such as, simulated P value < 0.05 for Sherlock Bayesian analysis, false discovery rate (FDR) < 0.05 for pathway enrichment analysis, and empirical P value < 0.05 for 100,000 times of in silico permutation analysis. Additionally, association signals of eSNPs from current integrative genomics analysis were obtained in the European population. We did not determine whether the associations exist in other ancestries. Future studies are warrant to evaluate the regulatory effects of eSNPs using genotype and expression data from other ethnic populations. In addition, although a total of 452,264 samples were included for our genomics analysis, it should be noted that our chosen controls might contain persons have latent infection or they are the susceptible host that have never been exposed to TB, which might result in the power loss for genome-wide association analysis of this dataset.
In conclusion, in the present study, we conducted a systematically integrative genomics analysis to identify TB-associated risk SNPs, susceptible genes, and biological pathways. By incorporating GWAS summary statistics with eQTL data, we offered a reasonable explanation of the regulatory functions of intronic SNPs for TB. With the use of detailed topology data on gene-gene and gene-drug information, we highlighted 26 candidate genes for TB susceptibility, which were difficult to be identified by any single GWAS. More molecular experiments are warranted to be performed for identification of the biological mechanisms of these prioritized genes implicated in the aetiology of developing TB.
Materials and Methods
Sherlock-based integrative genomics analysis
To exploit whether abnormal expression of gene with susceptible SNPs implicated in the etiology of TB risk, we performed a Sherlock-based integrative genomics analysis to integrate GWAS summary-based SNP information with eQTL [29]. The Sherlock integrative analysis based on a Bayesian algorithm is intended to cluster multiple lower-confidence SNPs from GWAS with expression QTL data to reveal authentic susceptible genes involved in complex diseases. In our Sherlock analysis, SNP rs IDs and P values extracted from GWAS summary-level statistics were utilized as an input list. The definition of expression-associated SNPs (i.e., eSNPs) are that SNPs show significant associations with TB risk and meanwhile have cis- or trans-regulatory effects on expression levels of interested genes. There exists 3 potential scenarios: 1) A positive score would be recorded based on a specific eSNP shows a significant association with TB; 2) A negative score would be recorded based on a specific eSNP shows a non-significant association with TB; 3) No score would be recorded based on an SNP was not eSNP but shows a significant association with TB. The summed score of a specific gene was based on the number of eSNPs with integrative evidence from both GWAS and eQTL data. The logarithm of the Bayes Factor (LBF) is generated as a crucial indicator to predict TB-associated functionally-important genes. The significance of Sherlock Bayesian algorithm is assessed by using a simulation analysis, and P < 0.05 is considered to be significant.
Dataset #1 for GWAS summary statistics on TB
The Dataset #1, the large-scale GWAS summary dataset on TB [49], was downloaded from the UK-Biobank database (Fields: 20002; Field codes: 1440). There were 452,264 subjects with 2,219 patients included in the GWAS. The Affymetrix UK BiLEVE Axiom array and the Affymetrix UK Biobank Axiom array were utilized for obtaining the genotypes of all subjects. There were 62,394 genotyped variants passed quality control. Moreover, based on the UK10K [62], 1,000 Genome [63], and Haplotype Reference Consortium [64] projects as genomics references, all genotyped variants were used for imputation to extend more variants. In the current investigation, we defined two filtering criteria for choosing high quality variants: 1) if variants are genotyped, these variants with minor allele frequency (MAF) > 10-4 are included; 2) if variants are imputed, these variants with MAF > 10-4 and imputation score > 0.9 are included. After strictly filtering, a number of 13,805,935 SNPs are qualified for subsequent genomics integrative analysis.
Dataset #2 for GWAS dataset on fake TB
To ensure identified TB-risk genes were due to genetic determinants instead of random events, we constructed a fake TB-based GWAS through using a reported GWAS dataset (N = 3,960) [65]. We used the function of RANDBETWEEN in the Microsoft Excel to randomly generate and assign the phenotype of TB or control to these 3,960 individuals. In view of there is no true genetic effect of fake TB, the sample size of constructed GWAS is not a big issue. Thus, we used this constructed GWAS dataset as a negative control to re-perform genomics analysis by using the software of PLINK v1.07 based on the addictive genetic model.
Dataset #3 for eQTL dataset reported by Zeller and coworkers
Here we downloaded the monocyte eQTL data reported by Zeller and colleagues [66], which is used as a discovery dataset for the Sherlock Bayesian genomics analysis. For this eQTL dataset, 1,490 subjects with DNA and RNA samples were enrolled from the Gutenberg Heart Study (GHS). The Affymetrix Genome-wide Human SNP Array 6.0 was utilized to obtain the genotypes of subjects, and the Illumina HT-12 v3 BeadChip was utilized to obtain RNA expression abundances. After stringently excluding, a number of 675,350 SNPs and 12,808 genes were qualified for eQTL analysis and subsequent Sherlock analysis. For more detailed characteristics on this dataset, please refers to the original study [66].
Datasets #4 and #5 for eQTL datasets from the GTEx database
Furthermore, we used two eQTL datasets on whole blood (Dataset #4; N = 369) and lung tissue (Dataset #5; N = 383) from the resource of Genotype-Tissue Expression project (GTEx v7) as an independent replication to conduct Sherlock analysis with same parameters. As for the resource of GTEx [67–69], nearly 1,000 subjects with 54 non-diseased tissues were utilized to collect samples for whole genome sequencing, whole exome sequencing, and RNA sequencing, which can be used for integrative genomics analysis to explore the relationship between genetic variants and expression levels of interested genes across multiple tissues. Multi-layers of omics data including gene expression and QTL data can be obtained through the GTEx Portal (https://www.gtexportal.org/home/).
Gene-based analysis by using MAGMA tool
To further replicate the findings identified from the Sherlock analysis, we conducted a gene-based analysis of GWAS on TB by applying the Multi-marker Analysis of GenoMic Annotation (MAGMA) [70]. Here, we used GWAS-relevant SNP rs IDs and SNP P values as an input list for MAGMA analysis. To improve the mapping of SNPs across different files and reference data, we used the SNP synonym file encompassing lists of synonymous SNP rs IDs that refer to the same SNP on the basis of the resource of dbSNP database release 151. By using multiple regression method, we attempted to discover multi-variant aggregated genetic effects by incorporating SNP-SNP linkage disequilibrium (LD) information, which is reference to the 1,000 Genomes European Panel Phase 3. The definition of the SNP set of each gene is that the SNP located in the gene body or within extended +/-20 kb downstream or upstream of the gene, and the locations of SNPs are based on the Human Genome Build 37. In addition, based on the KEGG pathway resource, we used the MGMA tool to conduct a pathway-based enrichment analysis.
In silico permutation analysis
By using the Sherlock Bayesian and MAGMA analysis, 5 gene sets were identified to be associated with TB risk; namely Gene set #1 from discovery stage (Dataset #3), Gene set #2 from replication stage (Dataset #4), Gene set #3 from replication stage (Dataset #5), Gene set #4 from MAGMA analysis on TB (Dataset #1), and Gene set #5 from MAGMA analysis on fake TB (Dataset #2). Based on these 5 gene sets, we carried out serial in silico permutation analyses with 100,000 times of random trial [71]. In first step of this permutation analysis, the number of overlapped genes between Gene set #1 with other gene sets (Nobservation) were counted separately. Second, the background genes of each gene set was treated as a gene pool, which could be used for random selections. The number of background genes (N total) were 5,786, 7,452, 18,318, and 17,565 for Gene sets #2, #3, #4, and #5, respectively. By randomly picking the same number as the significant genes in Gene sets #2, #3, #4, and #5 from background genes (N total) respectively, via 100,000 times of repeat, we calibrated the count of genes overlapped with these significant genes of Gene set #1(Nrandom). Finally, we calculated the number of times Nrandom ≤ Nobservation and divided by 100,000 to obtain an empirical permuted P value. P value less than 0.05 is considered to be of significance. The density plot of each analysis was generated by using the R platform.
Functional enrichment analysis by using KOBAS tool
We carried out functional enrichment analyses with the use of the web-access tool of KOBAS version 3.0 [72]. The tool of KOBAS (http://kobas.cbi.pku.edu.cn/kobas3), which is depended on the machine learning-based called Combined Gene set analysis incorporating Prioritization and Sensitivity (CGPS) [73], is designed to analyze protein or gene functional annotation and functional gene set enrichment. With respect to gene set enrichment analysis, the method of KOBAS can accept either gene list or gene expression data as a submitted file. In our current analysis, we used identified TB-associated genes from 3 times of Sherlock analyses (i.e., Gene sets #1, #2, and #3) as 3 lists of submitted genes for the KOBAS tool to calculate significantly enriched gene sets, including gene set related name, enrichment score, raw P values and corrected P values. There were 3 types of databases used in our analyses: 1) Biological pathways: Reactome pathway, KEGG pathway, PANTHER pathway, and BioCyc pathway; 2) Gene Ontology (GO) terms; 3) Diseases: OMIM, NHGRI GWAS Catalog, and KEGG disease. The statistical significance is corrected by using the method of Benjamini-Hochberg false discovery rate (FDR) correction.
GeneMANIA-based GGI network analysis of risk genes
We used the bioinformatics tool of GeneMANIA [74] to conduct a gene-gene interaction (GGI) network-based analysis for identifying collective interaction patterns of the identified TB-associated genes and predicted genes with similar functions or co-expressions. We used these highlighted risk genes to query the large database of documented genomics and proteomics data. By using a guilt-by-association approach, the GeneMANIA tool based on multi-layers of supportive evidence including co-expression links, shared protein domains, genetic interactions, pathway links, co-localization, physical interactions, and predicted links, is designed to quickly and effectively predict the molecular functions and biological interactions of submitted genes. The GGI network is visualized by using the Cytoscape network visualization and analysis platform [75].
Differential expression patterns of identified genes
To determine whether abnormal alterations in RNA expression levels of highlighted TB-risk genes, we downloaded 4 independent gene expression datasets from the database of the NCBI’s Gene Expression Omnibus (GEO). The accession numbers of 4 expression datasets were GSE133803, GSE140943, GSE140944, and GSE139825. For GSE133803, the dataset was designed to analyze the mesenchymal stem cell gene expression level upon Mycobacterium tuberculosis (MTB) infection. RNA samples were obtained from MTB-infected mesenchymal stem cells (N = 3) and compared with that of uninfected mesenchymal stem cells (N = 3). The Illumina Human HT-12 V4.0 expression BeadChip was used to obtain the genome-wide gene expression profiles for all samples.
As for two datasets of GSE1440943 and GSE1440944, they were designed to characterize global transcriptional responses to MTB infection in different mouse models. The samples of GSE1440943 were based on blood samples obtained from BALB mice infected with low dose of MTB H37Rv, collected at 4 distinct time points Day 14 (N = 5), Day 21 (N = 5), Day 56 (N = 5), and Day 138 (N = 3) after MTB infection and uninfected control mice (N = 3). Similarly, the samples of GSE1449044 were based on lung tissues obtained from BALB mice infected with low dose of MTB H37Rv, collected at 4 distinct time points Day 14 (N = 3), Day 21 (N = 3), Day 56 (N = 3), and Day 129 (N = 5) after MTB infection and uninfected controls (N = 5). The genome-wide gene expression signatures of both GSE1440943 and GSE1440944 were assessed by using the Illumina MouseWG-6 v2.0 expression BeadChip. With regard to the dataset of GSE139825, it was designed to explore the response to infection with MTB by human extrapulmonary macrophages. Total RNA samples (N = 26) were obtained from alveolar macrophages from TB patients infected with clinical isolates of MTB to compared to alveolar macrophages from control samples. The Illumina HumanHT-12 V4.0 expression beadchip was used to evaluate the genome-wide transcriptional abundance.
Statistical analysis of RNA expression data from GEO database
With regard to GSE133803 dataset, we conducted a differential gene expression (DGE) analysis. The Student’s t-test is used to assess the significant differences between MTB-infected cells and uninfected cells. Based on the Pearson correlation analysis, we used the Corrplot package in R platform to analyze and visualize the co-expression patterns among these highlighted TB-associated genes in the dataset of GSE133803. For both GSE1440943 and GSE1440944, the ANOVA test was used to compare the statistically significant differences between MTB-infected mice and uninfected mice at 4 distinct time points. Furthermore, for GSE139825, the ANOVA test was applied to assess the significant difference among different groups. The Rscript for this analysis was uploaded into the public github website (https://github.com/mayunlong89/TB/blob/master/Anova_test.R).
Supplementary Materials
Author Contributions
MX, ZX, JL and XP managed the reported papers searches, data collection and analysis. XM and XP wrote the first draft of the manuscript. YM conceived the study and wrote and reviewed the manuscript. All authors read and approved the final manuscript.
Acknowledgments
We thank all our colleagues who give useful advices for data analysis and manuscript writing. We also thank Dr. Jing Tao from Zhejiang University for excellent editing of this manuscript.
Conflicts of Interest
The authors declare no conflicts of interest.
Funding
This study was supported by the China Postdoctoral Science Foundation (2018M630667). The funders had no role in the designing and conducting of this study and collection, analysis, and interpretation of data and in writing the manuscript.
References
- 1. Dye C, Williams BG. The population dynamics and control of tuberculosis. Science. 2010; 328:856–61. https://doi.org/10.1126/science.1185449 [PubMed]
- 2. van Tong H, Velavan TP, Thye T, Meyer CG. Human genetic factors in tuberculosis: an update. Trop Med Int Health. 2017; 22:1063–71. https://doi.org/10.1111/tmi.12923 [PubMed]
- 3. Zumla A, Raviglione M, Hafner R, von Reyn CF. Tuberculosis. N Engl J Med. 2013; 368:745–55. https://doi.org/10.1056/NEJMra1200894 [PubMed]
- 4. WHO. WHO Global Tuberculosis Report 2017. World Health Organization. 2017.
- 5. Campbell IA, Bah-Sow O. Pulmonary tuberculosis: diagnosis and treatment. BMJ. 2006; 332:1194–97. https://doi.org/10.1136/bmj.332.7551.1194 [PubMed]
- 6. Comstock GW. Tuberculosis in twins: a re-analysis of the prophit survey. Am Rev Respir Dis. 1978; 117:621–24. https://doi.org/10.1164/arrd.1978.117.4.621 [PubMed]
- 7. van der Eijk EA, van de Vosse E, Vandenbroucke JP, van Dissel JT. Heredity versus environment in tuberculosis in twins: the 1950s United Kingdom prophit survey simonds and comstock revisited. Am J Respir Crit Care Med. 2007; 176:1281–88. https://doi.org/10.1164/rccm.200703-435OC [PubMed]
- 8. Simonds B. Twin research in tuberculosis. Eugen Rev. 1957; 49:25–32. [PubMed]
- 9. Salie M, Daya M, Lucas LA, Warren RM, van der Spuy GD, van Helden PD, Hoal EG, Möller M. Association of toll-like receptors with susceptibility to tuberculosis suggests sex-specific effects of TLR8 polymorphisms. Infect Genet Evol. 2015; 34:221–29. https://doi.org/10.1016/j.meegid.2015.07.004 [PubMed]
- 10. Bukhari M, Aslam MA, Khan A, Iram Q, Akbar A, Naz AG, Ahmad S, Ahmad MM, Ashfaq UA, Aziz H, Ali M. TLR8 gene polymorphism and association in bacterial load in southern punjab of Pakistan: an association study with pulmonary tuberculosis. Int J Immunogenet. 2015; 42:46–51. https://doi.org/10.1111/iji.12170 [PubMed]
- 11. Dittrich N, Berrocal-Almanza LC, Thada S, Goyal S, Slevogt H, Sumanlatha G, Hussain A, Sur S, Burkert S, Oh DY, Valluri V, Schumann RR, Conrad ML. Toll-like receptor 1 variations influence susceptibility and immune response to mycobacterium tuberculosis. Tuberculosis (Edinb). 2015; 95:328–35. https://doi.org/10.1016/j.tube.2015.02.045 [PubMed]
- 12. Jafari M, Nasiri MR, Sanaei R, Anoosheh S, Farnia P, Sepanjnia A, Tajik N. The NRAMP1, VDR, TNF-α, ICAM1, TLR2 and TLR4 gene polymorphisms in Iranian patients with pulmonary tuberculosis: a case-control study. Infect Genet Evol. 2016; 39:92–98. https://doi.org/10.1016/j.meegid.2016.01.013 [PubMed]
- 13. Torres-Juarez F, Cardenas-Vargas A, Montoya-Rosales A, González-Curiel I, Garcia-Hernandez MH, Enciso-Moreno JA, Hancock RE, Rivas-Santiago B. LL-37 immunomodulatory activity during mycobacterium tuberculosis infection in macrophages. Infect Immun. 2015; 83:4495–503. https://doi.org/10.1128/IAI.00936-15 [PubMed]
- 14. Zacharia VM, Manzanillo PS, Nair VR, Marciano DK, Kinch LN, Grishin NV, Cox JS, Shiloh MU. Cor, a novel carbon monoxide resistance gene, is essential for mycobacterium tuberculosis pathogenesis. mBio. 2013; 4:e00721–13. https://doi.org/10.1128/mBio.00721-13 [PubMed]
- 15. Thuong NT, Dunstan SJ, Chau TT, Thorsson V, Simmons CP, Quyen NT, Thwaites GE, Thi Ngoc Lan N, Hibberd M, Teo YY, Seielstad M, Aderem A, Farrar JJ, Hawn TR. Identification of tuberculosis susceptibility genes with human macrophage gene expression profiles. PLoS Pathog. 2008; 4:e1000229. https://doi.org/10.1371/journal.ppat.1000229 [PubMed]
- 16. Thye T, Vannberg FO, Wong SH, Owusu-Dabo E, Osei I, Gyapong J, Sirugo G, Sisay-Joof F, Enimil A, Chinbuah MA, Floyd S, Warndorff DK, Sichali L, et al, and African TB Genetics Consortium, and Wellcome Trust Case Control Consortium. Genome-wide association analyses identifies a susceptibility locus for tuberculosis on chromosome 18q11.2. Nat Genet. 2010; 42:739–41. https://doi.org/10.1038/ng.639 [PubMed]
- 17. Curtis J, Luo Y, Zenner HL, Cuchet-Lourenço D, Wu C, Lo K, Maes M, Alisaac A, Stebbings E, Liu JZ, Kopanitsa L, Ignatyeva O, Balabanova Y, et al. Susceptibility to tuberculosis is associated with variants in the ASAP1 gene encoding a regulator of dendritic cell migration. Nat Genet. 2015; 47:523–27. https://doi.org/10.1038/ng.3248 [PubMed]
- 18. Thye T, Owusu-Dabo E, Vannberg FO, van Crevel R, Curtis J, Sahiratmadja E, Balabanova Y, Ehmen C, Muntau B, Ruge G, Sievertsen J, Gyapong J, Nikolayevskyy V, et al. Common variants at 11p13 are associated with susceptibility to tuberculosis. Nat Genet. 2012; 44:257–59. https://doi.org/10.1038/ng.1080 [PubMed]
- 19. Oki NO, Motsinger-Reif AA, Antas PR, Levy S, Holland SM, Sterling TR. Novel human genetic variants associated with extrapulmonary tuberculosis: a pilot genome wide association study. BMC Res Notes. 2011; 4:28. https://doi.org/10.1186/1756-0500-4-28 [PubMed]
- 20. Chimusa ER, Zaitlen N, Daya M, Möller M, van Helden PD, Mulder NJ, Price AL, Hoal EG. Genome-wide association study of ancestry-specific TB risk in the South African coloured population. Hum Mol Genet. 2014; 23:796–809. https://doi.org/10.1093/hmg/ddt462 [PubMed]
- 21. Mahasirimongkol S, Yanai H, Mushiroda T, Promphittayarat W, Wattanapokayakit S, Phromjai J, Yuliwulandari R, Wichukchinda N, Yowang A, Yamada N, Kantipong P, Takahashi A, Kubo M, et al. Genome-wide association studies of tuberculosis in Asians identify distinct at-risk locus for young tuberculosis. J Hum Genet. 2012; 57:363–67. https://doi.org/10.1038/jhg.2012.35 [PubMed]
- 22. Png E, Alisjahbana B, Sahiratmadja E, Marzuki S, Nelwan R, Balabanova Y, Nikolayevskyy V, Drobniewski F, Nejentsev S, Adnan I, van de Vosse E, Hibberd ML, van Crevel R, et al. A genome wide association study of pulmonary tuberculosis susceptibility in Indonesians. BMC Med Genet. 2012; 13:5. https://doi.org/10.1186/1471-2350-13-5 [PubMed]
- 23. Grant AV, Sabri A, Abid A, Abderrahmani Rhorfi I, Benkirane M, Souhi H, Naji Amrani H, Alaoui-Tahiri K, Gharbaoui Y, Lazrak F, Sentissi I, Manessouri M, Belkheiri S, et al. A genome-wide association study of pulmonary tuberculosis in Morocco. Hum Genet. 2016; 135:299–307. https://doi.org/10.1007/s00439-016-1633-2 [PubMed]
- 24. Sobota RS, Stein CM, Kodaman N, Scheinfeldt LB, Maro I, Wieland-Alter W, Igo RP
Jr , Magohe A, Malone LL, Chervenak K, Hall NB, Modongo C, Zetola N, et al. A locus at 5q33.3 confers resistance to tuberculosis in highly susceptible individuals. Am J Hum Genet. 2016; 98:514–24. https://doi.org/10.1016/j.ajhg.2016.01.015 [PubMed] - 25. Sveinbjornsson G, Gudbjartsson DF, Halldorsson BV, Kristinsson KG, Gottfredsson M, Barrett JC, Gudmundsson LJ, Blondal K, Gylfason A, Gudjonsson SA, Helgadottir HT, Jonasdottir A, Jonasdottir A, et al. HLA class II sequence variants influence tuberculosis risk in populations of european ancestry. Nat Genet. 2016; 48:318–22. https://doi.org/10.1038/ng.3498 [PubMed]
- 26. Hindorff LA, Sethupathy P, Junkins HA, Ramos EM, Mehta JP, Collins FS, Manolio TA. Potential etiologic and functional implications of genome-wide association loci for human diseases and traits. Proc Natl Acad Sci USA. 2009; 106:9362–67. https://doi.org/10.1073/pnas.0903103106 [PubMed]
- 27. Uren C, Henn BM, Franke A, Wittig M, van Helden PD, Hoal EG, Möller M. A post-GWAS analysis of predicted regulatory variants and tuberculosis susceptibility. PLoS One. 2017; 12:e0174738. https://doi.org/10.1371/journal.pone.0174738 [PubMed]
- 28. Sweeney TE, Braviak L, Tato CM, Khatri P. Genome-wide expression for diagnosis of pulmonary tuberculosis: a multicohort analysis. Lancet Respir Med. 2016; 4:213–24. https://doi.org/10.1016/S2213-2600(16)00048-5 [PubMed]
- 29. He X, Fuller CK, Song Y, Meng Q, Zhang B, Yang X, Li H. Sherlock: detecting gene-disease associations by matching patterns of expression QTL and GWAS. Am J Hum Genet. 2013; 92:667–80. https://doi.org/10.1016/j.ajhg.2013.03.022 [PubMed]
- 30. Ayalew M, Le-Niculescu H, Levey DF, Jain N, Changala B, Patel SD, Winiger E, Breier A, Shekhar A, Amdur R, Koller D, Nurnberger JI, Corvin A, et al. Convergent functional genomics of schizophrenia: from comprehensive understanding to genetic risk prediction. Mol Psychiatry. 2012; 17:887–905. https://doi.org/10.1038/mp.2012.37 [PubMed]
- 31. Schadt EE, Lamb J, Yang X, Zhu J, Edwards S, Guhathakurta D, Sieberts SK, Monks S, Reitman M, Zhang C, Lum PY, Leonardson A, Thieringer R, et al. An integrative genomics approach to infer causal associations between gene expression and disease. Nat Genet. 2005; 37:710–17. https://doi.org/10.1038/ng1589 [PubMed]
- 32. Zhu Z, Zhang F, Hu H, Bakshi A, Robinson MR, Powell JE, Montgomery GW, Goddard ME, Wray NR, Visscher PM, Yang J. Integration of summary data from GWAS and eQTL studies predicts complex trait gene targets. Nat Genet. 2016; 48:481–87. https://doi.org/10.1038/ng.3538 [PubMed]
- 33. Ma Y, Li J, Xu Y, Wang Y, Yao Y, Liu Q, Wang M, Zhao X, Fan R, Chen J, Zhang B, Cai Z, Han H, et al. Identification of 34 genes conferring genetic and pharmacological risk for the comorbidity of schizophrenia and smoking behaviors. Aging (Albany NY). 2020; 12:2169–225. https://doi.org/10.18632/aging.102735 [PubMed]
- 34. Apt A, Kramnik I. Man and mouse TB: contradictions and solutions. Tuberculosis (Edinb). 2009; 89:195–98. https://doi.org/10.1016/j.tube.2009.02.002 [PubMed]
- 35. Möller M, Hoal EG. Current findings, challenges and novel approaches in human genetic susceptibility to tuberculosis. Tuberculosis (Edinb). 2010; 90:71–83. https://doi.org/10.1016/j.tube.2010.02.002 [PubMed]
- 36. Buniello A, MacArthur JA, Cerezo M, Harris LW, Hayhurst J, Malangone C, McMahon A, Morales J, Mountjoy E, Sollis E, Suveges D, Vrousgou O, Whetzel PL, et al. The NHGRI-EBI GWAS catalog of published genome-wide association studies, targeted arrays and summary statistics 2019. Nucleic Acids Res. 2019; 47:D1005–12. https://doi.org/10.1093/nar/gky1120 [PubMed]
- 37. Zheng R, Li Z, He F, Liu H, Chen J, Chen J, Xie X, Zhou J, Chen H, Wu X, Wu J, Chen B, Liu Y, et al. Genome-wide association study identifies two risk loci for tuberculosis in han Chinese. Nat Commun. 2018; 9:4072. https://doi.org/10.1038/s41467-018-06539-w [PubMed]
- 38. Miao R, Ge H, Xu L, Sun Z, Li C, Wang R, Ding S, Yang C, Xu F. Genetic variants at 18q11.2 and 8q24 identified by genome-wide association studies were not associated with pulmonary tuberculosis risk in Chinese population. Infect Genet Evol. 2016; 40:214–218. https://doi.org/10.1016/j.meegid.2016.03.005 [PubMed]
- 39. Bush WS, Moore JH. Chapter 11: genome-wide association studies. PLoS Comput Biol. 2012; 8:e1002822. https://doi.org/10.1371/journal.pcbi.1002822 [PubMed]
- 40. MacArthur J, Bowler E, Cerezo M, Gil L, Hall P, Hastings E, Junkins H, McMahon A, Milano A, Morales J, Pendlington ZM, Welter D, Burdett T, et al. The new NHGRI-EBI catalog of published genome-wide association studies (GWAS catalog). Nucleic Acids Res. 2017; 45:D896–901. https://doi.org/10.1093/nar/gkw1133 [PubMed]
- 41. Welter D, MacArthur J, Morales J, Burdett T, Hall P, Junkins H, Klemm A, Flicek P, Manolio T, Hindorff L, Parkinson H. The NHGRI GWAS catalog, a curated resource of SNP-trait associations. Nucleic Acids Res. 2014; 42:D1001–06. https://doi.org/10.1093/nar/gkt1229 [PubMed]
- 42. Qi H, Zhang YB, Sun L, Chen C, Xu B, Xu F, Liu JW, Liu JC, Chen C, Jiao WW, Shen C, Xiao J, Li JQ, et al. Discovery of susceptibility loci associated with tuberculosis in han Chinese. Hum Mol Genet. 2017; 26:4752–63. https://doi.org/10.1093/hmg/ddx365 [PubMed]
- 43. Schurz H, Kinnear CJ, Gignoux C, Wojcik G, van Helden PD, Tromp G, Henn B, Hoal EG, Möller M. A sex-stratified genome-wide association study of tuberculosis using a multi-ethnic genotyping array. Front Genet. 2019; 9:678. https://doi.org/10.3389/fgene.2018.00678 [PubMed]
- 44. Tian C, Hromatka BS, Kiefer AK, Eriksson N, Noble SM, Tung JY, Hinds DA. Genome-wide association and HLA region fine-mapping studies identify susceptibility loci for multiple common infections. Nat Commun. 2017; 8:599. https://doi.org/10.1038/s41467-017-00257-5 [PubMed]
- 45. Zhu Z, Lee PH, Chaffin MD, Chung W, Loh PR, Lu Q, Christiani DC, Liang L. A genome-wide cross-trait analysis from UK biobank highlights the shared genetic architecture of asthma and allergic diseases. Nat Genet. 2018; 50:857–64. https://doi.org/10.1038/s41588-018-0121-0 [PubMed]
- 46. McKay JD, Hung RJ, Han Y, Zong X, Carreras-Torres R, Christiani DC, Caporaso NE, Johansson M, Xiao X, Li Y, Byun J, Dunning A, Pooley KA, et al, and SpiroMeta Consortium. Large-scale association analysis identifies new lung cancer susceptibility loci and heterogeneity in genetic susceptibility across histological subtypes. Nat Genet. 2017; 49:1126–32. https://doi.org/10.1038/ng.3892 [PubMed]
- 47. Shrine N, Guyatt AL, Erzurumluoglu AM, Jackson VE, Hobbs BD, Melbourne CA, Batini C, Fawcett KA, Song K, Sakornsakolpat P, Li X, Boxall R, Reeve NF, et al, and Understanding Society Scientific Group. New genetic signals for lung function highlight pathways and chronic obstructive pulmonary disease associations across multiple ancestries. Nat Genet. 2019; 51:481–93. https://doi.org/10.1038/s41588-018-0321-7 [PubMed]
- 48. Wain LV, Shrine N, Artigas MS, Erzurumluoglu AM, Noyvert B, Bossini-Castillo L, Obeidat M, Henry AP, Portelli MA, Hall RJ, Billington CK, Rimington TL, Fenech AG, et al, and Understanding Society Scientific Group, and Geisinger-Regeneron DiscovEHR Collaboration. Genome-wide association analyses for lung function and chronic obstructive pulmonary disease identify new loci and potential druggable targets. Nat Genet. 2017; 49:416–25. https://doi.org/10.1038/ng.3787 [PubMed]
- 49. Canela-Xandri O, Rawlik K, Tenesa A. An atlas of genetic associations in UK biobank. Nat Genet. 2018; 50:1593–99. https://doi.org/10.1038/s41588-018-0248-z [PubMed]
- 50. Yang CP, Li X, Wu Y, Shen Q, Zeng Y, Xiong Q, Wei M, Chen C, Liu J, Huo Y, Li K, Xue G, Yao YG, et al. Comprehensive integrative analyses identify GLT8D1 and CSNK2B as schizophrenia risk genes. Nat Commun. 2018; 9:838. https://doi.org/10.1038/s41467-018-03247-3 [PubMed]
- 51. Nelson CP, Goel A, Butterworth AS, Kanoni S, Webb TR, Marouli E, Zeng L, Ntalla I, Lai FY, Hopewell JC, Giannakopoulou O, Jiang T, Hamby SE, et al, and EPIC-CVD Consortium, CARDIoGRAMplusC4D, and UK Biobank CardioMetabolic Consortium CHD working group. Association analyses based on false discovery rate implicate new loci for coronary artery disease. Nat Genet. 2017; 49:1385–91. https://doi.org/10.1038/ng.3913 [PubMed]
- 52. Voight BF, Scott LJ, Steinthorsdottir V, Morris AP, Dina C, Welch RP, Zeggini E, Huth C, Aulchenko YS, Thorleifsson G, McCulloch LJ, Ferreira T, Grallert H, et al, and MAGIC investigators, and GIANT Consortium. Twelve type 2 diabetes susceptibility loci identified through large-scale association analysis. Nat Genet. 2010; 42:579–89. https://doi.org/10.1038/ng.609 [PubMed]
- 53. Nikpay M, Goel A, Won HH, Hall LM, Willenborg C, Kanoni S, Saleheen D, Kyriakou T, Nelson CP, Hopewell JC, Webb TR, Zeng L, Dehghan A, et al. A comprehensive 1,000 genomes-based genome-wide association meta-analysis of coronary artery disease. Nat Genet. 2015; 47:1121–30. https://doi.org/10.1038/ng.3396 [PubMed]
- 54. Huttlin EL, Ting L, Bruckner RJ, Gebreab F, Gygi MP, Szpyt J, Tam S, Zarraga G, Colby G, Baltier K, Dong R, Guarani V, Vaites LP, et al. The BioPlex network: a systematic exploration of the human interactome. Cell. 2015; 162:425–40. https://doi.org/10.1016/j.cell.2015.06.043 [PubMed]
- 55. Kim EJ, Park MK, Kang GJ, Byun HJ, Kim HJ, Yu L, Kim B, Chae HS, Chin YW, Shim JG, Lee H, Lee CH. YDJC induces epithelial-mesenchymal transition via escaping from interaction with CDC16 through ubiquitination of PP2A. J Oncol. 2019; 2019:3542537. https://doi.org/10.1155/2019/3542537 [PubMed]
- 56. Kim EJ, Park MK, Byun HJ, Kang GJ, Yu L, Kim HJ, Shim JG, Lee H, Lee CH. YdjC chitooligosaccharide deacetylase homolog induces keratin reorganization in lung cancer cells: involvement of interaction between YDJC and CDC16. Oncotarget. 2018; 9:22915–28. https://doi.org/10.18632/oncotarget.25145 [PubMed]
- 57. Sisti J, Boffetta P. What proportion of lung cancer in never-smokers can be attributed to known risk factors? Int J Cancer. 2012; 131:265–75. https://doi.org/10.1002/ijc.27477 [PubMed]
- 58. Wong JY, Zhang H, Hsiung CA, Shiraishi K, Yu K, Matsuo K, Wong MP, Hong YC, Wang J, Seow WJ, Wang Z, Song M, Kim HN, et al. Tuberculosis infection and lung adenocarcinoma: mendelian randomization and pathway analysis of genome-wide association study data from never-smoking Asian women. Genomics. 2020; 112:1223–32. https://doi.org/10.1016/j.ygeno.2019.07.008 [PubMed]
- 59. Jin J, Li Y, Ren J, Man Lam S, Zhang Y, Hou Y, Zhang X, Xu R, Shui G, Ma RZ. Neonatal respiratory failure with retarded perinatal lung maturation in mice caused by reticulocalbin 3 disruption. Am J Respir Cell Mol Biol. 2016; 54:410–23. https://doi.org/10.1165/rcmb.2015-0036OC [PubMed]
- 60. Jin J, Shi X, Li Y, Zhang Q, Guo Y, Li C, Tan P, Fang Q, Ma Y, Ma RZ. Reticulocalbin 3 deficiency in alveolar epithelium exacerbated bleomycin-induced pulmonary fibrosis. Am J Respir Cell Mol Biol. 2018; 59:320–33. https://doi.org/10.1165/rcmb.2017-0347OC [PubMed]
- 61. Hou Y, Li Y, Gong F, Jin J, Huang A, Fang Q, Ma RZ. A preliminary study on RCN3 protein expression in non-small cell lung cancer. Clin Lab. 2016; 62:293–300. https://doi.org/10.7754/clin.lab.2015.150411 [PubMed]
- 62. Walter K, Min JL, Huang J, Crooks L, Memari Y, McCarthy S, Perry JR, Xu C, Futema M, Lawson D, Iotchkova V, Schiffels S, Hendricks AE, et al, and UK10K Consortium. The UK10K project identifies rare variants in health and disease. Nature. 2015; 526:82–90. https://doi.org/10.1038/nature14962 [PubMed]
- 63. Abecasis GR, Auton A, Brooks LD, DePristo MA, Durbin RM, Handsaker RE, Kang HM, Marth GT, McVean GA, and 1000 Genomes Project Consortium. An integrated map of genetic variation from 1,092 human genomes. Nature. 2012; 491:56–65. https://doi.org/10.1038/nature11632 [PubMed]
- 64. McCarthy S, Das S, Kretzschmar W, Delaneau O, Wood AR, Teumer A, Kang HM, Fuchsberger C, Danecek P, Sharp K, Luo Y, Sidore C, Kwong A, et al, and Haplotype Reference Consortium. A reference panel of 64,976 haplotypes for genotype imputation. Nat Genet. 2016; 48:1279–83. https://doi.org/10.1038/ng.3643 [PubMed]
- 65. Landi MT, Chatterjee N, Yu K, Goldin LR, Goldstein AM, Rotunno M, Mirabello L, Jacobs K, Wheeler W, Yeager M, Bergen AW, Li Q, Consonni D, et al. A genome-wide association study of lung cancer identifies a region of chromosome 5p15 associated with risk for adenocarcinoma. Am J Hum Genet. 2009; 85:679–91. https://doi.org/10.1016/j.ajhg.2009.09.012 [PubMed]
- 66. Zeller T, Wild P, Szymczak S, Rotival M, Schillert A, Castagne R, Maouche S, Germain M, Lackner K, Rossmann H, Eleftheriadis M, Sinning CR, Schnabel RB, et al. Genetics and beyond—the transcriptome of human monocytes and disease susceptibility. PLoS One. 2010; 5:e10693. https://doi.org/10.1371/journal.pone.0010693 [PubMed]
- 67. GTEx Consortium. The genotype-tissue expression (GTEx) project. Nat Genet. 2013; 45:580–85. https://doi.org/10.1038/ng.2653 [PubMed]
- 68. GTEx Consortium. Human genomics. The genotype-tissue expression (GTEx) pilot analysis: multitissue gene regulation in humans. Science. 2015; 348:648–60. https://doi.org/10.1126/science.1262110 [PubMed]
- 69. eGTEx Project. Enhancing GTEx by bridging the gaps between genotype, gene expression, and disease. Nat Genet. 2017; 49:1664–70. https://doi.org/10.1038/ng.3969 [PubMed]
- 70. de Leeuw CA, Mooij JM, Heskes T, Posthuma D. MAGMA: generalized gene-set analysis of GWAS data. PLoS Comput Biol. 2015; 11:e1004219. https://doi.org/10.1371/journal.pcbi.1004219 [PubMed]
- 71. Akula N, Wendland JR, Choi KH, McMahon FJ. An integrative genomic study implicates the postsynaptic density in the pathogenesis of bipolar disorder. Neuropsychopharmacology. 2016; 41:886–95. https://doi.org/10.1038/npp.2015.218 [PubMed]
- 72. Xie C, Mao X, Huang J, Ding Y, Wu J, Dong S, Kong L, Gao G, Li CY, Wei L. KOBAS 2.0: a web server for annotation and identification of enriched pathways and diseases. Nucleic Acids Res. 2011; 39:W316–22. https://doi.org/10.1093/nar/gkr483 [PubMed]
- 73. Ai C, Kong L. CGPS: a machine learning-based approach integrating multiple gene set analysis tools for better prioritization of biologically relevant pathways. J Genet Genomics. 2018; 45:489–504. https://doi.org/10.1016/j.jgg.2018.08.002 [PubMed]
- 74. Warde-Farley D, Donaldson SL, Comes O, Zuberi K, Badrawi R, Chao P, Franz M, Grouios C, Kazi F, Lopes CT, Maitland A, Mostafavi S, Montojo J, et al. The GeneMANIA prediction server: biological network integration for gene prioritization and predicting gene function. Nucleic Acids Res. 2010; 38:W214–20. https://doi.org/10.1093/nar/gkq537 [PubMed]
- 75. Shannon P, Markiel A, Ozier O, Baliga NS, Wang JT, Ramage D, Amin N, Schwikowski B, Ideker T. Cytoscape: a software environment for integrated models of biomolecular interaction networks. Genome Res. 2003; 13:2498–504. https://doi.org/10.1101/gr.1239303 [PubMed]