


Introduction
Neurodegenerative disease is characterized by progressive loss of structures and functions in brain and spinal cord neurons [1]. Common neurodegenerative diseases include Alzheimer's disease (AD), Parkinson's disease (PD), and Huntington's disease (HD). With the increase in global aging, the burden of these diseases is increasing rapidly worldwide [2]. AD is the most serious neurodegenerative disease, affecting approximately 0.6% of the global population [2]. The pathological features of AD include amyloid β and tau protein aggregation, mitochondrial dysfunction and synaptic injury [3, 4]. PD is the second most common neurodegenerative disease characterized by muscle stiffness, bradykinesia and uncontrollable tremors, and its severity causes gradual deterioration [5]. The main pathological anatomy of PD is the loss of large numbers of dopaminergic neurons in the substantia nigra [6]. HD is an autosomal dominant neurodegenerative disease, and the pathological feature is gradual degeneration of the striatal neurons, which affects muscle coordination and causes mental decline and psychopathological problems [7]. Mutations in the huntingtin (HTT) gene is the main cause of HD onset [8].
Multiple neurodegenerative diseases show severe metabolic abnormalities [9]. Damage from oxidative phosphorylation promotes AD, and it has been shown that oxidative damage occurs before Aβ deposition in APP transgenic mouse. The expression of energy metabolism-related genes is also affected in PD and HD [10]. Glutamate metabolism plays a crucial role in learning and memory, synaptic plasticity and neuronal development [11]. Abnormal glutamate metabolism causes neuronal dysfunction and degeneration in chronic neurodegenerative diseases [12]. Disorders of lipid metabolism are associated with AD and other neurodegenerative diseases. Impaired cholesterol metabolism will promote the processing of Aβ and lead to Aβ aggregation [13]. The citric acid cycle is a key link between sugar, lipid and amino acid metabolism and is an important process in energy metabolism. Studies have shown that damage to the citric acid cycle correlates with neurodegenerative disease pathology [14–16]. Lysosomal metabolic abnormalities can lead to decreased energy metabolism and a decreased clearance rate of cellular macromolecules, and studies have shown that dysfunction of lysosomal metabolism is correlated with AD, PD and HD [17].
The above evidence suggests that neurodegenerative diseases may share common metabolic damage. Therefore, the purpose of this study was to explore the common and differential metabolic damage in different brain regions among AD, PD and HD and to screen potential drugs that target the identified key metabolic genes. Furthermore, this study constructed multigene diagnostic models by using the expression profiles of metabolic genes in the blood. We also compared the metabolic differences between mouse models and human diseases.
Results
Overall metabolic change in AD, PD and HD
Human brain transcriptome datasets of GSE5281 (AD) [18], GSE20295 (PD) [19] and GSE3790 (HD) [20] were collected for our reanalysis (Supplementary Table 1). There were no sex differences in any brain regions between cases and controls in these datasets. The age distribution in patients and controls showed no difference in most brain regions except for the PUT and SN in PD (Table 1). We mapped the metabolic genes from the Recon 3D human metabolism model [21] to the above datasets and performed differential expression gene analysis. The ratio of deregulated metabolic genes to total deregulated genes was higher than the ratio of mapped metabolic genes to all genes in most brain regions in the whole cohort, male and female groups, and in all brain regions in the elderly group (Supplementary Figure 1). This finding suggests that deregulated metabolic genes play important roles in these diseases. Through unsupervised clustering of all metabolic gene expression profiles, female patients and controls in the AD and PD datasets were mainly divided into two categories, and the other groups did not achieve the desired classification effect (Supplementary Figures 2–5). Interestingly, three brain regions in HD were divided into distinct classes, whereas there were no significant differences among brain regions in AD or PD in any groups. This indicates that the expression of metabolic genes in HD is brain-region specific.
Table 1. Sex and age information of neurodegenerative disease patients and controls.
| Neurodegenerative diseases | Sex (male/female) | Age (years)1 | |||||||||||||||||||||||||||||||||||||||||||||||||||||||||||||||||||||||||||||||||||||||||||||||||
| Case | Control | P2 | Case | Control | P3 | ||||||||||||||||||||||||||||||||||||||||||||||||||||||||||||||||||||||||||||||||||||||||||||||
| Alzheimer's Disease | |||||||||||||||||||||||||||||||||||||||||||||||||||||||||||||||||||||||||||||||||||||||||||||||||||
| Entorhinal Cortex | 4/6 | 10/3 | 0.102 | 85.6 ± 6.3 | 80.3 ± 9.2 | 0.118 | |||||||||||||||||||||||||||||||||||||||||||||||||||||||||||||||||||||||||||||||||||||||||||||
| Hippocampus | 6/4 | 10/3 | 0.650 | 77.8 ± 5.7 | 79.6 ± 9.4 | 0.574 | |||||||||||||||||||||||||||||||||||||||||||||||||||||||||||||||||||||||||||||||||||||||||||||
| Medial Temporal Gyrus | 10/6 | 8/4 | 1.000 | 79.1 ± 6.4 | 80.1 ± 9.8 | 0.771 | |||||||||||||||||||||||||||||||||||||||||||||||||||||||||||||||||||||||||||||||||||||||||||||
| Posterior Cingulate | 6/3 | 9/4 | 1.000 | 77.6 ± 6.5 | 79.8 ± 9.4 | 0.522 | |||||||||||||||||||||||||||||||||||||||||||||||||||||||||||||||||||||||||||||||||||||||||||||
| Superior Frontal Gyrus | 13/10 | 7/4 | 1.000 | 79.2 ± 7.5 | 79.3 ± 10.2 | 0.977 | |||||||||||||||||||||||||||||||||||||||||||||||||||||||||||||||||||||||||||||||||||||||||||||
| Primary Visual Cortex | 11/8 | 9/3 | 0.452 | 80.2 ± 6.7 | 77.9 ± 6.9 | 0.385 | |||||||||||||||||||||||||||||||||||||||||||||||||||||||||||||||||||||||||||||||||||||||||||||
| Parkinson's Disease | |||||||||||||||||||||||||||||||||||||||||||||||||||||||||||||||||||||||||||||||||||||||||||||||||||
| Prefrontal Cortex | 8/6 | 10/5 | 0.710 | 77.0 ± 6.3 | 71.2 ± 11.1 | 0.095 | |||||||||||||||||||||||||||||||||||||||||||||||||||||||||||||||||||||||||||||||||||||||||||||
| Putamen | 9/6 | 15/5 | 0.467 | 76.7 ± 6.2 | 66.4 ± 13.8 | 0.006 | |||||||||||||||||||||||||||||||||||||||||||||||||||||||||||||||||||||||||||||||||||||||||||||
| Substantia Nigra | 6/5 | 13/5 | 0.432 | 75.5 ± 5.8 | 66.8 ± 14.4 | 0.033 | |||||||||||||||||||||||||||||||||||||||||||||||||||||||||||||||||||||||||||||||||||||||||||||
| Huntington's Disease | |||||||||||||||||||||||||||||||||||||||||||||||||||||||||||||||||||||||||||||||||||||||||||||||||||
| Caudate Nucleus | 23/15 | 23/9 | 0.449 | 59.0 ± 14.9 | 58.4 ± 18.1 | 0.877 | |||||||||||||||||||||||||||||||||||||||||||||||||||||||||||||||||||||||||||||||||||||||||||||
| Frontal Cortex | 22/15 | 19/9 | 0.606 | 56.6 ± 15.5 | 56.1 ± 17.5 | 0.914 | |||||||||||||||||||||||||||||||||||||||||||||||||||||||||||||||||||||||||||||||||||||||||||||
| Cerebellum | 23/16 | 16/11 | 1.000 | 58.3 ± 15.6 | 59.1 ± 17.5 | 0.849 | |||||||||||||||||||||||||||||||||||||||||||||||||||||||||||||||||||||||||||||||||||||||||||||
| 1 Data are presented as the mean ± standard deviation. | |||||||||||||||||||||||||||||||||||||||||||||||||||||||||||||||||||||||||||||||||||||||||||||||||||
| 2 Fisher's exact test was used to compare population sex in the two groups. | |||||||||||||||||||||||||||||||||||||||||||||||||||||||||||||||||||||||||||||||||||||||||||||||||||
| 3 Welch two sample t-test was used to compare population age in the two groups. | |||||||||||||||||||||||||||||||||||||||||||||||||||||||||||||||||||||||||||||||||||||||||||||||||||
Damaged metabolic pathways in AD, PD and HD
Metabolic pathway enrichment results showed that there were more impaired metabolic pathways in multiple brain regions in AD, whereas they were relatively less affected in PD and HD in the whole cohort (Figure 1). Alanine and aspartate metabolism, oxidative phosphorylation, extracellular transport and lysosomal transport were significantly enriched in multiple brain regions in all three diseases. Furthermore, most amino acid metabolism pathways and carbohydrate metabolism pathways were downregulated in at least one brain region in AD and PD (especially in the HIP and PC in AD and the SN in PD), whereas only a few of these metabolic pathways were affected in HD. We also observed a relatively consistent trend of metabolic pathway changes in the male, female and elderly groups (Supplementary Figures 6–8). Notably, male patients showed multiple downregulated metabolic pathways, whereas these pathways were nearly unaffected in the SN in female patients with PD. Pearson correlation analysis showed that there were strong positive correlations among pathways in amino acid metabolism, carbohydrate metabolism, nucleotide metabolism and protein metabolism, whereas pathways in energy metabolism, glycan biosynthesis and metabolism and lipid metabolism showed no or negative correlations with the above pathways in all brain regions (Supplementary Figure 9).
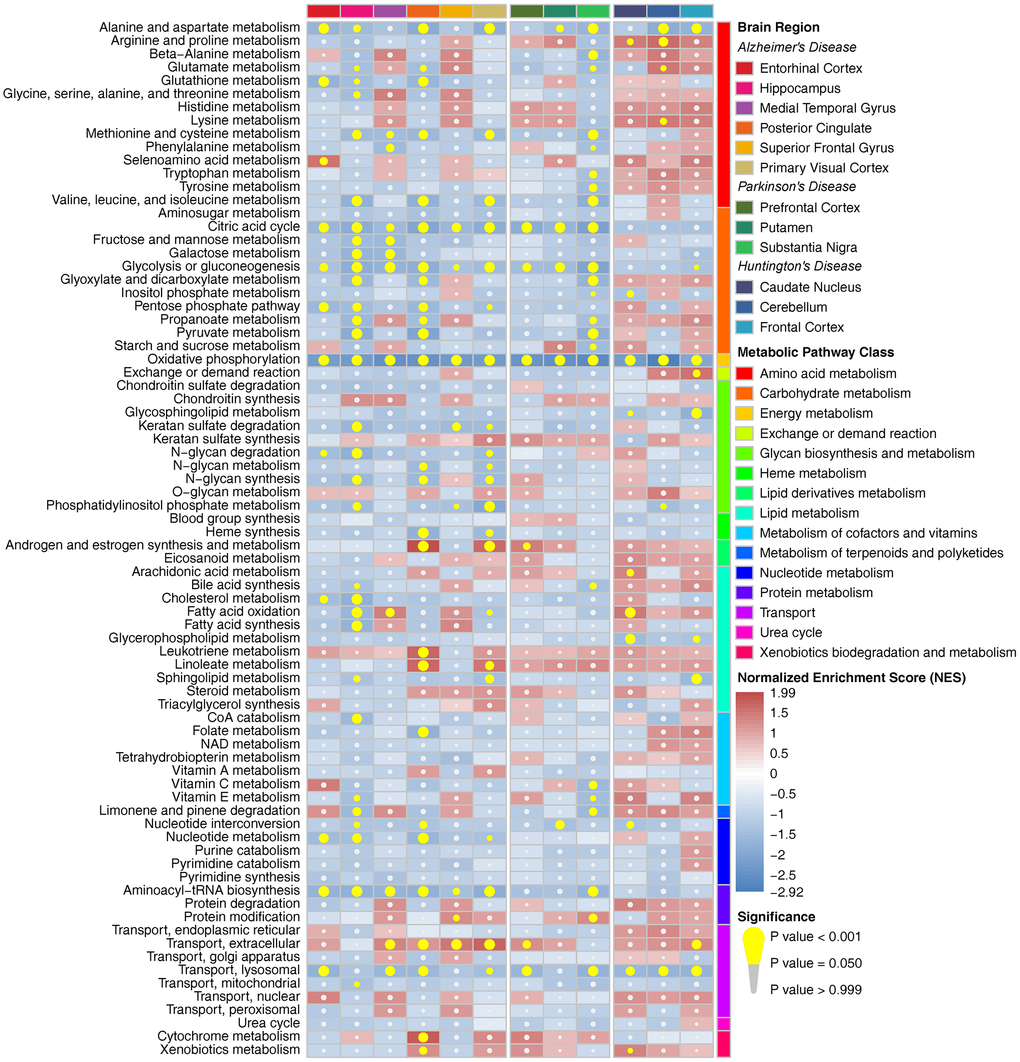
Figure 1. Metabolic pathway enrichment results in three neurodegenerative diseases in the whole cohort. The red box represents the metabolic pathway that is upregulated, and the blue box represents the metabolic pathway that is downregulated. The yellow circle indicates that the metabolic pathway is significantly enriched.
Deregulated metabolic genes shared by multiple brain regions
We compared the commonly and heterogeneous deregulated metabolic genes for the three diseases. There were hundreds of deregulated metabolic genes in AD and relatively few deregulated metabolic genes in PD and HD. Most of these genes were downregulated in more than one brain region, and few upregulated genes were expressed in multiple brain regions (Figure 2). Deregulated metabolic genes shared by multiple brain regions were mostly enriched in amino acid metabolism, signaling transduction, carbohydrate metabolism, energy metabolism and several neurodegenerative disease-related pathways. This finding indicates that deregulated metabolic genes shared by multiple brain regions can accurately reflect the common characteristics of neurodegenerative diseases. Approximately one-third of these metabolic genes were deregulated only in one brain region, and these genes were enriched in relatively specific pathways. Furthermore, there were 92 heterogeneous deregulated genes (upregulated in one brain region and downregulated in another brain region), and most of these genes were found in AD (Supplementary Figure 10).
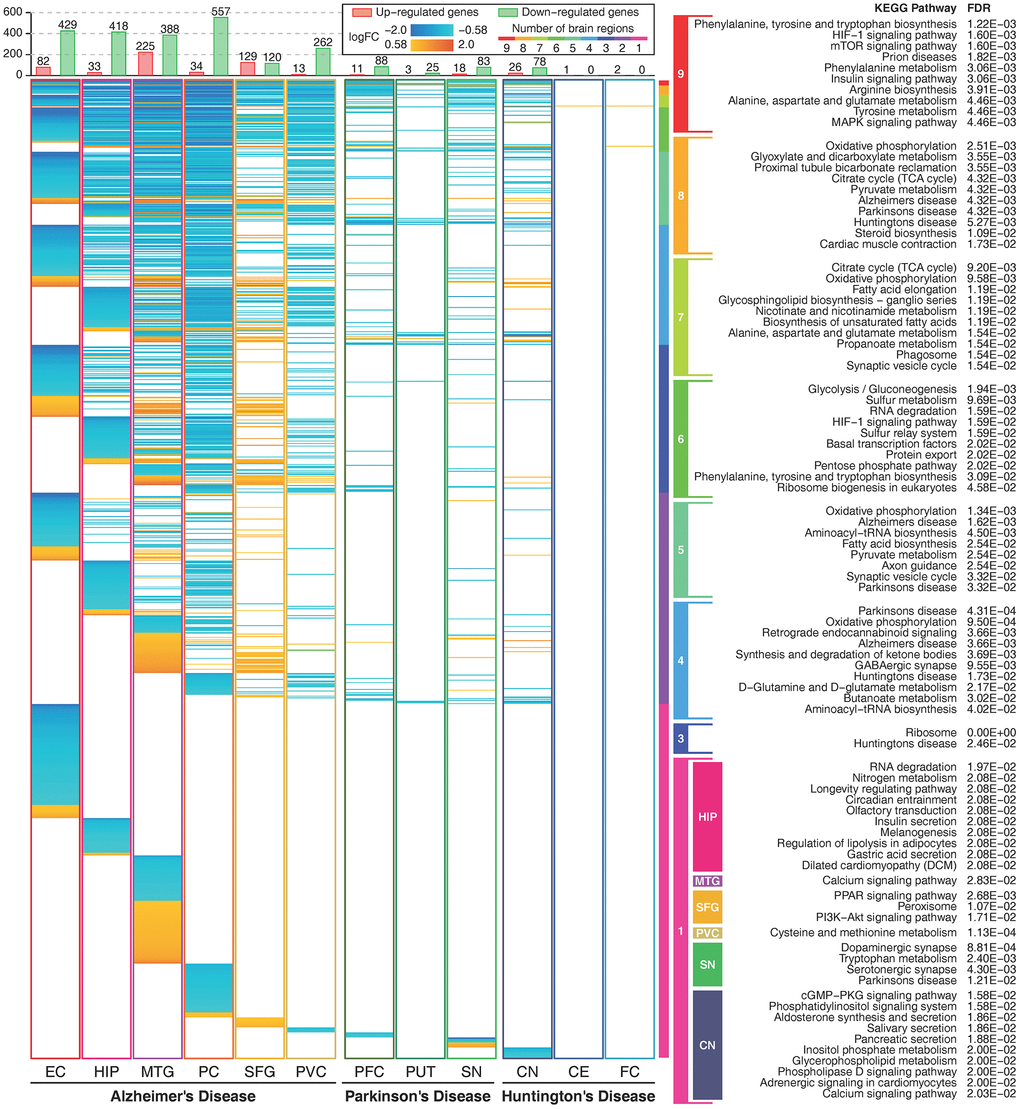
Figure 2. Expression profiles of metabolic genes and their functions. The figure shows metabolic genes with absolute logFC values higher than log2(1.5) in 12 brain regions. The figure shows 1164 unique metabolic genes. The orange color indicates that the gene is upregulated, and the cyan color indicates that the gene is downregulated. The rainbow color bar shows the commonly deregulated genes in multiple brain regions and their correlated metabolic pathways. Enriched metabolic pathways of brain region-specific deregulated genes are shown in colored boxes. Deregulated genes in two brain regions and deregulated genes only in the EC and the PC in AD, and the PFC in PD showed no significant enriched pathways.
Key metabolic genes in AD, PD and HD
There were 40 deregulated metabolic genes shared by the three neurodegenerative diseases, most of which were consistently up- or downregulated in multiple brain regions (Supplementary Figure 11). The gene coexpression network showed that ATP1A1, ATP6V1G2, GOT1, HPRT1, MAP2K1, PCMT1 and PLK2 were significantly correlated with many other metabolic genes in AD, PD and HD (Supplementary Figure 12–14). Furthermore, the average degree of these metabolic genes was higher than 100 (Supplementary Figure 15). Therefore, we defined these genes as key metabolic genes. All of these genes were downregulated in multiple brain regions in AD and PD and in the CN in HD (Figure 3). A brain-specific network showed that these genes were mainly involved in nucleotide metabolic processes (Supplementary Figure 16). In recent years, the anti-aging gene SIRT1 has been identified as an important metabolic gene that is critical to prevent metabolic diseases [22–25] and neurodegenerative diseases [26–28]. In this study, SIRT1 was upregulated in the MTG and downregulated in the PC in AD whereas no difference in PD or HD (Supplementary Figure 17). Furthermore, there were strong positive correlations between SIRT1 and key metabolic genes in the PVC in AD, and negative correlations between SIRT1 and key metabolic genes in the MTG in AD, and the CN and the FC in HD (Supplementary Figure 17).
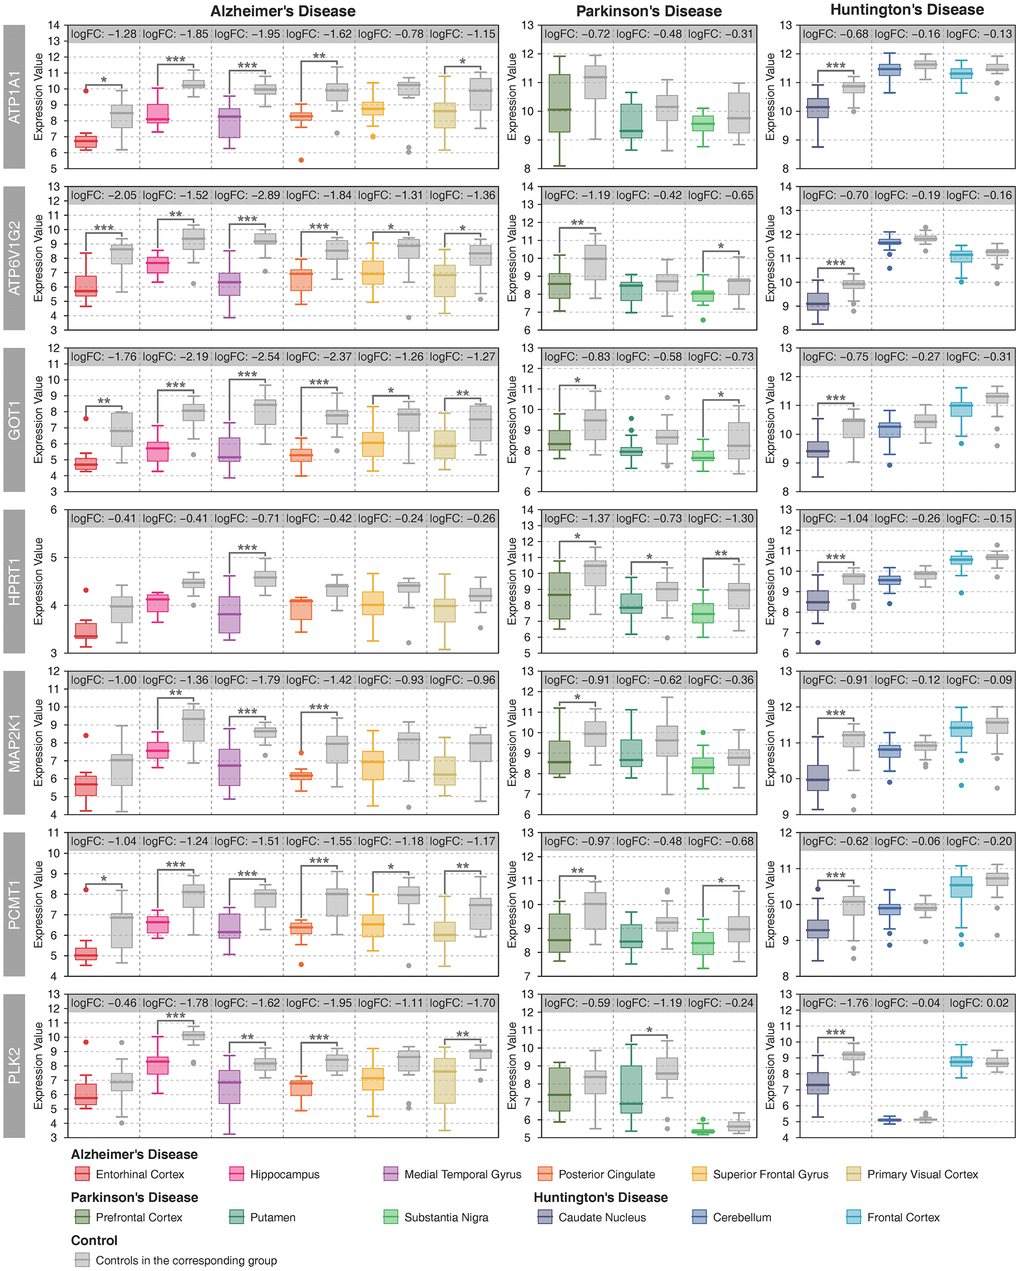
Figure 3. Expression patterns of key metabolic genes. Patient samples with different brain regions are represented by different colors, and the gray color represents the controls in the corresponding group. Student’s t-test was used to compare the expression differences between cases and controls. Statistical significance: * P < 0.05, ** P < 0.01, *** P < 0.001.
Network of brain regions, metabolic pathways, key metabolic genes and drugs
Using the drug and target information from the DrugBank database [29], we constructed a composite network including brain regions, metabolic pathways, key metabolic genes and drugs (Figure 4). In this network, ATP1A1 was involved in extracellular transport, and there were 27 drugs targeting ATP1A1. ATP6V1G2 is involved in lysosomal transport, and there were 5 drugs targeting ATP6V1G2. GOT1 is involved in multiple amino acid metabolism pathways, and there were 6 drugs targeting GOT1. Furthermore, there were 7 drugs targeting HPRT1, 10 drugs targeting MAP2K1, 1 drug targeting PCMT1 and 1 drug targeting PLK2. No drug targeted multiple genes. Forty drugs were approved, and the others were experimental, investigational or nutraceutical drugs. Among these drugs, DB00114 is an activator of GOT1, and most of the other drugs are inhibitors of ATP1A1, ATP6V1G2, HPRT1, MAP2K1 and PLK2. Many drugs targeting ATP1A1 are used for cardiovascular disease treatment, drugs targeting ATP6V1G2 are used for the treatment of osteoporosis and other bone diseases, drugs targeting GOT1 are used for nutritional supplementation, and several drugs targeting HPRT1 and MAP2K1 are used for the treatment of immune-related disease and cancer (Supplementary Table 3).
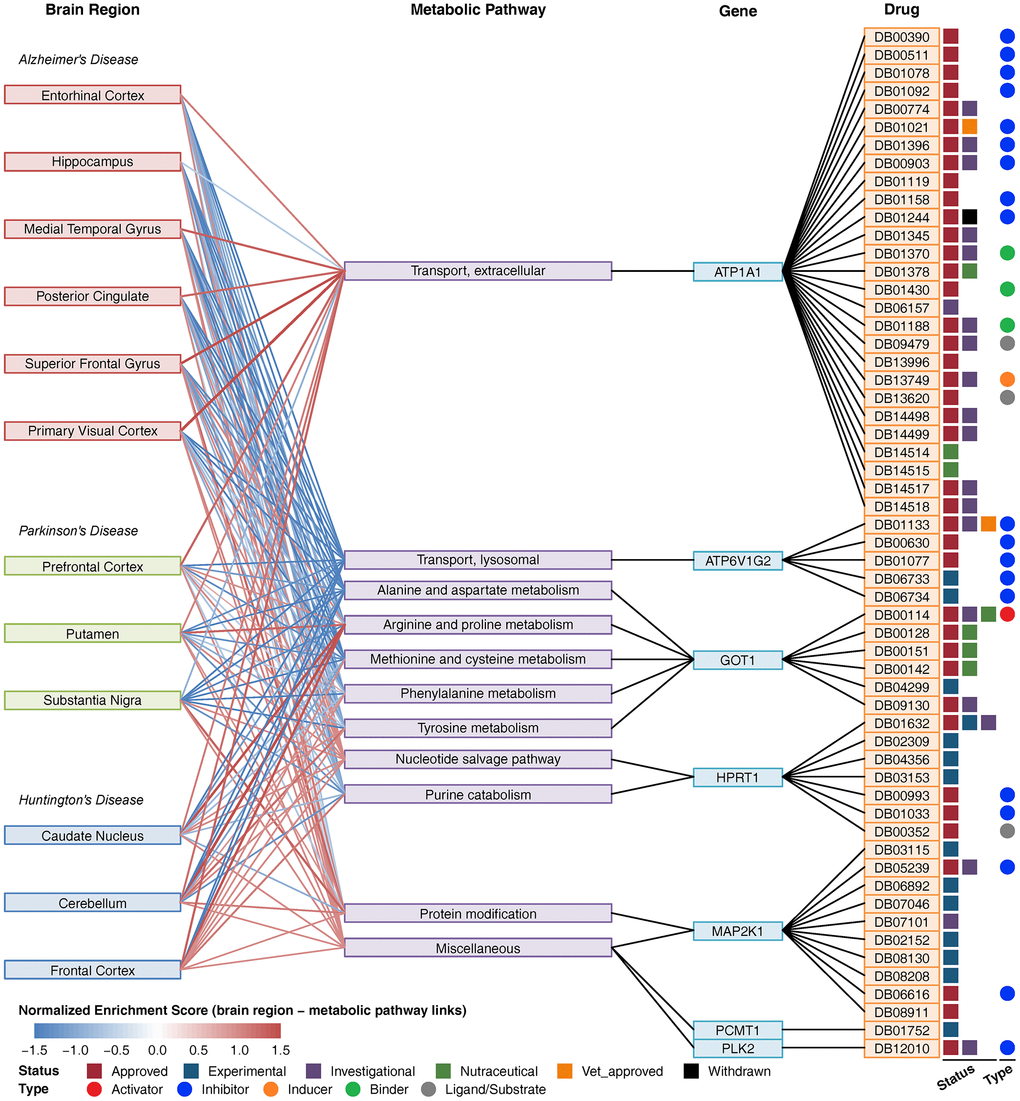
Figure 4. Composite network of brain regions, metabolic pathways, key metabolic genes and drugs. The link between brain region and metabolic pathway shows a normalized enrichment score of the pathway in the brain region. The red color indicates upregulation, and the blue color indicates downregulation. The link between metabolic pathways and genes indicates that the gene is involved in the pathway. The link between the gene and drug indicates that the drug can target the protein encoded by the gene. Drug status (approved, experimental, investigational nutraceutical, vet_approved, and withdrawn) is shown as colored squares. Drug type (activator, inhibitor, inducer, binder, ligand/substrate) is shown as colored circles.
Multigene diagnostic models for AD, PD and HD
Expression profiles of metabolic genes in human blood transcriptome datasets (Supplementary Table 2) were used to construct multigene diagnostic models for AD, PD and HD. Multigene diagnosis models were built using the metabolic genes in the experimental set, and tested in the validation set. The optimal model for AD is the combination of 20 metabolic genes (Figure 5A), which had the highest AUC of 0.997 in the experimental set and a high AUC of 0.822 in the validation set (Figure 5B). The optimal model for PD is the combination of 20 metabolic genes (Figure 5C), which had the highest AUC of 0.879 in the experimental set and a high AUC of 0.817 in the validation set (Figure 5D). The optimal model for HD is the combination of 15 metabolic genes (Figure 5E), which reached the maximum AUC of 1.000 in both the experimental and validation sets (Figure 5F). The MCC values were high than 0.9 in AD experimental set, HD experimental and validation sets. KEGG enrichment results showed that genes in these diagnostic models were correlated with multiple neurodegenerative disease-related pathways (Figure 5G–5I). These results suggest that the expression profiles of metabolic genes in blood can be used for the highly accurate diagnosis of AD, PD and HD.
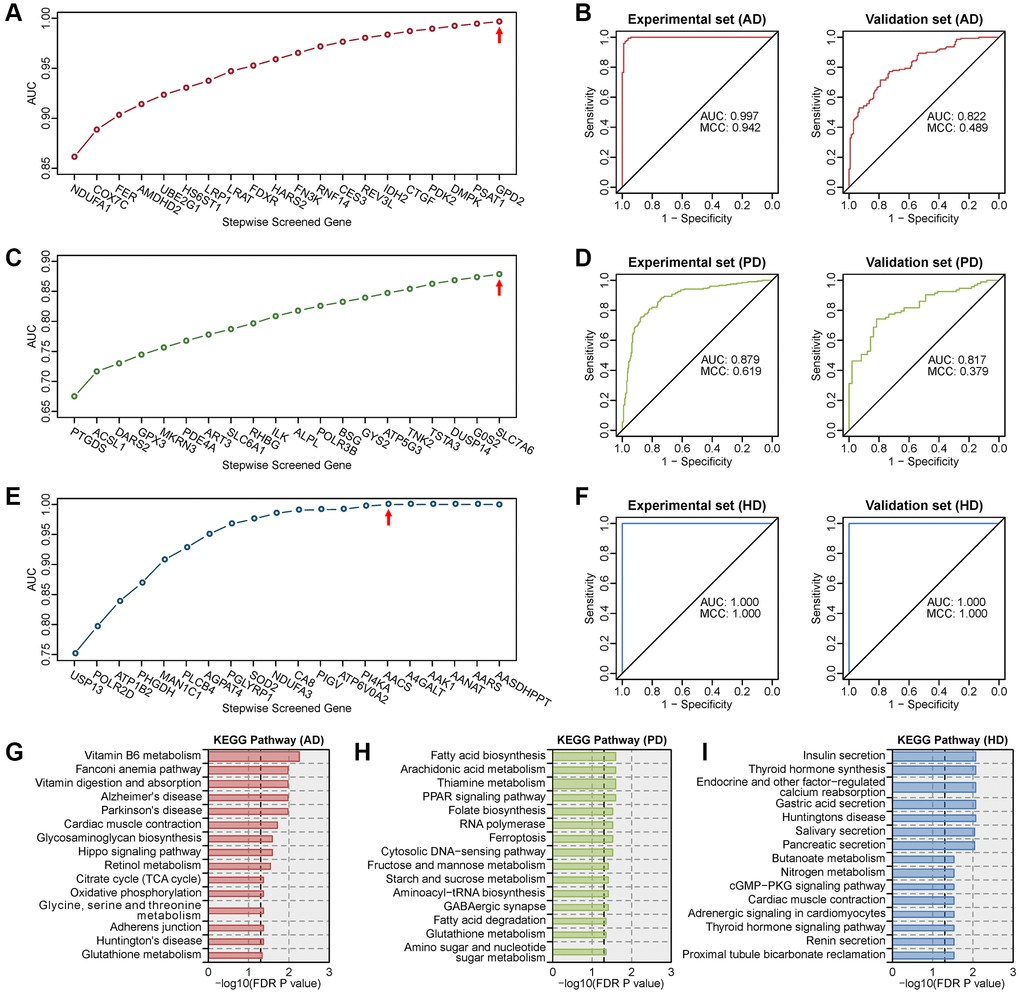
Figure 5. Screening of the optimal multigene diagnostic model for three diseases. (A) Stepwise screened multigene prediction models in AD. (B) Receiver operating characteristic (ROC) curves of the screened optimal diagnostic model in AD. (C) Stepwise screened multigene prediction models in PD. (D) ROC curves of the screened optimal diagnostic model in PD. (E) Stepwise screened multigene prediction models in HD. (F) ROC curves of the screened optimal diagnostic model in HD. For panels A, C and E, from left to right on the x-axis (stepwise screened genes), each additional gene corresponds to a model (for example, in panel A, NDUFA1 represents model 1, which contains one gene, NDUFA1; COX7C represents model 2, which contains two genes including NDUFA1 and COX7C). The red arrow shows the optimal model for each disease. Area under the curve (AUC) and Matthews correlation coefficient (MCC) were shown in the ROC curve. Details of the experimental set and validation set are provided in Supplementary Table 2. (G) Enriched KEGG pathway analysis of genes in the optimal diagnostic model for AD. (H) Enriched KEGG pathway analysis of genes in the optimal diagnostic model for PD. (I) Enriched KEGG pathway analysis of genes in the optimal diagnostic model for HD.
Metabolic gene and pathway changes in mouse models
There were 720, 1327 and 1024 metabolic genes that showed consistent expression trends in all brain regions in AD, PD and HD, respectively. We compared the metabolic changes between human diseases and mouse models (Supplementary Table 4). Deregulated metabolic genes were filtered in at least one brain region in each disease, and only 102, 14, and 32 metabolic genes showed the same expression trends in APP transgenic mouse, MPTP-treated mouse and Hdh CAG knock-in mouse models (Figure 6A–6C). However, almost all these genes showed no expression changes in mouse models. The functions of these metabolic genes were correlated with oxidative phosphorylation, GABAergic synapses and other neurodegenerative disease-related pathways in PD but not in AD or HD (Figure 6D–6F). Furthermore, metabolic pathway enrichment results showed that amino acid metabolism, carbohydrate metabolism, energy metabolism and other metabolic pathways that were severely impaired in human patients were only slightly affected in mouse models (Supplementary Figure 18). The expression of key metabolic genes in mouse models also showed no difference (Supplementary Figure 19). These results suggest that mouse models cannot accurately reflect human metabolic characteristics in neurodegenerative diseases.
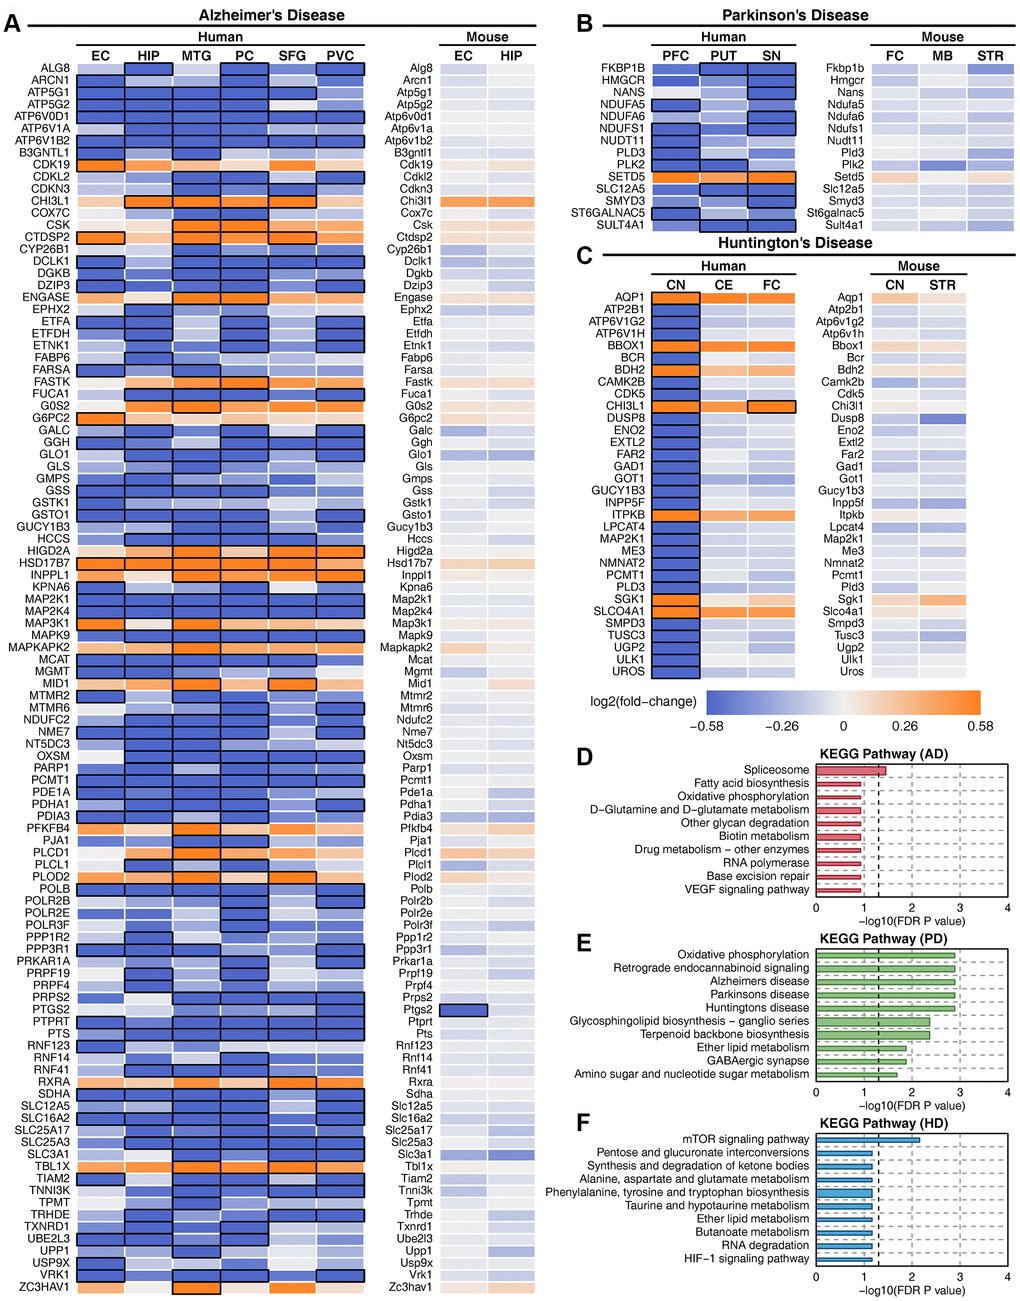
Figure 6. Deregulated metabolic genes with consistent expression between human patients and mouse models. (A) Heatmap of consistently expressed deregulated genes in AD human samples and the APP transgenic mouse model. (B) Heatmap of consistently expressed deregulated genes in PD human samples and the MPTP mouse model. (C) Heatmap of consistently expressed deregulated genes in HD human samples and the Hdh CAG knock-in mouse model. The orange color indicates that the gene is upregulated, the blue color indicates that the gene is downregulated, and black squares indicate statistical significance. (D) Enriched metabolic pathway of consistently expressed deregulated genes in AD. (E) Enriched metabolic pathway of consistently expressed deregulated genes in PD. (F) Enriched metabolic pathway of consistently expressed deregulated genes in HD.
Discussion
Although there were different degrees of metabolic damage in AD, PD and HD, most metabolic genes and pathways showed consistent downregulated trends in these three diseases, and fewer genes were expressed inconsistently in different brain regions. This study identified ATP1A1, ATP6V1G2, GOT1, HPRT1, MAP2K1, PCMT1 and PLK2 as key metabolic genes in AD, PD and HD. ATP1A1 encodes subunit alpha 1 of Na+/K+-ATPase, which is crucial for establishing and maintaining the electrochemical gradients of Na and K ions across the plasma membrane. Decreased levels of Na+/K+-ATPase cause energy deficiency in multiple neurodegenerative diseases [30]. ATP6V1G2 encodes subunit G2 of vacuolar ATPase (V-ATPase), which transports protons from the cytoplasm into the lysosome and maintains lysosomal acidification. V-ATPase deficiency can lead to central nervous system (CNS) diseases such as AD and PD [31, 32]. GOT1 encodes glutamic oxaloacetic transaminase in the cytoplasm, and downregulated GOT1 was found both in the elderly population and AD patients [33]. HPRT1 encodes hypoxanthine phosphoribosyltransferase 1, and mutated HPRT1 affects amyloid precursor protein (APP) gene expression in AD and amyotrophic lateral sclerosis (ALS) [34]. MAP2K1 regulates a wide variety of extra- and intracellular signals. The compromised MAPK signaling pathways contribute to the pathology of diverse human diseases, including cancer and neurodegenerative disorders such as AD, PD and ALS [35]. PCMT1 plays a role in protein repair; downregulated PCMT1 expression makes it difficult to repair proteins involved in apoptosis and could contribute to the neuronal cell death observed in PD [36]. PLK2 is a homeostatic repressor of neuronal overexcitation, which promotes APP β-processing in AD [37] and catalyzes α-synuclein in PD [38].
This study identified 57 drugs that target the above key metabolic genes. Digoxin (DB00390) is an endogenous inhibitor of membrane Na+/K+-ATPase, which is used to treat chronic atrial fibrillation and mild to moderate heart failure. Molecular docking showed that digoxin may regulate metabolic functions in AD by combining with G protein-coupled receptors [39]. A previous clinical trial showed that digoxin has a good effect on the treatment of PD [40]. Furthermore, serum digoxin can regulate neutral amino acid transport and mitochondrial functions in HD patients [41]. Ouabain (DB01092) is able to inhibit Na+/K+-ATPase activity in multiple brain regions [42]. Animal experiments have shown that ouabain induces downstream autophagy-lysosomal gene expression and cellular restorative properties and reduces the accumulation of abnormal toxic tau protein [43]. Diazoxide (DB01119) is mainly used to treat hyperinsulinemic hypoglycemia, and animal experiments have shown that diazoxide can also be used in the treatment of PD [44]. There was no report on the treatment of neurodegenerative diseases for most of the drugs screened in this study. Therefore, further investigation of these drugs for the treatment of AD, PD and HD is worthwhile.
There are still tremendous difficulties in building reliable and reproducible diagnostic models for neurodegenerative diseases. Increasing research suggests that the blood transcriptome signature may enable accurate diagnosis of these diseases. A recent study showed that the combination of a multitissue RNA signature can accurately diagnose AD and other aging-related diseases [45]. Many studies have reported that blood-based biomarkers could be potential predictors for PD, such as α-synuclein, DJ-1, and uric acid [46], and blood-based gene signatures also showed high accuracy in PD diagnosis [47]. Furthermore, previous studies showed that the gene signature in peripheral blood can be used for accurate diagnosis of HD [48, 49]. This study constructed multigene diagnostic models for AD, PD and HD by using metabolic gene expression profiles in blood. All models showed high accuracy both in the experimental set and validation set. Therefore, the diagnosis of neurodegenerative diseases using metabolic gene signatures in blood may be an effective method.
The mouse model is the most widely used animal model in neurodegenerative disease studies and can partially reflect the behavioral, pathological and genetic characteristics of human diseases [50]. Rodents do not develop AD, and the existing AD transgenic mouse models can only reflect limited human disease characteristics [51]. There are large differences in gene expression signatures in neuroimmune and neurodegenerative pathways between human and APP transgenic mouse models [52]. The gene expression profiles of microglial activation states in AD patients are not apparent in mouse models [53]. Furthermore, a meta-analysis including 33 microarray studies of PD shows that consistent features in human datasets are not shown in mouse models [54]. Fortunately, the HD mouse model is relatively successful and can model early-onset states in humans [55]. This study revealed almost no consistency of metabolic changes between human neurodegenerative disease patients and mouse models. Therefore, we speculate that mouse models may not be suitable for studying the metabolic mechanisms of neurodegenerative diseases.
In conclusion, there was severe metabolic damage in AD, PD and HD. Most metabolic damage, such as amino acid metabolism, carbohydrate metabolism, energy metabolism and multiple transport metabolism, is common to all three diseases. We identified 7 key metabolic genes that were downregulated in all three diseases and screened 57 drugs that target these genes. Some drugs have been reported to be effective in the treatment of neurodegenerative diseases. Furthermore, metabolic gene expression profiles in blood can be used for the diagnosis of AD, PD and HD. This study also found considerable metabolic differences between mouse models and human diseases.
Materials and Methods
Neurodegenerative disease data collection
Microarray datasets of AD, PD and HD were downloaded from the Gene Expression Omnibus (GEO) database (http://www.ncbi.nlm.nih.gov/geo/). We conducted rigorous screening of these datasets with the following inclusion criteria: (1) the human microarray datasets were genome-wide; (2) samples in each study should include cases and controls; (3) each dataset should contain multiple brain regions; and (4) raw data or expression matrixes were available. Because these neurodegenerative diseases may be affected by age and sex factors, we tried to screen the datasets without age or sex bias between patients and controls. According to the above criteria, we finally chose GSE5281 (AD) [18], GSE20295 (PD) [19] and GSE3790 (HD) [20] for our reanalysis (Supplementary Table 1). For details on data preprocessing, see our previous reports [56, 57]. The brain regions in the AD dataset include the entorhinal cortex (EC), hippocampus (HIP), medial temporal gyrus (MTG), posterior cingulate (PC), superior frontal gyrus (SFG), and primary visual cortex (PVC). The brain regions in the PD dataset include the prefrontal cortex (PFC), putamen (PUT), and substantia nigra (SN). The brain regions in the HD dataset include the caudate nucleus (CN), cerebellum (CE) and frontal cortex (FC). Considering the potential effects of sex and age, we analyzed the metabolic changes in the whole cohort, male, female, and elderly (age ≥ 60 years) groups.
Metabolic gene collection
Human metabolic genes were extracted from the Recon 3D human metabolism model [21]. This model contains 3,288 metabolic genes that belong to 105 metabolic pathways. Due to the different analysis platforms of the datasets we collected, we screened the metabolic genes shared by all datasets for analysis. In total, we mapped 2455 unique metabolic genes in our datasets.
Differential expression gene analysis
Bioinformatics analysis of the microarray data was carried out by R statistical software v3.6.1 and Bioconductor Library. Differential gene expression analysis was performed using the empirical Bayesian algorithm in the limma package in R [58]. Up- and downregulated genes were defined as a log2 transformed fold-change (logFC) ≥ log2(1.5) or ≤ log2(1/1.5) for patients compared with controls. A false discovery rate (FDR)-corrected P value ≤ 0.05 was considered significant. The pheatmap package in R was used to show the gene expression profiles, and the clustering method was chosen as "ward.D2".
Metabolic pathway enrichment analysis
We used javaGSEA desktop application v3.0 to perform gene set enrichment analysis (GSEA) of affected metabolic pathways for a total of 12 brain regions in AD, PD and HD. The extracted metabolic genes and pathways from Recon3D were used to construct gene sets for enrichment analysis. Gene sets with fewer than 10 genes or more than 500 genes were excluded. The t-statistic mean of the genes was computed for each metabolic pathway using a permutation test with 1000 replications. Up- and downregulated metabolic pathways were defined as a normalized enrichment score (NES) > 0 or < 0 for patients compared with controls. An FDR-corrected P value ≤ 0.05 was considered significant.
Coexpression network analysis and key metabolic gene screen
Pearson’s correlation coefficient was calculated for each gene-gene pair of all metabolic genes in AD, PD and HD. Gene-gene pairs with an absolute value of correlation coefficient higher than 0.75 and an FDR-corrected P value ≤ 0.05 were considered significantly correlated. Significant gene-gene pairs were used to construct the gene coexpression networks. The selection criteria for key metabolic genes are as follows: (1) The absolute of logFC of metabolic genes is higher than log2(1.5) in at least one brain region in each disease. (2) The average number of nodes of metabolic genes in gene coexpression networks is higher than 100.
Brain-specific gene network analysis
Brain-specific gene network analysis was performed using the HumanBase web server (https://hb.flatironinstitute.org/) [59]. The screened key metabolic genes were used as input genes to perform the gene network analysis. The tissue option in parameter settings was chosen as the brain, and the data types option included coexpression, interaction, TF binding and GSEA perturbations. The minimum interaction confidence and the maximum number of genes were determined using default settings. The server generated a gene network of the queried genes and other genes that interacted with these genes, and GO biological process enrichment analysis of the genes in the network was performed.
Drug discovery and composite network construction
Drugs that interact with the screened key metabolic genes were searched from the DrugBank database (https://www.drugbank.ca/) [29]. Information was obtained on the ID, name, status, types, and indication/associated conditions of the screened drugs. Then, we constructed a composite network of 12 brain regions in AD, PD and HD, deregulated metabolic pathways, key metabolic genes and drugs.
Blood transcriptome analysis and multigene diagnosis model
To investigate the effects of metabolic gene expression profiles in disease diagnosis, we downloaded blood transcriptome datasets of AD, PD and HD from the GEO database. Each disease contains an experimental dataset and a validation dataset (Supplementary Table 2). Multigene diagnosis models were built using the metabolic genes in the experimental set, and the validation set was used to test the predictive accuracy of the model. A univariate logistic regression model was used to calculate the odds ratios of the metabolic genes in each disease. The receiver operating characteristic (ROC) curve and the area under the curve (AUC) of the single metabolic genes were calculated using the pROC package in R. The model with the largest AUC was defined as the optimal model. A stepwise modeling strategy was used to screen the optimal multigene combination models for each disease. The maximum number of metabolic genes in the model is set to 20. First, the gene with the largest AUC was selected. Then, we used a multivariate logistic regression model to generate the combined effect of the selected gene and each of the remaining genes. Next, we selected the best two-gene model with the highest AUC and repeated the previous steps. Finally, we selected the optimal model with the highest AUC in each multigene combination model. Matthews correlation coefficient (MCC) [60] was calculated for each optimal model.
Mouse model analysis
Since mouse models are widely used in the study of neurodegenerative diseases, we analyzed the changes in metabolic genes and pathways in three mouse models (APP transgenic mouse for AD, MPTP-treated mouse for PD and Hdh CAG knock-in mouse for HD) and compared them with human disease. Datasets of mouse models were downloaded from the GEO database. Each mouse model contains transcriptome data for multiple brain regions (Supplementary Table 4). We screened metabolic genes with consistent expression trends in all brain regions in each disease and compared the expression changes of these genes in mouse models.
Author Contributions
WXL, JFH and LX designed the study. WXL, GHL, XT, PPY and SXD performed data collection and analysis. WXL, GHL and SXD wrote and revised the manuscript. All authors read and approved the final manuscript.
Conflicts of Interest
The authors declare that they have no conflicts of interest.
Funding
This work was supported by the National Basic Research Program of China (No. 2013CB835100), the Strategic Priority Research Program of Chinese Academy of Sciences (No. XDBS01020100), the National Natural Science Foundation of China (81870307), the University Special Innovative Research Program of Department of Education of Guangdong Province (2017KTSCX189), the Start-up Fund of Kunming University of Science and Technology (No. KKZ3201927005), and Yunnan Fundamental Research Projects (No. 2019FB050).
References
- 1. Hardy J. Pathways to primary neurodegenerative disease. Ann N Y Acad Sci. 2000; 924:29–34. https://doi.org/10.1111/j.1749-6632.2000.tb05556.x [PubMed]
- 2. Prince M, Wimo A, Guerchet M, Ali GC, Wu YT, Prina M. World Alzheimer Report 2015: The Global Impact of Dementia. Alzheimer’s Disease International (ADI), London. 2015.
- 3. Querfurth HW, LaFerla FM. Alzheimer’s disease. N Engl J Med. 2010; 362:329–44. https://doi.org/10.1056/NEJMra0909142 [PubMed]
- 4. Lei H. Amyloid and alzheimer’s disease. Protein Cell. 2010; 1:312–14. https://doi.org/10.1007/s13238-010-0046-6 [PubMed]
- 5. Pringsheim T, Jette N, Frolkis A, Steeves TD. The prevalence of parkinson’s disease: a systematic review and meta-analysis. Mov Disord. 2014; 29:1583–90. https://doi.org/10.1002/mds.25945 [PubMed]
- 6. Recasens A, Dehay B. Alpha-synuclein spreading in parkinson’s disease. Front Neuroanat. 2014; 8:159. https://doi.org/10.3389/fnana.2014.00159 [PubMed]
- 7. Bano D, Zanetti F, Mende Y, Nicotera P. Neurodegenerative processes in huntington’s disease. Cell Death Dis. 2011; 2:e228. https://doi.org/10.1038/cddis.2011.112 [PubMed]
- 8. Andrew S, Theilmann J, Almqvist E, Norremolle A, Lucotte G, Anvret M, Sorensen SA, Turpin JC, Hayden MR. DNA analysis of distinct populations suggests multiple origins for the mutation causing huntington disease. Clin Genet. 1993; 43:286–94. https://doi.org/10.1111/j.1399-0004.1993.tb03820.x [PubMed]
- 9. DiMauro S, Schon EA. Mitochondrial respiratory-chain diseases. N Engl J Med. 2003; 348:2656–68. https://doi.org/10.1056/NEJMra022567 [PubMed]
- 10. Lin MT, Beal MF. Mitochondrial dysfunction and oxidative stress in neurodegenerative diseases. Nature. 2006; 443:787–95. https://doi.org/10.1038/nature05292 [PubMed]
- 11. Ribeiro FM, Vieira LB, Pires RG, Olmo RP, Ferguson SS. Metabotropic glutamate receptors and neurodegenerative diseases. Pharmacol Res. 2017; 115:179–91. https://doi.org/10.1016/j.phrs.2016.11.013 [PubMed]
- 12. Lau A, Tymianski M. Glutamate receptors, neurotoxicity and neurodegeneration. Pflugers Arch. 2010; 460:525–42. https://doi.org/10.1007/s00424-010-0809-1 [PubMed]
- 13. Di Paolo G, Kim TW. Linking lipids to alzheimer’s disease: cholesterol and beyond. Nat Rev Neurosci. 2011; 12:284–96. https://doi.org/10.1038/nrn3012 [PubMed]
- 14. Chou JL, Shenoy DV, Thomas N, Choudhary PK, Laferla FM, Goodman SR, Breen GA. Early dysregulation of the mitochondrial proteome in a mouse model of alzheimer’s disease. J Proteomics. 2011; 74:466–79. https://doi.org/10.1016/j.jprot.2010.12.012 [PubMed]
- 15. Borlongan CV, Koutouzis TK, Sanberg PR. 3-nitropropionic acid animal model and huntington’s disease. Neurosci Biobehav Rev. 1997; 21:289–93. https://doi.org/10.1016/s0149-7634(96)00027-9 [PubMed]
- 16. Berndt N, Holzhütter HG, Bulik S. Implications of enzyme deficiencies on mitochondrial energy metabolism and reactive oxygen species formation of neurons involved in rotenone-induced parkinson’s disease: a model-based analysis. FEBS J. 2013; 280:5080–93. https://doi.org/10.1111/febs.12480 [PubMed]
- 17. Settembre C, Fraldi A, Medina DL, Ballabio A. Signals from the lysosome: a control centre for cellular clearance and energy metabolism. Nat Rev Mol Cell Biol. 2013; 14:283–96. https://doi.org/10.1038/nrm3565 [PubMed]
- 18. Liang WS, Reiman EM, Valla J, Dunckley T, Beach TG, Grover A, Niedzielko TL, Schneider LE, Mastroeni D, Caselli R, Kukull W, Morris JC, Hulette CM, et al. Alzheimer’s disease is associated with reduced expression of energy metabolism genes in posterior cingulate neurons. Proc Natl Acad Sci USA. 2008; 105:4441–46. https://doi.org/10.1073/pnas.0709259105 [PubMed]
- 19. Zhang Y, James M, Middleton FA, Davis RL. Transcriptional analysis of multiple brain regions in parkinson’s disease supports the involvement of specific protein processing, energy metabolism, and signaling pathways, and suggests novel disease mechanisms. Am J Med Genet B Neuropsychiatr Genet. 2005; 137B:5–16. https://doi.org/10.1002/ajmg.b.30195 [PubMed]
- 20. Hodges A, Strand AD, Aragaki AK, Kuhn A, Sengstag T, Hughes G, Elliston LA, Hartog C, Goldstein DR, Thu D, Hollingsworth ZR, Collin F, Synek B, et al. Regional and cellular gene expression changes in human huntington’s disease brain. Hum Mol Genet. 2006; 15:965–77. https://doi.org/10.1093/hmg/ddl013 [PubMed]
- 21. Brunk E, Sahoo S, Zielinski DC, Altunkaya A, Dräger A, Mih N, Gatto F, Nilsson A, Preciat Gonzalez GA, Aurich MK, Prlić A, Sastry A, Danielsdottir AD, et al. Recon3D enables a three-dimensional view of gene variation in human metabolism. Nat Biotechnol. 2018; 36:272–81. https://doi.org/10.1038/nbt.4072 [PubMed]
- 22. Martins IJ. Nutritional and Genotoxic Stress Contributes to Diabetes and Neurodegenerative Diseases such as Parkinson's and Alzheimer's Diseases. Frontiers in Clinical Drug Research - CNS and Neurological Disorders. 2015; 3:158–92. https://doi.org/10.2174/9781608059263114030008
- 23. Martins IJ. Anti-Aging Genes Improve Appetite Regulation and Reverse Cell Senescence and Apoptosis in Global Populations. Adv Aging Res. 2016; 5:9–26. https://doi.org/10.4236/aar.2016.51002
- 24. Martins IJ. Single Gene Inactivation with Implications to Diabetes and Multiple Organ Dysfunction Syndrome. J Clin Epigenet. 2017; 3. https://doi.org/10.21767/2472-1158.100058
- 25. Martins IJ. Sirtuin 1, a Diagnostic Protein Marker and its Relevance to Chronic Disease and Therapeutic Drug Interventions. EC Pharmacol Toxicol. 2018; 6:209–15.
- 26. Duan W. Targeting sirtuin-1 in huntington’s disease: rationale and current status. CNS Drugs. 2013; 27:345–52. https://doi.org/10.1007/s40263-013-0055-0 [PubMed]
- 27. Singh P, Hanson PS, Morris CM. SIRT1 ameliorates oxidative stress induced neural cell death and is down-regulated in parkinson’s disease. BMC Neurosci. 2017; 18:46. https://doi.org/10.1186/s12868-017-0364-1 [PubMed]
- 28. Rizzi L, Roriz-Cruz M. Sirtuin 1 and alzheimer’s disease: an up-to-date review. Neuropeptides. 2018; 71:54–60. https://doi.org/10.1016/j.npep.2018.07.001 [PubMed]
- 29. Wishart DS, Knox C, Guo AC, Shrivastava S, Hassanali M, Stothard P, Chang Z, Woolsey J. DrugBank: a comprehensive resource for in silico drug discovery and exploration. Nucleic Acids Res. 2006; 34:D668–72. https://doi.org/10.1093/nar/gkj067 [PubMed]
- 30. Kinoshita PF, Leite JA, Orellana AM, Vasconcelos AR, Quintas LE, Kawamoto EM, Scavone C. The influence of na(+), K(+)-ATPase on glutamate signaling in neurodegenerative diseases and senescence. Front Physiol. 2016; 7:195. https://doi.org/10.3389/fphys.2016.00195 [PubMed]
- 31. Lee JH, Yu WH, Kumar A, Lee S, Mohan PS, Peterhoff CM, Wolfe DM, Martinez-Vicente M, Massey AC, Sovak G, Uchiyama Y, Westaway D, Cuervo AM, Nixon RA. Lysosomal proteolysis and autophagy require presenilin 1 and are disrupted by alzheimer-related PS1 mutations. Cell. 2010; 141:1146–58. https://doi.org/10.1016/j.cell.2010.05.008 [PubMed]
- 32. Williamson WR, Hiesinger PR. On the role of v-ATPase V0a1-dependent degradation in alzheimer disease. Commun Integr Biol. 2010; 3:604–07. https://doi.org/10.4161/cib.3.6.13364 [PubMed]
- 33. Zheng JJ, Li WX, Liu JQ, Guo YC, Wang Q, Li GH, Dai SX, Huang JF. Low expression of aging-related NRXN3 is associated with alzheimer disease: a systematic review and meta-analysis. Medicine (Baltimore). 2018; 97:e11343. https://doi.org/10.1097/MD.0000000000011343 [PubMed]
- 34. Nguyen KV, Nyhan WL. Quantification of various APP-mRNA isoforms and epistasis in lesch-nyhan disease. Neurosci Lett. 2017; 643:52–58. https://doi.org/10.1016/j.neulet.2017.02.016 [PubMed]
- 35. Kim EK, Choi EJ. Compromised MAPK signaling in human diseases: an update. Arch Toxicol. 2015; 89:867–82. https://doi.org/10.1007/s00204-015-1472-2 [PubMed]
- 36. Ouazia D, Levros LC
Jr , Rassart E, Desrosiers RR. Dopamine down-regulation of protein L-isoaspartyl methyltransferase is dependent on reactive oxygen species in SH-SY5Y cells. Neuroscience. 2014; 267:263–76. https://doi.org/10.1016/j.neuroscience.2014.03.001 [PubMed] - 37. Lee JS, Lee Y, André EA, Lee KJ, Nguyen T, Feng Y, Jia N, Harris BT, Burns MP, Pak DT. Inhibition of polo-like kinase 2 ameliorates pathogenesis in alzheimer’s disease model mice. PLoS One. 2019; 14:e0219691. https://doi.org/10.1371/journal.pone.0219691 [PubMed]
- 38. Dahmene M, Bérard M, Oueslati A. Dissecting the molecular pathway involved in PLK2 kinase-mediated α-synuclein-selective autophagic degradation. J Biol Chem. 2017; 292:3919–28. https://doi.org/10.1074/jbc.M116.759373 [PubMed]
- 39. Li Y, Zheng W, Qiqige W, Cao S, Ruan J, Zhang Y. A novel method for drug screen to regulate G protein-coupled receptors in the metabolic network of alzheimer’s disease. Biomed Res Int. 2018; 2018:5486403. https://doi.org/10.1155/2018/5486403 [PubMed]
- 40. Taylor A, Beerahee A, Citerone D, Davy M, Fitzpatrick K, Lopez-Gil A, Stocchi F. The effect of steady-state ropinirole on plasma concentrations of digoxin in patients with parkinson’s disease. Br J Clin Pharmacol. 1999; 47:219–22. https://doi.org/10.1046/j.1365-2125.1999.00867.x [PubMed]
- 41. Kumar AR, Kurup PA. Endogenous sodium-potassium ATPase inhibition related biochemical cascade in trisomy 21 and huntington’s disease: neural regulation of genomic function. Neurol India. 2002; 50:174–80. [PubMed]
- 42. Harik SI, Mitchell MJ, Kalaria RN. Ouabain binding in the human brain. Effects of alzheimer’s disease and aging. Arch Neurol. 1989; 46:951–54. https://doi.org/10.1001/archneur.1989.00520450021013 [PubMed]
- 43. Song HL, Demirev AV, Kim NY, Kim DH, Yoon SY. Ouabain activates transcription factor EB and exerts neuroprotection in models of alzheimer’s disease. Mol Cell Neurosci. 2019; 95:13–24. https://doi.org/10.1016/j.mcn.2018.12.007 [PubMed]
- 44. Maneuf YP, Duty S, Hille CJ, Crossman AR, Brotchie JM. Modulation of GABA transmission by diazoxide and cromakalim in the globus pallidus: implications for the treatment of parkinson’s disease. Exp Neurol. 1996; 139:12–16. https://doi.org/10.1006/exnr.1996.0075 [PubMed]
- 45. Sood S, Gallagher IJ, Lunnon K, Rullman E, Keohane A, Crossland H, Phillips BE, Cederholm T, Jensen T, van Loon LJ, Lannfelt L, Kraus WE, Atherton PJ, et al. A novel multi-tissue RNA diagnostic of healthy ageing relates to cognitive health status. Genome Biol. 2015; 16:185. https://doi.org/10.1186/s13059-015-0750-x [PubMed]
- 46. Chahine LM, Stern MB, Chen-Plotkin A. Blood-based biomarkers for parkinson’s disease. Parkinsonism Relat Disord. 2014; 20 Suppl 1:S99–103. https://doi.org/10.1016/S1353-8020(13)70025-7 [PubMed]
- 47. Shamir R, Klein C, Amar D, Vollstedt EJ, Bonin M, Usenovic M, Wong YC, Maver A, Poths S, Safer H, Corvol JC, Lesage S, Lavi O, et al. Analysis of blood-based gene expression in idiopathic parkinson disease. Neurology. 2017; 89:1676–83. https://doi.org/10.1212/WNL.0000000000004516 [PubMed]
- 48. Borovecki F, Lovrecic L, Zhou J, Jeong H, Then F, Rosas HD, Hersch SM, Hogarth P, Bouzou B, Jensen RV, Krainc D. Genome-wide expression profiling of human blood reveals biomarkers for huntington’s disease. Proc Natl Acad Sci USA. 2005; 102:11023–28. https://doi.org/10.1073/pnas.0504921102 [PubMed]
- 49. Mastrokolias A, Ariyurek Y, Goeman JJ, van Duijn E, Roos RA, van der Mast RC, van Ommen GB, den Dunnen JT, ‘t Hoen PA, van Roon-Mom WM. Huntington’s disease biomarker progression profile identified by transcriptome sequencing in peripheral blood. Eur J Hum Genet. 2015; 23:1349–56. https://doi.org/10.1038/ejhg.2014.281 [PubMed]
- 50. Albanese S, Greco A, Auletta L, Mancini M. Mouse models of neurodegenerative disease: preclinical imaging and neurovascular component. Brain Imaging Behav. 2018; 12:1160–96. https://doi.org/10.1007/s11682-017-9770-3 [PubMed]
- 51. Esquerda-Canals G, Montoliu-Gaya L, Güell-Bosch J, Villegas S. Mouse models of alzheimer’s disease. J Alzheimers Dis. 2017; 57:1171–83. https://doi.org/10.3233/JAD-170045 [PubMed]
- 52. Rothman SM, Tanis KQ, Gandhi P, Malkov V, Marcus J, Pearson M, Stevens R, Gilliland J, Ware C, Mahadomrongkul V, O’Loughlin E, Zeballos G, Smith R, et al. Human alzheimer’s disease gene expression signatures and immune profile in APP mouse models: a discrete transcriptomic view of aβ plaque pathology. J Neuroinflammation. 2018; 15:256. https://doi.org/10.1186/s12974-018-1265-7 [PubMed]
- 53. Friedman BA, Srinivasan K, Ayalon G, Meilandt WJ, Lin H, Huntley MA, Cao Y, Lee SH, Haddick PC, Ngu H, Modrusan Z, Larson JL, Kaminker JS, et al. Diverse brain myeloid expression profiles reveal distinct microglial activation states and aspects of alzheimer’s disease not evident in mouse models. Cell Rep. 2018; 22:832–47. https://doi.org/10.1016/j.celrep.2017.12.066 [PubMed]
- 54. Oerton E, Bender A. Concordance analysis of microarray studies identifies representative gene expression changes in parkinson’s disease: a comparison of 33 human and animal studies. BMC Neurol. 2017; 17:58. https://doi.org/10.1186/s12883-017-0838-x [PubMed]
- 55. Farshim PP, Bates GP. Mouse models of huntington’s disease. Methods Mol Biol. 2018; 1780:97–120. https://doi.org/10.1007/978-1-4939-7825-0_6 [PubMed]
- 56. Li WX, Dai SX, Liu JQ, Wang Q, Li GH, Huang JF. Integrated analysis of alzheimer’s disease and schizophrenia dataset revealed different expression pattern in learning and memory. J Alzheimers Dis. 2016; 51:417–25. https://doi.org/10.3233/JAD-150807 [PubMed]
- 57. Li WX, Dai SX, Wang Q, Guo YC, Hong Y, Zheng JJ, Liu JQ, Liu D, Li GH, Huang JF. Integrated analysis of ischemic stroke datasets revealed sex and age difference in anti-stroke targets. PeerJ. 2016; 4:e2470. https://doi.org/10.7717/peerj.2470 [PubMed]
- 58. Ritchie ME, Phipson B, Wu D, Hu Y, Law CW, Shi W, Smyth GK. Limma powers differential expression analyses for RNA-sequencing and microarray studies. Nucleic Acids Res. 2015; 43:e47. https://doi.org/10.1093/nar/gkv007 [PubMed]
- 59. Greene CS, Krishnan A, Wong AK, Ricciotti E, Zelaya RA, Himmelstein DS, Zhang R, Hartmann BM, Zaslavsky E, Sealfon SC, Chasman DI, FitzGerald GA, Dolinski K, et al. Understanding multicellular function and disease with human tissue-specific networks. Nat Genet. 2015; 47:569–76. https://doi.org/10.1038/ng.3259 [PubMed]
- 60. Chicco D, Jurman G. The advantages of the matthews correlation coefficient (MCC) over F1 score and accuracy in binary classification evaluation. BMC Genomics. 2020; 21:6. https://doi.org/10.1186/s12864-019-6413-7 [PubMed]