


Introduction
Age is a major risk factor for the development of the most common musculoskeletal disease, osteoarthritis (OA). Primary OA affects more than half of the world’s population aged 65 and older. This disease is a leading cause of disability worldwide and one of the most common chronic illnesses, accounting for 40-60% of patients with degenerative diseases [1]. OA can affect many articulations, but it is commonly localized in the weight-bearing joints and most frequently occurs in the knee. This debilitating disease results in a progressive alteration of all the joint tissue structures [2]. Although aging does not necessarily cause OA, age-related changes coupled with other risk factors could accelerate the development of its pathological process [3, 4].
Currently, there is no cure for OA nor way to prevent the disease’s progression. Available treatments are effective only in relieving symptoms, and in older adults their use could induce major adverse events and even mortality [5]. An important difficulty in developing disease-modifying OA drugs (DMOADs) is identifying patients from an early stage of the disease. Further efforts are needed to move toward a better understanding of the factors and joint tissues implicated early in this disease process and to open up novel therapeutic avenues.
As the evolution of joint structural alterations in human OA occurs over an extended period, animals offer the advantage of manifesting this disease development within a shorter time than humans, enabling investigation of this disease in a timely fashion and of a more global scope. In animals, OA models have been mainly induced following surgery, with the mouse model of destabilization of the medial meniscus (DMM) of the knee being the most used one [6]. Although informative as to the response to a traumatic surgery, it does not answer several questions pertaining to the events leading to the development in primary OA.
A number of genes and factors have been implicated in the OA [7–9] and aging [10, 11] processes. Several pro-inflammatory cytokines have been found to play a role in each process; factors such as interleukin (IL)-6, tumor necrosis factor alpha (TNF-α), and C-reactive protein (CRP) are significant contributors not only in elderly individuals [12–15], but their importance is also well-documented in OA development [7, 16–19]. In addition, the production of adipokines and inflammatory factors by adipose tissues is also established [20–22]. Adipokines are molecules that regulate energy metabolism as well as the production of inflammatory factors [23–25], and the levels of certain adipokines have been found deregulated in the above-mentioned conditions [10, 26–30]. The adipokine adipsin is an emerging mediator of human OA progression [26–28]. It is mainly produced by the adipose tissue and is an integral component of the alternative complement pathway [31]. Data revealed that adipsin-deficiency delayed OA progression in a DMM-induced OA mouse model which appeared to result, at least in part, from a decreased activity of the alternative complement pathway [27]. Importantly, the aberrant activation of the alternative complement pathway has been implicated not only in OA and the aging process, but also in a number of other age-related diseases including diabetes, age-related macular degeneration, and Alzheimer’s [32–36].
We therefore hypothesize that adipsin-deficiency will prevent the spontaneous development of OA in mice.
Results
Wild-type and adipsin-deficient mouse model
As mentioned in the Methods section Histology/ Histomorphometry, about half of the wild-type (Df+/+) aging mice demonstrated severe knee lesions with a high cartilage degradation score and were named Df+/+(H); the other Df+/+mice had a lower score and were named Df+/+(L). None of the adipsin-deficient mice (Df-/-) presented a high cartilage degradation score. Further analysis with the Fisher’s exact test revealed that the phenotype of the adipsin-deficient mice was not due to chance (p=0.015).
Micro-CT (μCT) of the knee joint
As illustrated in Figure 1A, the μCT analysis of the joints of the 20-month-old mice showed that compared to the adipsin-deficient (Df-/-) and the wild-type (Df+/+) (L), the Df+/+(H) knees presented very severe OA knee alterations with a high number of osteophytes, large subchondral bone sclerosis, and a marked narrowing of the joint space in the medial compartment. By using this technology, no changes between the Df-/- and the Df+/+(L) mice could be identified.
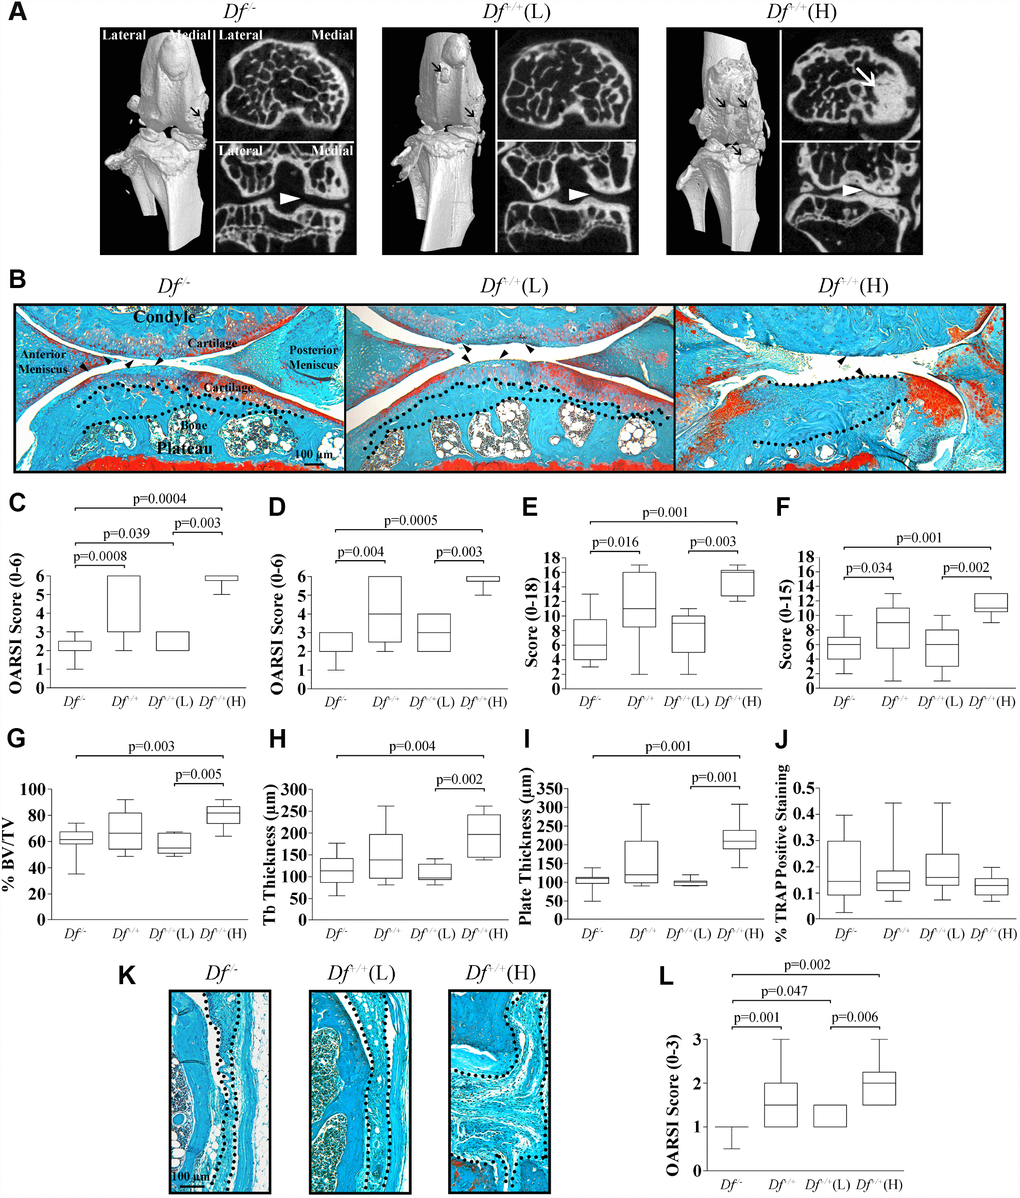
Figure 1. Micro-CT (μCT) and histology of joint tissues of 20-month-old mice. (A) Knee joint μCT of adipsin-deficient (Df-/-), and the wild-type Df+/+(L) and (H) mice. Representative 3-dimensional reconstructions of the joint and axial and coronal images of the subchondral bone compartment. Black arrows indicate osteophytes, white arrows sclerosis and the white arrowheads joint space in the medial compartment. (B) Photomicrographs of representative histological sections of joint tissues: cartilage, meniscus and subchondral bone. The dotted lines delineate subchondral plate thickness and the black arrowheads cartilage alterations. Bar = 100 μm. Original magnification X63. (C–J) Representative box plots of the Osteoarthritis Research Society International (OARSI) score of the (C) medial tibial plateau, and (D) medial femoral condyle; the (E) anterior and (F) posterior menisci; the subchondral bone assessment of the (G) percentage of bone (% bone volume [BV]/total volume [TV]), (H) trabecular (tb) thickness, (I) plate thickness, and (J) tartrate resistant acid phosphatase (TRAP) assay. (K) Photomicrographs of representative histological sections of the synovial membrane and (L) box plot of the OARSI score of the synovial membrane. In (K) the dotted lines delineate synovial membrane thickness. Bar = 100 μm. Original magnification X100. For each box plot, values are the median and interquartile range of Df-/- (n=13), Df+/+ (n=13), Df+/+(L) (n=7) and Df+/+(H) (n=6). p values were determined by the Mann-Whitney test and only significant values are shown.
Adipsin-deficient mice are protected from spontaneous OA progression
The impact of the lack of adipsin production on the evolution of spontaneous OA occurring in aging mice was evaluated. Figure 1B–1L compares the joint tissues of the 20-month-old Df-/- with those from Df+/+, Df+/+(L) and (H) mice. Tissues from the 20-week-old mice are not presented, as the comparison of the articular tissues (cartilage, subchondral bone, and synovial membrane) between Df-/- and Df+/+ mice has already been reported, showing no histological differences nor early signs of OA process in these tissues [27].
Cartilage
Figure 1B illustrates cartilage degradation in both medial tibial plateau and femoral condyle of the 20-month-old in which the Df+/+ mice demonstrated a higher loss of cartilage integrity, and a high Osteoarthritis Research Society International (OARSI) score [37], including decreased Safranin-O staining, altered cellularity, increased thinning of the cartilage and fibrillation. The more severe degradation occurred in the cartilage of the Df+/+(H) mice (both for the femoral condyle and tibial plateau), as this tissue was almost completely eroded. Compared to the Df+/+(H) mice, the cartilage from Df+/+(L) and Df-/- had a better cartilage structure and less degradation. The histological score of the Df-/- mice was significantly lower compared to those of Df+/+, Df+/+(L) and (H) mice for the medial tibial plateau (Figure 1C) and to those of Df+/+ and Df+/+(H) for the femoral condyle (Figure 1D). Moreover, significant differences were also seen between Df+/+(L) and Df+/+(H) for both compartments.
Meniscus
The histological examination of the Df-/- meniscus revealed a significantly lower level of degradation of both the anterior and posterior compartments compared to those of the Df+/+ and Df+/+(H) mice (Figure 1B, 1E, and 1F). No differences in the histological scores were observed between the Df-/- and Df+/+(L) groups, but significance was reached between the Df+/+(L) and Df+/+(H) groups for each compartment (Figure 1E, 1F). The Df+/+(H) meniscus (Figure 1B) presented a high score, in which altered cellularity, decreased matrix Safranin-O staining and increased fibrillation in both the anterior and posterior compartments were found.
Subchondral bone
The analysis of the subchondral bone (Figure 1B, 1G–1I) showed that the adipsin-deficient (Df-/-) mice had a significant decrease in the percentage of bone, trabecular and plate thickness when compared to the Df+/+(H) mice, but no significant differences were found with the Df+/+(L) subgroup. As for the cartilage and meniscus, significantly higher values were obtained for the Df+/+(H) mice when compared to Df+/+(L) mice.
The tartrate resistant acid phosphatase (TRAP) assay was performed to monitor osteoclast activation in the subchondral bone. Data showed that only a few TRAP-positive cells were detected in the subchondral bone around the bone marrow. As illustrated at Figure 1J, there was no difference in the TRAP positive staining between groups. One could question the finding for the Df+/+ (H) mice, however, this data was not surprising since in these mice there were important sclerosis (Figure 1BDf+/+ (H)) and only few bone marrow remained in which few TRAP-positive cells could be detected.
Synovial membrane
The Df-/- synovial membrane presented a significantly reduced score when compared to those of the Df+/+, Df+/+(L) and (H) subgroups (Figure 1K–1L). Again, Df+/+(H) mice demonstrated a significantly higher level of alterations than the Df+/+(L) mice. Of note, there is a substantial increase in the synovial membrane thickness and hyperplasia of the lining cells in the Df+/+(H) mice (Figure 1K).
Anterior cruciate ligament (ACL)
In the ACL, the earliest changes during the aging process and preceding radiological signs of OA are mucoid degeneration (degradation of collagen and deposition of new glycosaminoglycans), collagen fiber disorganization, and the presence of chondrocyte-like cells and type II collagen deposition [38–41]. We evaluated these parameters in the ACL from 20 week- and 20 month-old Df-/- and Df+/+ mice (Figure 2).
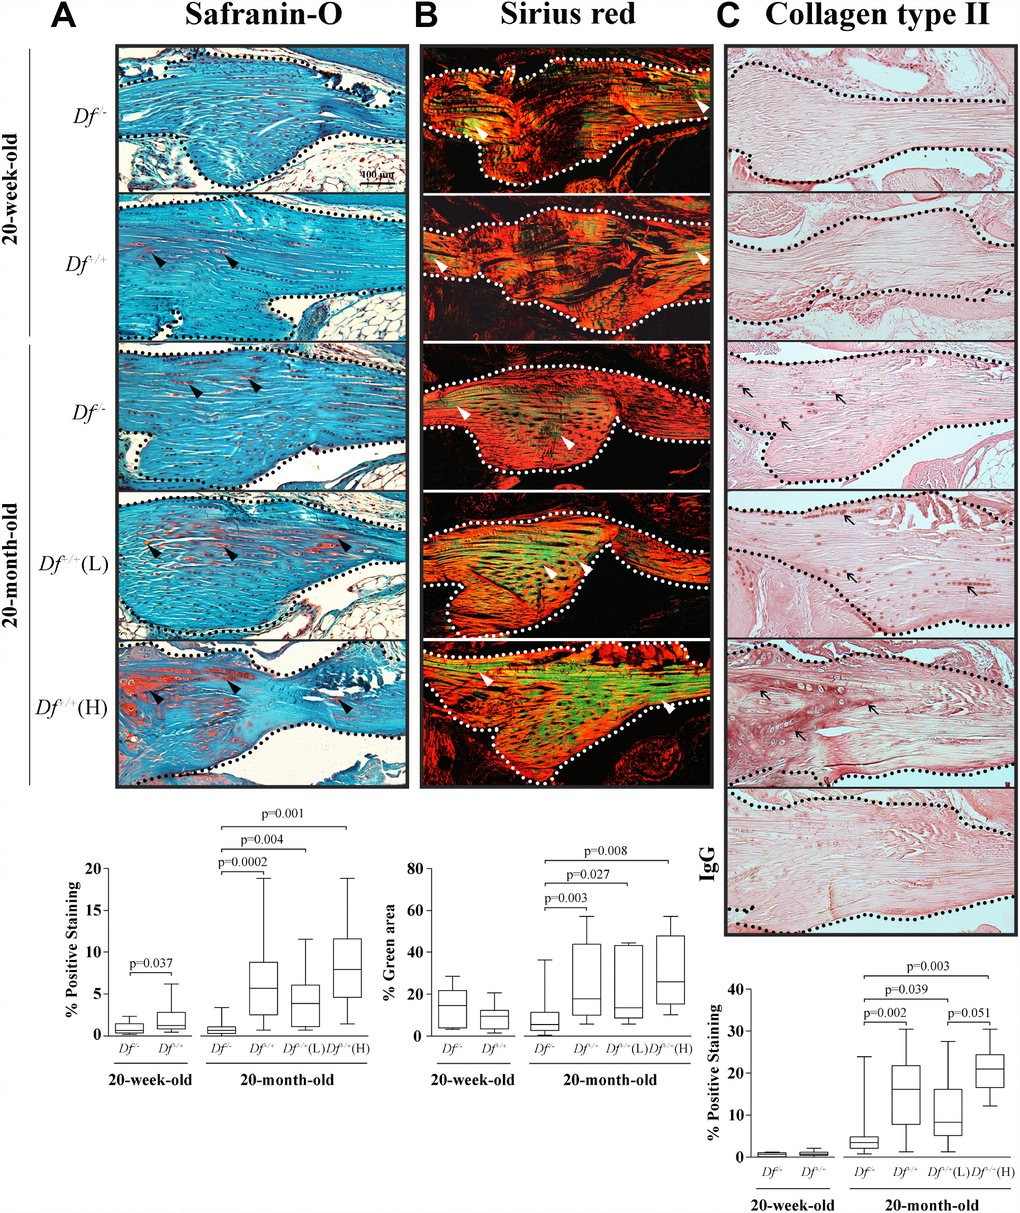
Figure 2. Histology and type II collagen deposition in the anterior cruciate ligament (ACL). Photomicrographs of representative images and box plots of 20-week-old adipsin-deficient (Df-/-) and wild-type (Df+/+) and 20-month-old Df-/-, Df+/+, Df+/+(L) and (H) mice of (A) Safranin-O staining, black arrowheads indicate proteoglycans deposition; (B) Sirius red staining enabling visualization of the collagen fibers. The green fibers corresponding to altered collagen were quantified over the total area. White arrowheads indicate thin collagen fibers. (C) Immunohistochemistry of type II collagen deposition and a negative control (IgG) performed by substitution with a non-specific rabbit IgG. Black arrows indicate positive staining. In (A–C) dotted lines delineate the core portion of the ACL. Bar in (A) = 100 μm. Original magnification X100. Values are the median and interquartile range of Df-/- (n=11), Df+/+ (n=13) for the 20-week-old mice and of Df-/- (n=13), Df+/+ (n=13), Df+/+ (L) (n=7) and (H) (n=6) for the 20-month-old mice. p values were determined by the Mann-Whitney test. Only significant differences are shown except for those comparing 20-week-old and 20-month-old Df-/- (C, p= 0.0001) and Df+/+ (A, p= 0.006; B, p=0.004; C, p< 0.0001) mice.
Data showed that in young animals, Safranin-O staining level was significantly lower in Df-/- compared to Df+/+ mice (Figure 2A), suggesting that early alteration occurs in the ACL at a young age, at 20-weeks-old. Moreover, data also revealed that adipsin-deficiency protected from such an alteration, as comparison between the younger and older mice revealed that the Safranin-O staining level remained stable in the Df-/- animals. In the 20-month-old mice, a significantly higher level of Safranin-O staining was found in Df+/+mice compared to Df-/- mice, with the level about tripled. In these mice, significantly higher levels were also found for both Df+/+(L) and (H) subgroups than in Df-/-.
Collagen organisation data (sirius staining, green color indicating collagen fibers alterations) (Figure 2B) also showed that older adipsin-deficient mice were protected against this collagen alteration. In contrast, in the 20-month-old mice, as observed with Safranin-O, the level of staining for the Df+/+mice about doubled when compared to Df-/- mice; this was also true for both Df+/+(L) and (H) mice. No differences in the adipsin-deficient Df-/- mice were found between 20-week- and 20-month-old mice.
Determination of type II collagen deposition (Figure 2C) revealed that this collagen type was virtually absent in the 20-week-old Df-/- and Df+/+mice and increased in the 20-month-old. As with the two other ACL measurements, in the older mice, the adipsin-deficient mice had significantly less type II collagen than Df+/+ and both Df+/+(L) and (H) subgroups. Of note, there was also a statistically significant higher level of type II collagen in the Df+/+(H) mice compared to the Df+/+(L).
Altogether, data on the ACL indicates that changes occur in this tissue as early as 20-weeks-old and progress with age.
Impact of adipsin-deficiency on the serum levels of some adipokines/inflammatory factors/proteinase
Considering that the previous results demonstrated that adipsin-deficiency significantly reduced the spontaneous manifestation of OA in several articular tissues, we further evaluated if this was reflected by a change in the serum levels of factors related to both OA and aging. Among the studied factors, the serum levels of granulocyte-macrophage colony-stimulating factor (GM-CSF), vascular endothelial growth factor (VEGF), S100 calcium-binding protein A8 (S100A8), receptor for advanced-glycation-end-products (RAGE), interleukin (IL)-7, IL-10, IL-17 and TNF-α could not be determined accurately, as values were under the detection limit of the assays. Serum levels of hepatocyte growth factor (HGF), monocyte chemoattractant protein (MCP)-1, matrix metalloproteinase (MMP)-8 and S100 calcium-binding protein A9 (S100A9) were detectable, but no significant differences were reached between Df-/- and Df+/+ mice in either the 20-week- or the 20-month-old animals (data not shown).
As presented in Table 1, for the adipokines, significantly higher serum levels were found in the Df-/- than Df+/+ mice for adiponectin and fibroblast growth factor (FGF)-21 in both young and old mice. Leptin had a reverse pattern; when the Df-/- was compared to the Df+/+ mice, its levels were decreased in the young mice, but increased in the older ones. Resistin levels were significantly higher in the young Df-/- mice but did not vary in the older mice. Interestingly, for the 20-month-old mice, difference between the Df-/- with Df+/+(L) and (H) mice subgroups revealed that although adiponectin and leptin levels were significantly higher compared to the Df+/+(L) group, no significant difference was found for the (H) group. For FGF-21, Df-/- had significantly higher levels than both Df+/+(L) and (H) mice subgroups.
Table 1. Serum levels of adipokines/inflammatory factors/proteinase.
| 20-week-old mice | 20-month-old mice | Age comparison | |||||||||||||||||||||||||||||||||||||||||||||||||||||||||||||||||||||||||||||||||||||||||||||||||
| Df-/- (n=11) | Df+/+ p‡ (n=13) | Df-/- (n=9) | Df+/+ p‡ (n=11) | Df+/+(L) p† (n=7) | Df+/+(H) p†† (n=4) | (Df-/-) p* | (Df+/+) p** | ||||||||||||||||||||||||||||||||||||||||||||||||||||||||||||||||||||||||||||||||||||||||||||
| Adiponectin (ng/ml) | 5088 (4788; 5615) | 4632 (4397; 4854) 0.030 | 4942 (4601; 5369) | 4166 (3562; 4410) 0.005 | 3787 (3562; 4206) 0.008 | 4410 (3822; 4588) 0.076 | 0.323 | 0.132 | |||||||||||||||||||||||||||||||||||||||||||||||||||||||||||||||||||||||||||||||||||||||||||
| FGF-21 (pg/ml) | 432.1 (359.5; 586.8) | 307.8 (142.0; 430.8) 0.032 | 1688.1 (901.9; 1697.4) | 398.4 (219.5; 823.9) 0.002 | 314.0 (195.4; 630.7) 0.004 | 614.9 (388.4; 951.8) 0.037 | 0.0005 | 0.203 | |||||||||||||||||||||||||||||||||||||||||||||||||||||||||||||||||||||||||||||||||||||||||||
| Leptin (ng/ml) | 0.7 (0.3; 1.3) | 1.5 (1.2; 3.2) 0.021 | 6.5 (3.5; 7.1) | 1.6 (0.4; 3.8) 0.019 | 0.7 (0.1; 3.2) 0.034 | 2.3 (1.6; 4.0) 0.105 | 0.0005 | 0.728 | |||||||||||||||||||||||||||||||||||||||||||||||||||||||||||||||||||||||||||||||||||||||||||
| Resistin (ng/ml) | 36.4 (34.7; 38.4) | 27.1 (25.2; 29.0) 0.0004 | 20.0 (18.5; 22.8) | 19.0 (17.8; 22.1) 0.517 | 21.9 (18.7; 22.6) 1.000 | 17.8 (15.4; 18.6) 0.163 | 0.0002 | 0.002 | |||||||||||||||||||||||||||||||||||||||||||||||||||||||||||||||||||||||||||||||||||||||||||
| CRP (μg/ml) | 23.9 (20.6; 26.6) | 21.5 (18.3; 22.7) 0.105 | 30.8 (29.1; 32.6) n=8 | 30.7 (24.6; 33.0) 0.704 | 32.6 (24.9; 34.0) 0.916 | 29.8 (23.3; 30.9) 0.316 | 0.001 | 0.026 | |||||||||||||||||||||||||||||||||||||||||||||||||||||||||||||||||||||||||||||||||||||||||||
| IL-6 (pg/ml) | 1.9 (0.0; 1.9) | 1.9 (1.9; 3.6) 0.057 | 3.6 (1.9; 5.2) | 8.4 (3.6; 20.4) 0.122 | 16.0 (6.0; 24.8) 0.041 | 3.6 (2.7; 5.6) 0.931 | 0.018 | 0.023 | |||||||||||||||||||||||||||||||||||||||||||||||||||||||||||||||||||||||||||||||||||||||||||
| MMP-3 (ng/ml) | 64.9 (54.6; 86.9) | 73.9 (61.4; 91.9) 0.417 | 52.2 (38.0; 56.6) | 52.9 (43.1; 64.6) 0.403 | 57.6 (46.9; 79.3) 0.299 | 47.6 (41.2; 52.9) 0.940 | 0.044 | 0.018 | |||||||||||||||||||||||||||||||||||||||||||||||||||||||||||||||||||||||||||||||||||||||||||
| Serum samples were from adipsin-deficient (Df-/-) and wild type (Df+/+) 20-week- and 20-month-old mice. Df+/+(L) refers to 20-month-old Df+/+ mice with a low Osteoarthritis Research Society International (OARSI) score (score, 2-4) while Df+/+(H) refers to those with a high OARSI score (score, 5-6). Data are expressed as the median (interquartile range). Differences between groups were assessed by the Mann-Whitney test. P values ≤0.050 were considered significant and are shown in bold. p‡ compares Df-/- and Df+/+mice; p†: 20-month-old Df-/- and Df+/+(L) mice; p††: 20-month-old Df-/- and Df+/+(H) mice; p*: 20-week- and 20-month-old Df-/- mice and p**: 20-week- and 20-month-old Df+/+mice. No statistical differences were found between Df+/+(L) and (H) mice. | |||||||||||||||||||||||||||||||||||||||||||||||||||||||||||||||||||||||||||||||||||||||||||||||||||
Among the two inflammatory factors, only IL-6 showed a trend toward lower levels in the Df-/- mice at both time points. No significant change was observed for levels of CRP and the matrix metalloproteinase (MMP)-3, when comparing Df-/- with Df+/+ young and old mice. In the 20-month-old animals, comparison between Df-/- and Df+/+(L) subgroup in the mice revealed similar changes, except for IL-6 where a significantly lower value was found.
Age-associated changes showed that the adiponectin level did not change, but in the older mice, levels of FGF-21 and leptin significantly increased in the Df-/- mice, while resistin decreased in both Df-/- and Df+/+ mice. The levels of the inflammatory factors CRP and IL-6 increased significantly with aging in both Df-/- and Df+/+ mice, while those of the MMP-3 decreased significantly in the aging mice.
Effect of in-vitro adipsin-silencing on adipokine expression
As Table 1 demonstrated that the in vivo silencing of adipsin in mice resulted in increased serum levels of FGF-21 and adiponectin in both young and aged mice, we further examined whether the lack of adipsin directly impacted FGF-21 expression in vitro. To that effect, siRNAs specific for the adipsin gene were transfected into the human hepatocyte cell line HepG2, as these cells are known to express both adipsin and FGF-21. Data revealed that silencing the adipsin gene expression with specific siRNAs (n=5) decreased adipsin expression (fold change±standard deviation, 0.77±0.07, p<0.0001) and this decrease resulted in a significant increase in expression of FGF-21 (3.85±2.95, p=0.043) after 24 hours. Adiponectin expression was also increased but did not reach statistical significance (11.77±13.99, p=0.133). Adipsin-silencing did not quite significantly affect the expression of another adipokine, leptin (1.62±1.39, p=0.060).
Discussion
Our study revealed that in spontaneous OA, the earliest sign of articular alteration appears to originate in the ACL and the lack of adipsin protects against the spontaneous development of OA. Data further showed that an increased production of the adipokines FGF-21 and adiponectin, and a decrease of the inflammatory factor IL-6 are possible mechanisms by which this protection could occur.
The data showing that adipsin plays an important role in articular tissues in OA are further reinforced by those from a recent publication in which adipsin-deficiency in an immunologically-induced inflammatory arthritis mouse model also demonstrates a protective role in articular tissues [42].
OA is now regarded globally as a whole joint disease, and our histological data of the wild-type mice (Df+/+) concur with this premise. Indeed, human primary OA is characterized by the degradation of cartilage and meniscus and alterations of the synovial membrane and subchondral bone [43, 44]. In this study, an important finding is that the ACL appears to be the earliest articular tissue to show signs of alterations during spontaneous age-related OA. This agrees with the notion that changes in the knee ligaments, and more particularly in the ACL, may precede cartilage degradation by inducing instability, consequently leading to articular tissue lesions and degeneration as observed in humans [38] and animals [39–41], and a recent publication reporting that an early ligamentous degeneration preceded the onset of human OA [45]. This finding also supports the use of the transection of the ACL as a preferred model to mimic the human disease. Indeed, in large animals (e.g. dogs), such a model was demonstrated to induce the disease with alterations strikingly similar to those of the natural disease in humans [46]. Moreover, the results obtained with two drugs/agents tested in the dog ACL model of OA (licofelone [47–49] and doxycycline [50]) were translated to human in clinical trials [51, 52].
The finding that adipsin-deficiency resulted in a significant increase of the serum levels of FGF-21 and adiponectin is interesting as both adipokines were reported to have metabolic/anti-inflammatory effects and suggested to be instrumental in maintaining joint health [53–57].
FGF-21 is an adipokine/endocrine hormone produced by the liver, adipose tissue and blood cells [58, 59], and is reported to be anti-inflammatory and to demonstrate anti-aging properties [60, 61]. Importantly and related to arthritis, FGF-21 was found to attenuate the collagen-induced arthritis by reducing, among other things, some pro-inflammatory cytokines [55]. The exact mechanisms behind more elevated levels of FGF-21 in adipsin-deficient (Df-/-) than in the wild-type (Df-+/+) mice remains to be determined, but data from the siRNA experiment suggest a direct event. Hence, the silencing of the adipsin gene expression resulted in a significantly increased expression of FGF-21. As human cells were used for this experiment, data also indicates that the relationship between adipsin and FGF-21/adiponectin is not specific to mouse cells, but could also be applied to human cells. Although a relationship between the expression of adipsin and FGF-21 has been reported [62], the regulatory factors at play still remain to be determined. FGF-21 is known to be regulated by a number of metabolic factors, nutrients, and oxidative stress [58, 63, 64], and involved in the regulation of glucose and lipid metabolism [65–68]. This could suggest that the lack of adipsin impacted these metabolic factors. However, this is to no avail, since, as previously reported, the serum levels of triglycerydes, cholesterol and free fatty acids in adipsin-deficient mice were similar to those of the wild-type [69].
Adiponectin could be found in the circulation in three forms, and depending on its form, could have pro- or anti-inflammatory properties [24, 70, 71]. As for FGF-21, this adipokine in the serum was found to be significantly elevated in the adipsin-deficient (Df--/-) compared to the wild-type (Df-+/+) mice. As FGF-21 was reported to be a regulator of adiponectin expression/production [66, 72], such an up-regulation could reflect that FGF-21 could be the trigger. Moreover, the beneficial effect of FGF-21 in the protection of the articulation against OA development/progression in the adipsin-deficient mice could also be due to the fact that FGF-21 inhibits IL-6 [55]; an inflammatory factor that, although it did not quite reach statistical significance, showed a trend toward a lower serum level in the Df-/- than the Df+/+ mice in young mice, and was statistically different when compared to Df+/+(L) mice. In turn, the lower IL-6 serum levels in the adipsin-deficient mice could also result from the lack of the activation of the alternative complement, as adipsin is an important element of this pathway [73, 74].
Surprisingly, although in the younger mice the serum leptin level was significantly lower in adipsin-deficient animals, in the older mice, a higher leptin serum level was found. Although leptin was reported to be associated with cartilage degradation [23, 75–78], this still remains controversial since other works did not find such an association [26, 79, 80]. Although speculative, it is possible that in the Df-/- mice, the putative catabolic effect due to the increased leptin levels could be rendered non-relevant compared to the beneficial effect of FGF-21, adiponectin, and the decreased level of IL-6. The factors responsible for the increased levels of leptin in the Df-/- older mice are yet to be identified, but it could be hypothesized that the lack of adipsin could have generated a disturbance in the energy metabolism, triggering leptin expression.
Resistin is an adipokine reported to be involved in insulin resistance and inflammation [25, 81]. Increased synovial fluid resistin levels have been detected in OA patients [82]; however, by using a mouse model, such a resistin increase was found to immediately follow traumatic knee injury and decline later on, supporting its role in the early stages of trauma-induced OA [83]. This agrees with the lower serum levels found in our study in the old mice in both adipsin-deficient and wild-type mice.
Our data showed no significant difference in the MMP-3 serum levels between the wild-type and adipsin-deficient mice, but did show a decrease with aging in both groups. This was surprising, as MMP-3 expression has been found to be increased in individuals with OA lesions [84, 85]. However, literature about MMP-3 serum levels in relation to age is scarce, and in the few existing reports, conclusions are contradictory depending on whether they are from a human or mouse. Thus, in humans, MMP-3 serum levels increase with age [86, 87], whereas their expression and production in mice in the intervertebral disk showed age-related decreases [88], the latter concurring with our data.
Although possible explanations are stated above as to how adipsin could impact the articular tissues and some serum factors, further research needs to be done to identify the exact mechanism of action on each articular tissue, as well as to define the intimate molecular relationship of its effect on some serum factors.
Another important observation underlined in this study is the occurrence of very severe articular tissue degradation in about half of the wild-type (Df+/+) animals. Although such a severe event has been reported [89, 90], the exact reason for it remains to be determined. Notably, none of the adipsin-deficient mice displayed such extensive degradation, which strongly supports the lack of adipsin as protecting the articular tissues. Moreover, the analysis of the serum levels has yielded another valuable insight. Indeed, although μCT and histological/ immunohistological analyses demonstrated differences between the Df+/+(L) with (H) subgroups, no significant differences were found in the serum levels of the factors studied between these two subgroups. Thus, the severity of the age-related knee joint lesions seen at the local level in the Df+/+(H) mice is not reflected at a systemic level. These very severe articular tissue alterations in the Df+/+(H) mice, in addition to the fact that the Df+/+(L) mice demonstrated significant histological/ immunohistological differences when compared to the Df-/- mice, strongly suggests that metabolic factors play a more significant role at the early (or less advanced) stages of the disease and that their serum levels would reach a plateau later on as OA progresses and mechanical alterations develop, superseding the metabolic factors [91]. In the μCt and subchondral bone, the fact that no differences were observed between the Df-/- and Df+/+(L) mice but were found with Df+/+(H) also suggests that the bone/subchondral bone tissue is affected later in the spontaneous OA process.
In conclusion, although surgically-induced OA models develop articular alterations rapidly and reproducibly, such models are posttraumatic. In naturally occurring OA, various etiological factors join forces to bring about the structural and molecular changes. The mouse spontaneous development of OA is translational and better mimics human primary OA. By using this mouse model, data demonstrated that the earliest OA tissue manifestation occurs in the ACL. Moreover, the spontaneous OA development in the mice used in this study confirms the role of the adipokine, adipsin, as a player in OA progression. This work also identified the beneficial effect of another adipokine, FGF-21, against OA development/progression. Therefore, in addition to reaffirming the value of the adipsin as a potential biomarker for OA and target in therapeutic strategies, this study reveals the potential beneficial effect of FGF-21 against OA, and provides support for this factor as a new avenue for therapeutic approaches in primary OA.
Materials and Methods
Adipsin-deficient mouse model
Homozygous adipsin-deficient (Df-/-) and wild type (Df+/+) mice were generated by interbreeding Df+/+ and homozygous Df-/-mice offspring from founder mating Df+/- pairs kindly donated by the Dana Farber Cancer Institute (Boston, MA, USA) [69] as previously described [27]. The mice were maintained in accordance with the Canadian Council on Animal Care; the protocol was reviewed and approved by the Institutional Animal Care Committee of the University of Montreal Hospital Research Center. All mice were housed individually and were kept in a 12-hour light/dark cycle; food and water were available ad libitum. As described previously [27, 69, 92], the mutant mice have no apparent abnormality in their development and body weight compared to the wild type mice. Genotyping was carried out by polymerase chain reaction (PCR) with genomic DNA extracted from ear punch biopsy samples as described previously [27]. The mice were received and bred for this study over a 3-year period (about 4-7 generations) which rule out a potential genetic drift independent of adipsin deficiency. Mice of 20-week-old (Df-/- n=11, Df+/+ n=13) and 20-month-old (Df-/- n=13, Df+/+ n=13) were sacrificed by pentobarbital sodium. The right knee joints were dissected free of tissue and serum were taken.
Histology/Histomorphometry
Articular samples were fixed in 4% paraformaldehyde, pH 7.4 for 16 hours at 4°C (Sigma-Aldrich, Oakville, ON, Canada), decalcified in 10% ethylenediaminetetraacetic acid (EDTA) pH 7.3 for 12 days (Wisent, St-Bruno, QC, Canada) and embedded in paraffin as described [27]. Sections (5 μm) were deparaffinised in xylene followed by a graded series of alcohol washes prior to staining and were stained with Safranin O-fast green (Sigma-Aldrich) as previously described [27].
The cartilage and synovial membrane alterations were determined according to the OARSI scoring method [37]. Of note, about half of the aging Df+/+ mice (n=6; 46%) had severe knee lesions with a high OARSI cartilage score (score, 5-6) and were subsequently named Df+/+(H); the other Df+/+mice with a lower OARSI score (score, 2-4) (n=7; 54%) were named Df+/+(L).
The subchondral bone histomorphometry was done on the medial compartment as described [93], using a Leitz Diaplan microscope linked to a personal computer to examine three non-consecutive sections. Measurements were recorded for the subchondral bone percentage of bone volume to the total volume (% BV/TV), trabecular thickness (μm) and plate thickness (μm). To this end, a box with a fixed width (1,000 μm) and variable length was created, with the upper limit at the calcified cartilage-subchondral bone junction and the lower limit at the subchondral bone-trabecular bone junction. The mean distance between the upper and lower limit and the trabecular thickness were calculated automatically by the BIOQUANT OSTEO software (Nashville, TN, USA).
The tartrate resistant acid phosphatase (TRAP) assay was performed to monitor osteoclast activation in the subchondral bone. TRAP detection was done on histological sections embedded in paraffin. Sections were first deparaffinized, then stained for enzyme activity, and processed as described previously [94]; counterstaining was done with 0.05% Fast Green (Sigma-Aldrich). TRAP-positive staining in the subchondral bone were quantitated with the BIOQUANT OSTEO software and data expressed as % of TRAP positive area over the total area.
The histopathological grading of the anterior and posterior horns of the menisci was done using the Kwok et al. scoring method [90], which takes into consideration the evaluation of the surface integrity, cellularity, Safranin-O staining distribution and intensity; with a maximum grading score of 18 (anterior horn) and 15 (posterior horn).
Assessment of anterior cruciate ligament (ACL) integrity was performed on 5 μm sagittal sections that contained the whole ligament length, excluding the attachment sides at both ends. The presence of proteoglycans was detected by staining the sections with Safranin-O [95]. Images were taken at 100X and the red staining (representing the proteoglycans) in the core portion of the ligament was quantified with the BIOQUANT OSTEO software and data expressed as % proteoglycans (red stained) area over total area.
The collagen organization in the ACL was evaluated on 5 μm paraffin sections following sirius red staining as described [96]. In brief, each slice was stained with a 0.1% sirius red solution and images at 100X were taken under polarized light. The dark background of the image was removed for further image processing with Adobe Photoshop software. The red (fibers structural component) and the green (altered fibers) areas were quantified separately with the BIOQUANT OSTEO software and data expressed as % of altered fibrils (green staining) area over the total area.
Immunohistochemistry
Immunochemical analysis of the ACL was performed on 5 μm paraffin sections as described [27]. The tissues were successively incubated for 1 hour at 37°C with 1 mg/ml collagenase type I (USB, Cleveland, OH, USA) pH 7.4 in presence of 0.1% CaCl2, 1% hyaluronidase pH 6.0 in phosphate-buffered saline (PBS) and 1 mg/ml pepsin (all from Sigma-Aldrich) in 0.5M acetic acid. The tissues were then treated with 2% H2O2 (Fisher, Fair Lawn, NJ, USA) in PBS and with 1.5% goat serum (Vector Laboratories, Burlingame, CA, USA) in PBS for 15 and 45 minutes at room temperature, respectively. The primary antibody was an anti-human rabbit polyclonal antibody raised against type II collagen (dilution 1:200, Abcam, Cambridge, UK). Slides were incubated with Vectastain ABC kit (Vector Laboratories) according to the manufacturer’s specifications. The color was developed with 3,3′-diaminobenzidine containing hydrogen peroxide and nickel, and the slides were counterstained with eosin. Control procedures were performed according to the same experimental protocol as follows: (i) omission of the primary antibody, and (ii) substitution of the primary antibody with a non-specific immunoglobulin G (IgG) from the same host (rabbit) as the primary antibody (Santa Cruz Biotechnology, Dallas, TX, USA). Controls showed only background staining. Images were captured at 100X with a Leitz Diaplan microscope connected to the BIOQUANT OSTEO software. Surface area of the positive type II collagen ACL matrix staining was measured and data expressed as % of positive stained area over total area.
Micro-computed tomography (μCT)
The μCT analysis was performed as described [97] on knee joints from 20-month-old Df-/-, Df+/+ (L) and Df+/+ (H) mice. Briefly, the knee joints were scanned using a Skyscan 1176 micro-CT scanner at 50KV and 500 μA, with a pixel size of 9 μm and a 0.5-mm aluminium filter. Data were recorded at every 3-degree rotation step through 180°. Image slices were reconstructed using NRecon software (version 1.6.3.2, Skyscan, Micro Photonics Inc., Allentown, PA, USA).
Serum levels of adipokines/inflammatory factors/proteinases
Blood samples were obtained from 20-week-old and 20-month-old mice. The samples were allowed to coagulate and then centrifuged (4,000 rpm/1,400g, 10 minutes). The samples were stored at -80°C until analyzed. The levels of factors (adipokines, inflammatory factors, growth factors, MMPs) known to have a role in both aging and OA, whether beneficial or detrimental, were determined with specific assays (Luminex assay, R&D systems, Minneapolis, MN, USA) according to the manufacturer’s specifications, and quantitated using the Bio-Plex 200 apparatus (Bio-Rad, Mississauga, ON, Canada). An 8-point standard curve was used for each marker. Data were analyzed with the Bio-Plex Manager software (Bio-Rad).
The factors tested, as well as the minimum detectable doses and dilutions used were: adiponectin, 7.55 pg/ml (dilution 1:2000); CRP, 13.3 pg/ml (1:2000); FGF-21, 0.9 pg/ml (1:2); GM-CSF, 1.64 pg/ml (1:2); HGF, 3.33 pg/ml (1:2); IL-6, 2.3 pg/ml (1:2); IL-7, 35.4 pg/ml (1:2); IL-10, 8.2 pg/ml (1:2); IL-17, 7.08 pg/ml (1/2); leptin, 12.6 pg/ml (1:2); MCP-1, 134 pg/ml (1/2); MMP-3, 0.332 pg/ml (1/200); MMP-8, 2109 pg/ml (1:2); RAGE, 18.0 pg/ml (1:2); resistin 0.74 pg/ml (1:2000); S100A8, 61.3 pg/ml (1:2); S100A9, 3.55 pg/ml (1:2); TNF-α, 1.47 pg/ml (1:2); and VEGF, 3.96 pg/ml (1:2).
Cell cultures
The human hepatocarcinoma cell line HepG2 was purchased from American Type Culture Collection (Manassas, VA, USA). The cells were routinely grown in low-glucose Dulbecco’s modified Eagle medium (DMEM) (Gibco, Thermo Fisher Technology, Waltham, MA, USA) supplemented with 10% heat-inactivated fetal calf serum (PAA Laboratories Inc, Etobicoke, ON, Canada) and an antibiotic mixture (100 units/ml penicillin base and 100 μg/ml streptomycin base; Wisent Inc, St-Bruno QC, Canada) at 37°C in a humidified atmosphere.
Gene silencing
Gene silencing was basically done as described previously [98]. Briefly, a siRNA pool specific for the human adipsin gene was purchased from Thermo Fisher Technology. The siRNAs (final concentration 100 nM) were transfected for 24 hours with the Lipofectamine RNAiMax reagent (final concentration 0.2%, Thermo Fisher Technology) into HepG2 (200,000 cells/well, in 12-wells plates). Cells transfected with random non-targeting siRNAs (Ambion, Thermo Fisher Technology, Austin, TX, USA) served as controls.
RNA extraction and real-time PCR
Total RNA from the transfected cells was extracted, quantified and reverse-transcribed as previously described [27]. Real-time PCR was done using the SYBR Green Master Mix (Qiagen, Valencia, CA, USA) [99].
The primers used in the PCR assays were 5-GCCT TGAAGCCGGGAGTTATT (S) and 5-GTGGAGCGA TCCATACAGGG (AS) (FGF-21); 5-TATGATGGCTC CACTGGTA (S) and 5- GAGCATAGCCTTGTCCT TCT (AS) (adiponectin); 5- CCTGCATCTGGTTGGTC TTT (S) and 5- CCTGCGTTCAAGTCATCCTC (AS) (adipsin); 5′- TCCCCTCTTGACCCATCTC(S) and 5′-GGGAACCTTGTTCTGGTCAT(AS) (leptin); 5- GG CAGCATCTACAACCCTGA (S) and 5- CCAGGA CTCGTTTGTACCCG (AS) (RPLPO, housekeeping gene).
The effect of siRNAs specific for adipsin on the expression of adipsin, FGF-21, adiponectin and leptin in the transfected HepG2 cells was calculated as fold change over the siRNA (random) controls which were assigned an arbitrary value of 1 and calculated as 2-ΔΔCt. Statistical analysis was done using the one-sample t-test, comparing the siRNA adipsin values (n=5 for each cell type) to the control random siRNAs values.
Statistical analysis
Values are expressed as median (interquartile range) unless indicated. Statistical analyses were performed with the Fisher’s exact test or the Mann-Whitney U test (GraphPad Prism software, GraphPad, San Diego, CA, USA) where appropriate; a p≤0.050 was considered significant.
Author Contributions
All the authors contributed to the conception and design of the study. FP, GT, YO, HF and JMP were responsible for the data collection and analysis. FP, GT, JMP and JPP were involved in the drafting and all authors were involved in the critical revision and final approval of the manuscript.
Acknowledgments
The authors thank the Dana Farber Cancer Institute for providing the adipsin-deficient mice and are grateful to Bertrand Lussier D.M.V. for his expertise and collaboration on the evaluation of the pathological lesions of the ligaments. We also thank Jacqueline Brunet for her assistance with the manuscript preparation.
Conflicts of Interest
The authors have declared no conflicts of interest for this study.
Funding
This study was funded in part by the Osteoarthritis Research Unit of the University of Montreal Hospital Research Center (CRCHUM) and the Chair in Osteoarthritis of the University of Montreal.
References
- 1. Arden N, Cooper C. Osteoarthritis: Epidemiology. Best Pract Res Clin Rheumatol. 2006; 20:3–25. https://doi.org/10.1016/j.berh.2005.09.007 [PubMed]
- 2. Martel-Pelletier J, Barr AJ, Cicuttini FM, Conaghan PG, Cooper C, Goldring MB, Goldring SR, Jones G, Teichtahl AJ, Pelletier JP. Osteoarthritis. Nat Rev Dis Primers. 2016; 2:16072. https://doi.org/10.1038/nrdp.2016.72 [PubMed]
- 3. Lotz M, Loeser RF. Effects of aging on articular cartilage homeostasis. Bone. 2012; 51:241–48. https://doi.org/10.1016/j.bone.2012.03.023 [PubMed]
- 4. Goekoop RJ, Kloppenburg M, Kroon HM, Dirkse LE, Huizinga TW, Westendorp RG, Gussekloo J. Determinants of absence of osteoarthritis in old age. Scand J Rheumatol. 2011; 40:68–73. https://doi.org/10.3109/03009742.2010.500618 [PubMed]
- 5. Solomon DH, Rassen JA, Glynn RJ, Lee J, Levin R, Schneeweiss S. The comparative safety of analgesics in older adults with arthritis. Arch Intern Med. 2010; 170:1968–76. https://doi.org/10.1001/archinternmed.2010.391 [PubMed]
- 6. Glasson SS, Blanchet TJ, Morris EA. The surgical destabilization of the medial meniscus (DMM) model of osteoarthritis in the 129/SvEv mouse. Osteoarthritis Cartilage. 2007; 15:1061–69. https://doi.org/10.1016/j.joca.2007.03.006 [PubMed]
- 7. Tsuchida AI, Beekhuizen M, ’t Hart MC, Radstake TR, Dhert WJ, Saris DB, van Osch GJ, Creemers LB. Cytokine profiles in the joint depend on pathology, but are different between synovial fluid, cartilage tissue and cultured chondrocytes. Arthritis Res Ther. 2014; 16:441. https://doi.org/10.1186/s13075-014-0441-0 [PubMed]
- 8. Lambert C, Dubuc JE, Montell E, Vergés J, Munaut C, Noël A, Henrotin Y. Gene expression pattern of cells from inflamed and normal areas of osteoarthritis synovial membrane. Arthritis Rheumatol. 2014; 66:960–68. https://doi.org/10.1002/art.38315 [PubMed]
- 9. Sato T, Konomi K, Yamasaki S, Aratani S, Tsuchimochi K, Yokouchi M, Masuko-Hongo K, Yagishita N, Nakamura H, Komiya S, Beppu M, Aoki H, Nishioka K, Nakajima T. Comparative analysis of gene expression profiles in intact and damaged regions of human osteoarthritic cartilage. Arthritis Rheum. 2006; 54:808–17. https://doi.org/10.1002/art.21638 [PubMed]
- 10. Cardoso AL, Fernandes A, Aguilar-Pimentel JA, de Angelis MH, Guedes JR, Brito MA, Ortolano S, Pani G, Athanasopoulou S, Gonos ES, Schosserer M, Grillari J, Peterson P, et al. Towards frailty biomarkers: candidates from genes and pathways regulated in aging and age-related diseases. Ageing Res Rev. 2018; 47:214–77. https://doi.org/10.1016/j.arr.2018.07.004 [PubMed]
- 11. Bürkle A, Moreno-Villanueva M, Bernhard J, Blasco M, Zondag G, Hoeijmakers JH, Toussaint O, Grubeck-Loebenstein B, Mocchegiani E, Collino S, Gonos ES, Sikora E, Gradinaru D, et al. MARK-AGE biomarkers of ageing. Mech Ageing Dev. 2015; 151:2–12. https://doi.org/10.1016/j.mad.2015.03.006 [PubMed]
- 12. Franceschi C, Bonafè M, Valensin S, Olivieri F, De Luca M, Ottaviani E, De Benedictis G. Inflamm-aging. An evolutionary perspective on immunosenescence. Ann N Y Acad Sci. 2000; 908:244–54. https://doi.org/10.1111/j.1749-6632.2000.tb06651.x [PubMed]
- 13. Harris TB, Ferrucci L, Tracy RP, Corti MC, Wacholder S, Ettinger WH
Jr , Heimovitz H, Cohen HJ, Wallace R. Associations of elevated interleukin-6 and C-reactive protein levels with mortality in the elderly. Am J Med. 1999; 106:506–12. https://doi.org/10.1016/S0002-9343(99)00066-2 [PubMed] - 14. O’Mahony L, Holland J, Jackson J, Feighery C, Hennessy TP, Mealy K. Quantitative intracellular cytokine measurement: age-related changes in proinflammatory cytokine production. Clin Exp Immunol. 1998; 113:213–19. https://doi.org/10.1046/j.1365-2249.1998.00641.x [PubMed]
- 15. Ershler WB. Interleukin-6: a cytokine for gerontologists. J Am Geriatr Soc. 1993; 41:176–81. https://doi.org/10.1111/j.1532-5415.1993.tb02054.x [PubMed]
- 16. Larsson S, Englund M, Struglics A, Lohmander LS. Interleukin-6 and tumor necrosis factor alpha in synovial fluid are associated with progression of radiographic knee osteoarthritis in subjects with previous meniscectomy. Osteoarthritis Cartilage. 2015; 23:1906–14. https://doi.org/10.1016/j.joca.2015.05.035 [PubMed]
- 17. Jin X, Beguerie JR, Zhang W, Blizzard L, Otahal P, Jones G, Ding C. Circulating C reactive protein in osteoarthritis: a systematic review and meta-analysis. Ann Rheum Dis. 2015; 74:703–10. https://doi.org/10.1136/annrheumdis-2013-204494 [PubMed]
- 18. Pearle AD, Scanzello CR, George S, Mandl LA, DiCarlo EF, Peterson M, Sculco TP, Crow MK. Elevated high-sensitivity C-reactive protein levels are associated with local inflammatory findings in patients with osteoarthritis. Osteoarthritis Cartilage. 2007; 15:516–23. https://doi.org/10.1016/j.joca.2006.10.010 [PubMed]
- 19. Conrozier T, Carlier MC, Mathieu P, Colson F, Debard AL, Richard S, Favret H, Bienvenu J, Vignon E. Serum levels of YKL-40 and C reactive protein in patients with hip osteoarthritis and healthy subjects: a cross sectional study. Ann Rheum Dis. 2000; 59:828–31. https://doi.org/10.1136/ard.59.10.828 [PubMed]
- 20. Rea IM, Gibson DS, McGilligan V, McNerlan SE, Alexander HD, Ross OA. Age and Age-Related Diseases: Role of Inflammation Triggers and Cytokines. Front Immunol. 2018; 9:586. https://doi.org/10.3389/fimmu.2018.00586 [PubMed]
- 21. Frasca D, Blomberg BB, Paganelli R. Aging, Obesity, and Inflammatory Age-Related Diseases. Front Immunol. 2017; 8:1745. https://doi.org/10.3389/fimmu.2017.01745 [PubMed]
- 22. Fantuzzi G. Adipose tissue, adipokines, and inflammation. J Allergy Clin Immunol. 2005; 115:911–19. https://doi.org/10.1016/j.jaci.2005.02.023 [PubMed]
- 23. Vuolteenaho K, Koskinen A, Kukkonen M, Nieminen R, Päivärinta U, Moilanen T, Moilanen E. Leptin enhances synthesis of proinflammatory mediators in human osteoarthritic cartilage—mediator role of NO in leptin-induced PGE2, IL-6, and IL-8 production. Mediators Inflamm. 2009; 2009:345838. https://doi.org/10.1155/2009/345838 [PubMed]
- 24. Neumeier M, Weigert J, Schäffler A, Wehrwein G, Müller-Ladner U, Schölmerich J, Wrede C, Buechler C. Different effects of adiponectin isoforms in human monocytic cells. J Leukoc Biol. 2006; 79:803–08. https://doi.org/10.1189/jlb.0905521 [PubMed]
- 25. Bokarewa M, Nagaev I, Dahlberg L, Smith U, Tarkowski A. Resistin, an adipokine with potent proinflammatory properties. J Immunol. 2005; 174:5789–95. https://doi.org/10.4049/jimmunol.174.9.5789 [PubMed]
- 26. Martel-Pelletier J, Tardif G, Rousseau Trépanier J, Abram F, Dorais M, Raynauld JP, Pelletier JP. The ratio adipsin/MCP-1 is strongly associated with structural changes and CRP/MCP-1 with symptoms in obese knee osteoarthritis subjects: data from the Osteoarthritis Initiative. Osteoarthritis Cartilage. 2019; 27:1163–73. https://doi.org/10.1016/j.joca.2019.04.016 [PubMed]
- 27. Valverde-Franco G, Tardif G, Mineau F, Paré F, Lussier B, Fahmi H, Pelletier JP, Martel-Pelletier J. High in vivo levels of adipsin lead to increased knee tissue degradation in osteoarthritis: data from humans and animal models. Rheumatology (Oxford). 2018; 57:1851–60. https://doi.org/10.1093/rheumatology/key181 [PubMed]
- 28. Martel-Pelletier J, Raynauld JP, Dorais M, Abram F, Pelletier JP. The levels of the adipokines adipsin and leptin are associated with knee osteoarthritis progression as assessed by MRI and incidence of total knee replacement in symptomatic osteoarthritis patients: a post hoc analysis. Rheumatology (Oxford). 2016; 55:680–88. https://doi.org/10.1093/rheumatology/kev408 [PubMed]
- 29. Engelfriet PM, Jansen EH, Picavet HS, Dollé ME. Biochemical markers of aging for longitudinal studies in humans. Epidemiol Rev. 2013; 35:132–51. https://doi.org/10.1093/epirev/mxs011 [PubMed]
- 30. Simopoulou T, Malizos KN, Iliopoulos D, Stefanou N, Papatheodorou L, Ioannou M, Tsezou A. Differential expression of leptin and leptin’s receptor isoform (Ob-Rb) mRNA between advanced and minimally affected osteoarthritic cartilage; effect on cartilage metabolism. Osteoarthritis Cartilage. 2007; 15:872–83. https://doi.org/10.1016/j.joca.2007.01.018 [PubMed]
- 31. White RT, Damm D, Hancock N, Rosen BS, Lowell BB, Usher P, Flier JS, Spiegelman BM. Human adipsin is identical to complement factor D and is expressed at high levels in adipose tissue. J Biol Chem. 1992; 267:9210–13. [PubMed]
- 32. McGeer PL, Lee M, McGeer EG. A review of human diseases caused or exacerbated by aberrant complement activation. Neurobiol Aging. 2017; 52:12–22. https://doi.org/10.1016/j.neurobiolaging.2016.12.017 [PubMed]
- 33. van Lookeren Campagne M, Strauss EC, Yaspan BL. Age-related macular degeneration: complement in action. Immunobiology. 2016; 221:733–39. https://doi.org/10.1016/j.imbio.2015.11.007 [PubMed]
- 34. Struglics A, Okroj M, Swärd P, Frobell R, Saxne T, Lohmander LS, Blom AM. The complement system is activated in synovial fluid from subjects with knee injury and from patients with osteoarthritis. Arthritis Res Ther. 2016; 18:223. https://doi.org/10.1186/s13075-016-1123-x [PubMed]
- 35. Naito AT, Sumida T, Nomura S, Liu ML, Higo T, Nakagawa A, Okada K, Sakai T, Hashimoto A, Hara Y, Shimizu I, Zhu W, Toko H, et al. Complement C1q activates canonical Wnt signaling and promotes aging-related phenotypes. Cell. 2012; 149:1298–313. https://doi.org/10.1016/j.cell.2012.03.047 [PubMed]
- 36. Wang Q, Rozelle AL, Lepus CM, Scanzello CR, Song JJ, Larsen DM, Crish JF, Bebek G, Ritter SY, Lindstrom TM, Hwang I, Wong HH, Punzi L, et al. Identification of a central role for complement in osteoarthritis. Nat Med. 2011; 17:1674–79. https://doi.org/10.1038/nm.2543 [PubMed]
- 37. Glasson SS, Chambers MG, Van Den Berg WB, Little CB. The OARSI histopathology initiative - recommendations for histological assessments of osteoarthritis in the mouse. Osteoarthritis Cartilage. 2010 (Suppl 3); 18:S17–23. https://doi.org/10.1016/j.joca.2010.05.025 [PubMed]
- 38. Hasegawa A, Otsuki S, Pauli C, Miyaki S, Patil S, Steklov N, Kinoshita M, Koziol J, D’Lima DD, Lotz MK. Anterior cruciate ligament changes in the human knee joint in aging and osteoarthritis. Arthritis Rheum. 2012; 64:696–704. https://doi.org/10.1002/art.33417 [PubMed]
- 39. Huebner JL, Williams JM, Deberg M, Henrotin Y, Kraus VB. Collagen fibril disruption occurs early in primary guinea pig knee osteoarthritis. Osteoarthritis Cartilage. 2010; 18:397–405. https://doi.org/10.1016/j.joca.2009.09.011 [PubMed]
- 40. Young RD, Vaughan-Thomas A, Wardale RJ, Duance VC. Type II collagen deposition in cruciate ligament precedes osteoarthritis in the guinea pig knee. Osteoarthritis Cartilage. 2002; 10:420–28. https://doi.org/10.1053/joca.2002.0530 [PubMed]
- 41. Anderson-MacKenzie JM, Billingham ME, Bailey AJ. Collagen remodeling in the anterior cruciate ligament associated with developing spontaneous murine osteoarthritis. Biochem Biophys Res Commun. 1999; 258:763–67. https://doi.org/10.1006/bbrc.1999.0713 [PubMed]
- 42. Li Y, Zou W, Brestoff JR, Rohatgi N, Wu X, Atkinson JP, Harris CA, Teitelbaum SL. Fat-Produced Adipsin Regulates Inflammatory Arthritis. Cell Rep. 2019; 27:2809–16.e3. https://doi.org/10.1016/j.celrep.2019.05.032 [PubMed]
- 43. Loeser RF, Goldring SR, Scanzello CR, Goldring MB. Osteoarthritis: a disease of the joint as an organ. Arthritis Rheum. 2012; 64:1697–707. https://doi.org/10.1002/art.34453 [PubMed]
- 44. Martel-Pelletier J, Lajeunesse D, Pelletier JP. Etiopathogenesis of osteoarthritis. In: Koopman WJ, Moreland LW, editors. Arthritis & Allied Conditions A Textbook of Rheumatology. Baltimore: Lippincott, Williams & Wilkins; 2005. pp. 2199–226.
- 45. Harkey MS, Davis JE, Lu B, Price LL, Ward RJ, MacKay JW, Eaton CB, Lo GH, Barbe MF, Zhang M, Pang J, Stout AC, McAlindon TE, Driban JB. Early pre-radiographic structural pathology precedes the onset of accelerated knee osteoarthritis. BMC Musculoskelet Disord. 2019; 20:241. https://doi.org/10.1186/s12891-019-2624-y [PubMed]
- 46. Pelletier JP, Kapoor M, Martel-Pelletier J. Animal models of osteoarthritis. In: Hochberg M, Silman JA, Smolen JS, Weinblatt ME, Wiesman MH, editors. Rheumatology. Philadelphia, PA, USA: Elsevier; 2014. pp. 1454–61.
- 47. Pelletier JP, Boileau C, Boily M, Brunet J, Mineau F, Geng C, Reboul P, Laufer S, Lajeunesse D, Martel-Pelletier J. The protective effect of licofelone on experimental osteoarthritis is correlated with the downregulation of gene expression and protein synthesis of several major cartilage catabolic factors: MMP-13, cathepsin K and aggrecanases. Arthritis Res Ther. 2005; 7:R1091–102. https://doi.org/10.1186/ar1788 [PubMed]
- 48. Pelletier JP, Boileau C, Brunet J, Boily M, Lajeunesse D, Reboul P, Laufer S, Martel-Pelletier J. The inhibition of subchondral bone resorption in the early phase of experimental dog osteoarthritis by licofelone is associated with a reduction in the synthesis of MMP-13 and cathepsin K. Bone. 2004; 34:527–38. https://doi.org/10.1016/j.bone.2003.11.021 [PubMed]
- 49. Jovanovic DV, Fernandes JC, Martel-Pelletier J, Jolicoeur FC, Reboul P, Laufer S, Tries S, Pelletier JP. In vivo dual inhibition of cyclooxygenase and lipoxygenase by ML-3000 reduces the progression of experimental osteoarthritis: suppression of collagenase 1 and interleukin-1beta synthesis. Arthritis Rheum. 2001; 44:2320–30. https://doi.org/10.1002/1529-0131(200110)44:10<2320::AID-ART394>3.0.CO;2-P [PubMed]
- 50. Yu LP
Jr , Smith GNJr , Brandt KD, Myers SL, O’Connor BL, Brandt DA. Reduction of the severity of canine osteoarthritis by prophylactic treatment with oral doxycycline. Arthritis Rheum. 1992; 35:1150–59. https://doi.org/10.1002/art.1780351007 [PubMed] - 51. Raynauld JP, Martel-Pelletier J, Bias P, Laufer S, Haraoui B, Choquette D, Beaulieu AD, Abram F, Dorais M, Vignon E, Pelletier JP, and Canadian Licofelone Study Group. Protective effects of licofelone, a 5-lipoxygenase and cyclo-oxygenase inhibitor, versus naproxen on cartilage loss in knee osteoarthritis: a first multicentre clinical trial using quantitative MRI. Ann Rheum Dis. 2009; 68:938–47. https://doi.org/10.1136/ard.2008.088732 [PubMed]
- 52. Brandt KD, Mazzuca SA, Katz BP, Lane KA, Buckwalter KA, Yocum DE, Wolfe F, Schnitzer TJ, Moreland LW, Manzi S, Bradley JD, Sharma L, Oddis CV, et al. Effects of doxycycline on progression of osteoarthritis: results of a randomized, placebo-controlled, double-blind trial. Arthritis Rheum. 2005; 52:2015–25. https://doi.org/10.1002/art.21122 [PubMed]
- 53. Hui X, Feng T, Liu Q, Gao Y, Xu A. The FGF21-adiponectin axis in controlling energy and vascular homeostasis. J Mol Cell Biol. 2016; 8:110–19. https://doi.org/10.1093/jmcb/mjw013 [PubMed]
- 54. Li SM, Yu YH, Li L, Wang WF, Li DS. Treatment of CIA Mice with FGF21 Down-regulates TH17-IL-17 Axis. Inflammation. 2016; 39:309–19. https://doi.org/10.1007/s10753-015-0251-9 [PubMed]
- 55. Yu Y, Li S, Liu Y, Tian G, Yuan Q, Bai F, Wang W, Zhang Z, Ren G, Zhang Y, Li D. Fibroblast growth factor 21 (FGF21) ameliorates collagen-induced arthritis through modulating oxidative stress and suppressing nuclear factor-kappa B pathway. Int Immunopharmacol. 2015; 25:74–82. https://doi.org/10.1016/j.intimp.2015.01.005 [PubMed]
- 56. Honsawek S, Chayanupatkul M. Correlation of plasma and synovial fluid adiponectin with knee osteoarthritis severity. Arch Med Res. 2010; 41:593–98. https://doi.org/10.1016/j.arcmed.2010.11.007 [PubMed]
- 57. Chen TH, Chen L, Hsieh MS, Chang CP, Chou DT, Tsai SH. Evidence for a protective role for adiponectin in osteoarthritis. Biochim Biophys Acta. 2006; 1762:711–18. https://doi.org/10.1016/j.bbadis.2006.06.008 [PubMed]
- 58. Wang WF, Ma L, Liu MY, Zhao TT, Zhang T, Yang YB, Cao HX, Han XH, Li DS. A novel function for fibroblast growth factor 21: stimulation of NADPH oxidase-dependent ROS generation. Endocrine. 2015; 49:385–95. https://doi.org/10.1007/s12020-014-0502-9 [PubMed]
- 59. Markan KR, Naber MC, Ameka MK, Anderegg MD, Mangelsdorf DJ, Kliewer SA, Mohammadi M, Potthoff MJ. Circulating FGF21 is liver derived and enhances glucose uptake during refeeding and overfeeding. Diabetes. 2014; 63:4057–63. https://doi.org/10.2337/db14-0595 [PubMed]
- 60. Salminen A, Kaarniranta K, Kauppinen A. Integrated stress response stimulates FGF21 expression: systemic enhancer of longevity. Cell Signal. 2017; 40:10–21. https://doi.org/10.1016/j.cellsig.2017.08.009 [PubMed]
- 61. Yu Y, Bai F, Wang W, Liu Y, Yuan Q, Qu S, Zhang T, Tian G, Li S, Li D, Ren G. Fibroblast growth factor 21 protects mouse brain against D-galactose induced aging via suppression of oxidative stress response and advanced glycation end products formation. Pharmacol Biochem Behav. 2015; 133:122–31. https://doi.org/10.1016/j.pbb.2015.03.020 [PubMed]
- 62. Kim EK, Lee SH, Jhun JY, Byun JK, Jeong JH, Lee SY, Kim JK, Choi JY, Cho ML. Metformin Prevents Fatty Liver and Improves Balance of White/Brown Adipose in an Obesity Mouse Model by Inducing FGF21. Mediators Inflamm. 2016; 2016:5813030. https://doi.org/10.1155/2016/5813030 [PubMed]
- 63. Erickson A, Moreau R. The regulation of FGF21 gene expression by metabolic factors and nutrients. Horm Mol Biol Clin Investig. 2016; 30:30. https://doi.org/10.1515/hmbci-2016-0016 [PubMed]
- 64. Shimizu N, Maruyama T, Yoshikawa N, Matsumiya R, Ma Y, Ito N, Tasaka Y, Kuribara-Souta A, Miyata K, Oike Y, Berger S, Schütz G, Takeda S, Tanaka H. A muscle-liver-fat signalling axis is essential for central control of adaptive adipose remodelling. Nat Commun. 2015; 6:6693. https://doi.org/10.1038/ncomms7693 [PubMed]
- 65. BonDurant LD, Ameka M, Naber MC, Markan KR, Idiga SO, Acevedo MR, Walsh SA, Ornitz DM, Potthoff MJ. FGF21 Regulates Metabolism Through Adipose-Dependent and -Independent Mechanisms. Cell Metab. 2017; 25:935–944.e4. https://doi.org/10.1016/j.cmet.2017.03.005 [PubMed]
- 66. Holland WL, Adams AC, Brozinick JT, Bui HH, Miyauchi Y, Kusminski CM, Bauer SM, Wade M, Singhal E, Cheng CC, Volk K, Kuo MS, Gordillo R, et al. An FGF21-adiponectin-ceramide axis controls energy expenditure and insulin action in mice. Cell Metab. 2013; 17:790–97. https://doi.org/10.1016/j.cmet.2013.03.019 [PubMed]
- 67. Itoh N. FGF21 as a Hepatokine, Adipokine, and Myokine in Metabolism and Diseases. Front Endocrinol (Lausanne). 2014; 5:107. https://doi.org/10.3389/fendo.2014.00107 [PubMed]
- 68. Inagaki T, Dutchak P, Zhao G, Ding X, Gautron L, Parameswara V, Li Y, Goetz R, Mohammadi M, Esser V, Elmquist JK, Gerard RD, Burgess SC, et al. Endocrine regulation of the fasting response by PPARalpha-mediated induction of fibroblast growth factor 21. Cell Metab. 2007; 5:415–25. https://doi.org/10.1016/j.cmet.2007.05.003 [PubMed]
- 69. Xu Y, Ma M, Ippolito GC, Schroeder HW
Jr , Carroll MC, Volanakis JE. Complement activation in factor D-deficient mice. Proc Natl Acad Sci USA. 2001; 98:14577–82. https://doi.org/10.1073/pnas.261428398 [PubMed] - 70. Krysiak R, Handzlik-Orlik G, Okopien B. The role of adipokines in connective tissue diseases. Eur J Nutr. 2012; 51:513–28. https://doi.org/10.1007/s00394-012-0370-0 [PubMed]
- 71. Shehzad A, Iqbal W, Shehzad O, Lee YS. Adiponectin: regulation of its production and its role in human diseases. Hormones (Athens). 2012; 11:8–20. https://doi.org/10.1007/BF03401534 [PubMed]
- 72. Lin Z, Tian H, Lam KS, Lin S, Hoo RC, Konishi M, Itoh N, Wang Y, Bornstein SR, Xu A, Li X. Adiponectin mediates the metabolic effects of FGF21 on glucose homeostasis and insulin sensitivity in mice. Cell Metab. 2013; 17:779–89. https://doi.org/10.1016/j.cmet.2013.04.005 [PubMed]
- 73. Chen M, Muckersie E, Luo C, Forrester JV, Xu H. Inhibition of the alternative pathway of complement activation reduces inflammation in experimental autoimmune uveoretinitis. Eur J Immunol. 2010; 40:2870–81. https://doi.org/10.1002/eji.201040323 [PubMed]
- 74. Mueller-Ortiz SL, Drouin SM, Wetsel RA. The alternative activation pathway and complement component C3 are critical for a protective immune response against Pseudomonas aeruginosa in a murine model of pneumonia. Infect Immun. 2004; 72:2899–906. https://doi.org/10.1128/IAI.72.5.2899-2906.2004 [PubMed]
- 75. Koskinen-Kolasa A, Vuolteenaho K, Korhonen R, Moilanen T, Moilanen E. Catabolic and proinflammatory effects of leptin in chondrocytes are regulated by suppressor of cytokine signaling-3. Arthritis Res Ther. 2016; 18:215. https://doi.org/10.1186/s13075-016-1112-0 [PubMed]
- 76. Staikos C, Ververidis A, Drosos G, Manolopoulos VG, Verettas DA, Tavridou A. The association of adipokine levels in plasma and synovial fluid with the severity of knee osteoarthritis. Rheumatology (Oxford). 2013; 52:1077–83. https://doi.org/10.1093/rheumatology/kes422 [PubMed]
- 77. Karvonen-Gutierrez CA, Harlow SD, Mancuso P, Jacobson J, Mendes de Leon CF, Nan B. Association of leptin levels with radiographic knee osteoarthritis among a cohort of midlife women. Arthritis Care Res (Hoboken). 2013; 65:936–44. https://doi.org/10.1002/acr.21922 [PubMed]
- 78. Ding C, Parameswaran V, Cicuttini F, Burgess J, Zhai G, Quinn S, Jones G. Association between leptin, body composition, sex and knee cartilage morphology in older adults: the Tasmanian older adult cohort (TASOAC) study. Ann Rheum Dis. 2008; 67:1256–61. https://doi.org/10.1136/ard.2007.082651 [PubMed]
- 79. Van Spil WE, Welsing PM, Kloppenburg M, Bierma-Zeinstra SM, Bijlsma JW, Mastbergen SC, Lafeber FP. Cross-sectional and predictive associations between plasma adipokines and radiographic signs of early-stage knee osteoarthritis: data from CHECK. Osteoarthritis Cartilage. 2012; 20:1278–85. https://doi.org/10.1016/j.joca.2012.08.001 [PubMed]
- 80. de Boer TN, van Spil WE, Huisman AM, Polak AA, Bijlsma JW, Lafeber FP, Mastbergen SC. Serum adipokines in osteoarthritis; comparison with controls and relationship with local parameters of synovial inflammation and cartilage damage. Osteoarthritis Cartilage. 2012; 20:846–53. https://doi.org/10.1016/j.joca.2012.05.002 [PubMed]
- 81. Steppan CM, Bailey ST, Bhat S, Brown EJ, Banerjee RR, Wright CM, Patel HR, Ahima RS, Lazar MA. The hormone resistin links obesity to diabetes. Nature. 2001; 409:307–12. https://doi.org/10.1038/35053000 [PubMed]
- 82. Koskinen A, Vuolteenaho K, Moilanen T, Moilanen E. Resistin as a factor in osteoarthritis: synovial fluid resistin concentrations correlate positively with interleukin 6 and matrix metalloproteinases MMP-1 and MMP-3. Scand J Rheumatol. 2014; 43:249–53. https://doi.org/10.3109/03009742.2013.853096 [PubMed]
- 83. Lee JH, Ort T, Ma K, Picha K, Carton J, Marsters PA, Lohmander LS, Baribaud F, Song XY, Blake S. Resistin is elevated following traumatic joint injury and causes matrix degradation and release of inflammatory cytokines from articular cartilage in vitro. Osteoarthritis Cartilage. 2009; 17:613–20. https://doi.org/10.1016/j.joca.2008.08.007 [PubMed]
- 84. Pelletier JP, Faure MP, DiBattista JA, Wilhelm S, Visco D, Martel-Pelletier J. Coordinate synthesis of stromelysin, interleukin-1, and oncogene proteins in experimental osteoarthritis. An immunohistochemical study. Am J Pathol. 1993; 142:95–105. [PubMed]
- 85. Mehraban F, Lark MW, Ahmed FN, Xu F, Moskowitz RW. Increased secretion and activity of matrix metalloproteinase-3 in synovial tissues and chondrocytes from experimental osteoarthritis. Osteoarthritis Cartilage. 1998; 6:286–94. https://doi.org/10.1053/joca.1998.0122 [PubMed]
- 86. Parker D, Sloane R, Pieper CF, Hall KS, Kraus VB, Kraus WE, Huebner JL, Ilkayeva OR, Bain JR, Newby LK, Cohen HJ, Morey MC. Age-Related Adverse Inflammatory and Metabolic Changes Begin Early in Adulthood. J Gerontol A Biol Sci Med Sci. 2019; 74:283–89. https://doi.org/10.1093/gerona/gly121 [PubMed]
- 87. Manicourt DH, Fujimoto N, Obata K, Thonar EJ. Serum levels of collagenase, stromelysin-1, and TIMP-1. Age- and sex-related differences in normal subjects and relationship to the extent of joint involvement and serum levels of antigenic keratan sulfate in patients with osteoarthritis. Arthritis Rheum. 1994; 37:1774–83. https://doi.org/10.1002/art.1780371211 [PubMed]
- 88. Fujita K, Ando T, Ohba T, Wako M, Sato N, Nakamura Y, Ohnuma Y, Hara Y, Kato R, Nakao A, Haro H. Age-related expression of MCP-1 and MMP-3 in mouse intervertebral disc in relation to TWEAK and TNF-α stimulation. J Orthop Res. 2012; 30:599–605. https://doi.org/10.1002/jor.21560 [PubMed]
- 89. Lampropoulou-Adamidou K, Lelovas P, Karadimas EV, Liakou C, Triantafillopoulos IK, Dontas I, Papaioannou NA. Useful animal models for the research of osteoarthritis. Eur J Orthop Surg Traumatol. 2014; 24:263–71. https://doi.org/10.1007/s00590-013-1205-2 [PubMed]
- 90. Kwok J, Onuma H, Olmer M, Lotz MK, Grogan SP, D’Lima DD. Histopathological analyses of murine menisci: implications for joint aging and osteoarthritis. Osteoarthritis Cartilage. 2016; 24:709–18. https://doi.org/10.1016/j.joca.2015.11.006 [PubMed]
- 91. Sandy JD, Chan DD, Trevino RL, Wimmer MA, Plaas A. Human genome-wide expression analysis reorients the study of inflammatory mediators and biomechanics in osteoarthritis. Osteoarthritis Cartilage. 2015; 23:1939–45. https://doi.org/10.1016/j.joca.2015.03.027 [PubMed]
- 92. Lo JC, Ljubicic S, Leibiger B, Kern M, Leibiger IB, Moede T, Kelly ME, Chatterjee Bhowmick D, Murano I, Cohen P, Banks AS, Khandekar MJ, Dietrich A, et al. Adipsin is an adipokine that improves β cell function in diabetes. Cell. 2014; 158:41–53. https://doi.org/10.1016/j.cell.2014.06.005 [PubMed]
- 93. Valverde-Franco G, Pelletier JP, Fahmi H, Hum D, Matsuo K, Lussier B, Kapoor M, Martel-Pelletier J. In vivo bone-specific EphB4 overexpression in mice protects both subchondral bone and cartilage during osteoarthritis. Arthritis Rheum. 2012; 64:3614–25. https://doi.org/10.1002/art.34638 [PubMed]
- 94. Valverde-Franco G, Liu H, Davidson D, Chai S, Valderrama-Carvajal H, Goltzman D, Ornitz DM, Henderson JE. Defective bone mineralization and osteopenia in young adult FGFR3-/- mice. Hum Mol Genet. 2004; 13:271–84. https://doi.org/10.1093/hmg/ddh034 [PubMed]
- 95. Hsieh CF, Alberton P, Loffredo-Verde E, Volkmer E, Pietschmann M, Müller PE, Schieker M, Docheva D. Periodontal ligament cells as alternative source for cell-based therapy of tendon injuries: in vivo study of full-size Achilles tendon defect in a rat model. Eur Cell Mater. 2016; 32:228–40. https://doi.org/10.22203/eCM.v032a15 [PubMed]
- 96. Wan C, Hao Z, Wen S, Leng H. A quantitative study of the relationship between the distribution of different types of collagen and the mechanical behavior of rabbit medial collateral ligaments. PLoS One. 2014; 9:e103363. https://doi.org/10.1371/journal.pone.0103363 [PubMed]
- 97. Ouhaddi Y, Nebbaki SS, Habouri L, Afif H, Lussier B, Kapoor M, Narumiya S, Pelletier JP, Martel-Pelletier J, Benderdour M, Fahmi H. Exacerbation of Aging-Associated and Instability-Induced Murine Osteoarthritis With Deletion of D Prostanoid Receptor 1, a Prostaglandin D2 Receptor. Arthritis Rheumatol. 2017; 69:1784–95. https://doi.org/10.1002/art.40160 [PubMed]
- 98. Tardif G, Pelletier JP, Fahmi H, Hum D, Zhang Y, Kapoor M, Martel-Pelletier J. NFAT3 and TGF-β/SMAD3 regulate the expression of miR-140 in osteoarthritis. Arthritis Res Ther. 2013; 15:R197. https://doi.org/10.1186/ar4387 [PubMed]
- 99. Tardif G, Hum D, Pelletier JP, Duval N, Martel-Pelletier J. Regulation of the IGFBP-5 and MMP-13 genes by the microRNAs miR-140 and miR-27a in human osteoarthritic chondrocytes. BMC Musculoskelet Disord. 2009; 10:148. https://doi.org/10.1186/1471-2474-10-148 [PubMed]