


This article has been corrected: The authors requested to replace Figure 3 and Figure 6. The mistakes of these figures are described below:
Figure 3: the Westernblot of SDHB in Figure3B of MCF-7 flipped horizontally.
Figure 6: the Westernblot of Cytc in Figure6B of MDA-231 was identical to Uqcrfs1 due to the layout mistakes.
These corrections do not change any of the conclusions of the publication. The corrected Figure 3 and Figure 6 are provided below.
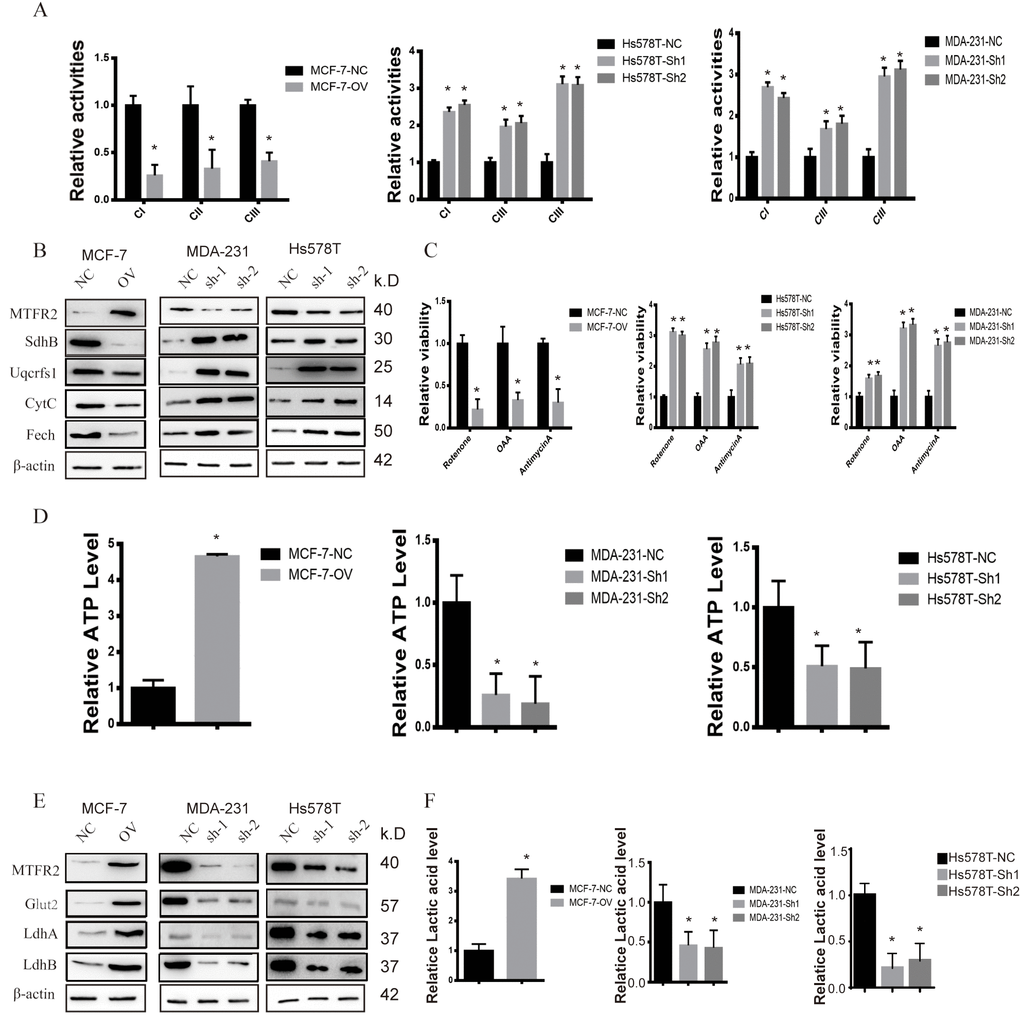
Figure 3. MTFR promotes the glycolysis of BC. (A) The relative activities of the CI CII and CIII of different cell lines (Student’s two one-tailed paired test * p<0.05). (B) Western blot of OXPHOS markers of different cell lines. (C) The relative viability of different cell lines treated with different inhibitors (Student’s two one-tailed paired test * p<0.05). (D) The relative ATP level of different cell lines (Student’s two one-tailed paired test * p<0.05). (E) Western blot of glycolysis markers of different cell lines. (F) The relative lactic acid level of different cell lines (Student’s two one-tailed paired test * p<0.05).
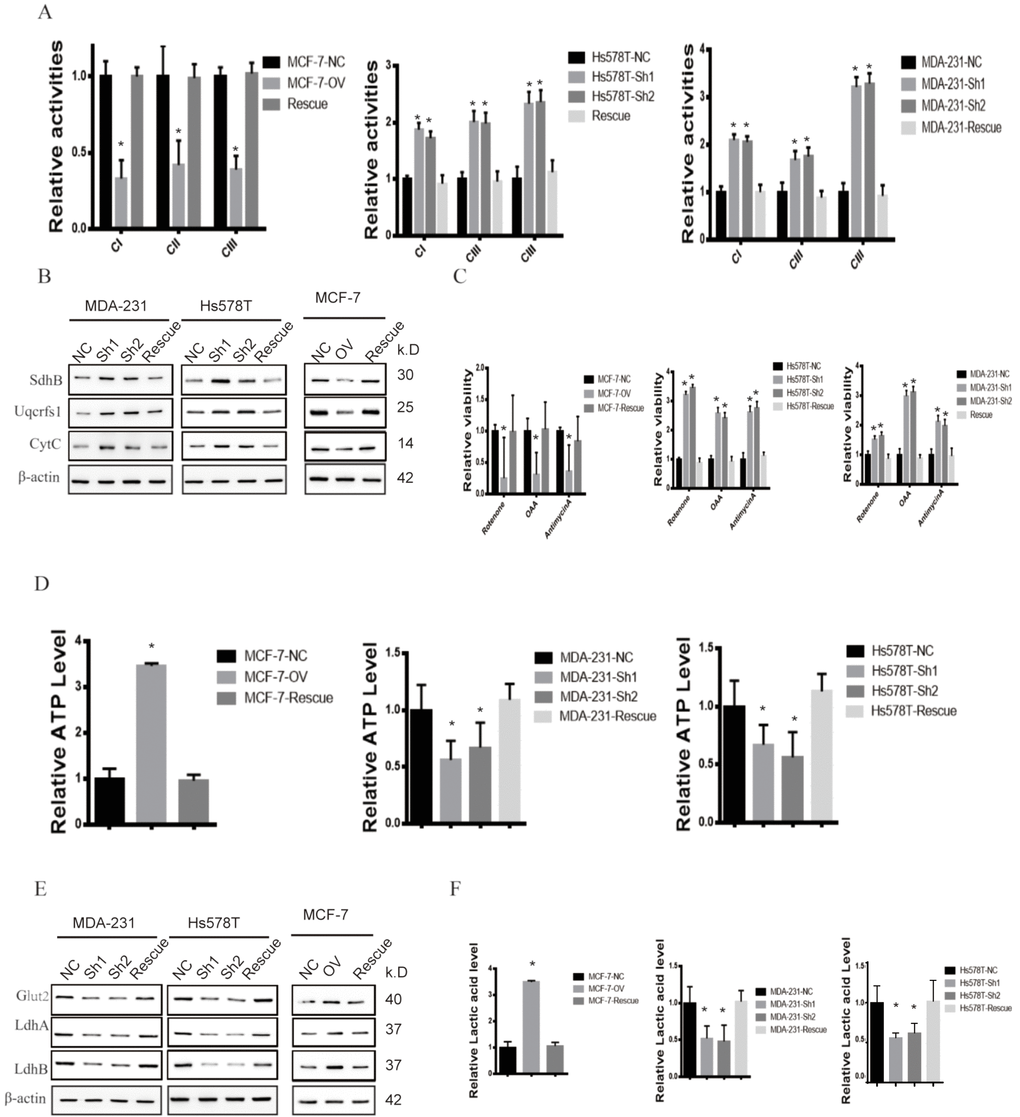
Figure 6. MTFR promotes the glycolysis of BC in a HIF1α- and HIF2α-dependent manner. (A) The relative activities of the CI CII and CIII of different cell lines (Student’s two one-tailed paired test * p<0.05). (B) Western blot of OXPHOS markers of different cell lines. (C) The relative viability of different cell lines treated with different inhibitors (Student’s two one-tailed paired test * p<0.05). (D) The relative ATP level of different cell lines (Student’s two one-tailed paired test * p<0.05). (E) Western blot of glycolysis markers of different cell lines. (F) The relative lactic acid level of different cell line (Student’s two one-tailed paired test * p<0.05).