


Introduction
Renal cell carcinoma (RCC), one of the most common malignancies of the urinary system, constitutes 3% of malignant tumors in adult [1]. The most common pathological type is Kidney Renal Clear Cell Carcinoma (KIRC), which is associated with high morbidity and poor prognosis [2]. Clinicopathological risk factors cannot sufficiently identify KIRC patients with a high risk of disease progression [3]. Currently, molecular biomarkers have been shown to guide the diagnosis, prognosis and therapy for KIRC patients. For example, IL13RA2 has been reported to involve the acquired sunitinib-resistance in KIRC [4]. High SK1 expression can increase the invasion and angiogenesis abilities of cancer cell in a autocrine and paracrine manner respectively, and lead to a shorter survival in KIRC [5]. However, these reported potential biomarkers and functional important genes have not been tested in larger clinical cohorts. The stability and effectiveness of these biomarkers for KIRC diagnosis, prognosis and treatment response remain to be confirmed.
Autophagy is an intricate and critical homeostatic process in eukaryotic cells [6]. When stimulated by starvation and hypoxia, defective organelles are separated from cytoplasm and encircled by autophagosome (a double-membrane vesicle) [7]. Autophagosomes could mature by fusing with lysosomes to become autolysosomes which contain hydrolases to degrade the components encircled [8–10]. Depending on the conditions, autophagy has both protective and harmful effects including pro- or anti-tumor effects. For instance, chaperone-mediated autophagy degrades different types of substrates, with both cancer-suppressor and cancer-promoting activity [11]. The genes involved in the process of autophagy are called autophagy-related genes (ARGs) [12, 13]. Recent study has reported that ARGs can act as potential therapeutic targets to regulate epithelial to mesenchymal transition (EMT) in renal cell carcinoma [14]. In the present study, we explored the expression variations of 222 ARG genes in KIRC and investigated the potency as biomarkers in KIRC by analyzing 5 independent public datasets, and finally identified P4HB as a novel KIRC diagnosis and prognosis biomarker.
Results
The overall flowchart of this study is shown in Figure 1.
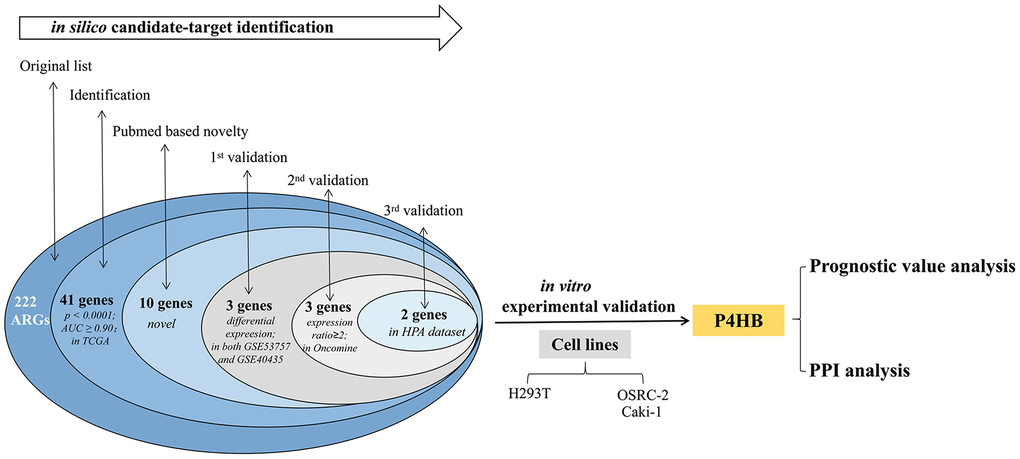
Figure 1. Procedure for the selection and validation of the diagnosis and prognosis biomarkers in KIRC.
Selection phase of ARGs in the TCGA-KIRC
The expression level of each of the 222 ARGs reported in Supplementary Table 1 was compared between KIRC and normal kidney in TCGA-KIRC dataset, which contains 533 KIRC biopsies and 72 normal kidney biopsies, and 177 above ARG members (80%) show the significant differential expression (p<0.05) between KIRC and normal kidney (Supplementary Table 2). For each of 222 genes, the computed AUC from ROC analysis was shown. Expression of 41 ARG genes was found to more effectively discriminate KIRC from normal kidney with AUC ≥ 0.9 and p < 0.0001 (Table 1). By NCBI Pubmed search, we found that 31 of these 41 ARG genes have been reported to be involved in KIRC, while remaining 10 genes have never been demonstrated to be directly related to KIRC (performed on April 1, 2019). Such 10 genes (GABARAPL1, P4HB, ATG12, RAB24, CASP4, VAMP7, NLRC4, NRG3, PEX3 and EEF2K) are here considered as novel KIRC biomarker candidates.
Table 1. The 41 ARGs selected based on TCGA data and their following validation in other independent datasets.
| No. | Gene symbol | Screening phase (in TCGA-KIRC dataset) | Novelty (in PubMed) | First round validation (in the two GEO datasets) | Second round validation (in the Beroukhim dataset, Oncomine) | Third round validation (in the HPA dataset) | RT-PCR experiment validation | Full validation | ||
| 605 patients | 346 patients | 38 patients | 59 patients | Control and kidney cancer cells | ||||||
| t test p value KIRC vs Normal | Ratio KIRC/Normal | AUC | ARG reported for KIRC in PubMed | Validation result | Validation result | Validation result | RT-PCR | |||
| 1 | CDKN2A | <0.0001 | 3.3554 | 0.9894 | 1 | - | - | - | - | - |
| 2 | CXCR4 | <0.0001 | 1.3376 | 0.9771 | 1 | - | - | - | - | - |
| 3 | MTOR | <0.0001 | 0.8954 | 0.9757 | 1 | - | - | - | - | - |
| 4 | GAPDH | <0.0001 | 1.0954 | 0.9688 | 1 | - | - | - | - | - |
| 5 | ERBB2 | <0.0001 | 0.8791 | 0.9653 | 1 | - | - | - | - | - |
| 6 | VEGFA | <0.0001 | 1.2856 | 0.9643 | 1 | - | - | - | - | - |
| 7 | RGS19 | <0.0001 | 1.28 | 0.9609 | 1 | - | - | - | - | - |
| 8 | GNB2L1 | <0.0001 | 1.0845 | 0.9551 | 1 | - | - | - | - | - |
| 9 | BAX | <0.0001 | 1.134 | 0.9497 | 1 | - | - | - | - | - |
| 10 | BID | <0.0001 | 1.1824 | 0.9496 | 1 | - | - | - | - | - |
| 11 | C17orf88 | <0.0001 | 0.1622 | 0.9492 | 1 | - | - | - | - | - |
| 12 | HSPB8 | <0.0001 | 1.2442 | 0.9464 | 1 | - | - | - | - | - |
| 13 | EIF4EBP1 | <0.0001 | 1.234 | 0.9444 | 1 | - | - | - | - | - |
| 14 | BAG1 | <0.0001 | 0.8865 | 0.9436 | 1 | - | - | - | - | - |
| 15 | RAF1 | <0.0001 | 0.9379 | 0.9431 | 1 | - | - | - | - | - |
| 16 | CASP1 | <0.0001 | 1.2376 | 0.9374 | 1 | - | - | - | - | - |
| 17 | CAPN2 | <0.0001 | 0.9399 | 0.9372 | 1 | - | - | - | - | - |
| 18 | BIRC5 | <0.0001 | 1.9741 | 0.9337 | 1 | - | - | - | - | - |
| 19 | DIRAS3 | <0.0001 | 0.6646 | 0.9313 | 1 | - | - | - | - | - |
| 20 | ATG16L2 | <0.0001 | 1.3165 | 0.9281 | 1 | - | - | - | - | - |
| 21 | LAMP1 | <0.0001 | 0.9506 | 0.9273 | 1 | - | - | - | - | - |
| 22 | ATG9B | <0.0001 | 2.0534 | 0.927 | 1 | - | - | - | - | - |
| 23 | ATF4 | <0.0001 | 1.0851 | 0.9256 | 1 | - | - | - | - | - |
| 24 | BNIP3 | <0.0001 | 1.1341 | 0.9205 | 1 | - | - | - | - | - |
| 25 | TP73 | <0.0001 | 2.9322 | 0.9197 | 1 | - | - | - | - | - |
| 26 | ATF6 | <0.0001 | 0.9345 | 0.9107 | 1 | - | - | - | - | - |
| 27 | ATG5 | <0.0001 | 0.9481 | 0.9096 | 1 | - | - | - | - | - |
| 28 | PRKAR1A | <0.0001 | 0.9565 | 0.9094 | 1 | - | - | - | - | - |
| 29 | RAB5A | <0.0001 | 0.9495 | 0.9068 | 1 | - | - | - | - | - |
| 30 | FAS | <0.0001 | 1.1497 | 0.9039 | 1 | - | - | - | - | - |
| 31 | IFNG | <0.0001 | 5.193 | 0.9038 | 1 | - | - | - | - | - |
| 32 | GABARAPL1 | <0.0001 | 0.8589 | 0.9603 | 0 | Yes | Yes | Yes | No | - |
| 33 | P4HB | <0.0001 | 1.1007 | 0.9644 | 0 | Yes | Yes | Yes | Yes | √ |
| 34 | ATG12 | <0.0001 | 1.1101 | 0.9556 | 0 | No | - | - | - | - |
| 35 | RAB24 | <0.0001 | 1.144 | 0.9497 | 0 | No | - | - | - | - |
| 36 | CASP4 | <0.0001 | 1.134 | 0.9413 | 0 | Yes | Yes | No | - | - |
| 37 | VAMP7 | <0.0001 | 0.9431 | 0.9398 | 0 | No | - | - | - | - |
| 38 | NLRC4 | <0.0001 | 1.4631 | 0.9211 | 0 | No | - | - | - | - |
| 39 | NRG3 | <0.0001 | 1.4895 | 0.9193 | 0 | No | - | - | - | - |
| 40 | PEX3 | <0.0001 | 0.914 | 0.9117 | 0 | No | - | - | - | - |
| 41 | EEF2K | <0.0001 | 1.0887 | 0.9116 | 0 | No | - | - | - | - |
First-round validation in the GEO datasets
The 10 genes shown in Table 1 were then tested in two independent GEO datasets (GSE40435 and GSE53757) using GEO2R to screen DEGs (Differential expression gene). 1128 genes presented identical expression trends in two datasets. Then, 3 genes (namely CASP4, P4HB and GABARAPL1) were obtained by overlapping 1128 DEGs and 10 ARG genes reported above.
Second-round validation in the oncomine database
Three genes from first-round validation in GEO datasets were then analyzed in the fourth dataset, namely the Beroukhim dataset derived from Oncomine database. The three genes haven been shown to have an expression ratio in KIRC/controls > 2-fold (Supplementary Table 3). CASP4 is over-expressed in kidney tumors, with fold change 2.697-fold to normal kidney. Similar to CASP4, up-regulation of P4HB was also found in KIRC (fold change = 2.012). A lower expression level of GABARAPL1 was found in KIRC.
ARGs showing very high discriminating ability (AUC>0.90) in the TCGA dataset were searched in Pubmed to identify those never reported in KIRC, and then were validated in a first round validation in the two GEO dataset. Genes passing the first validation were then validated in the Beroukhim dataset. Genes passing the second validation were then validated in the HPA dataset. Genes passing screening phase and all four validations were regards as novel potential KIRC biomarkers. P4HB was selected according to this procedure. Empty cells indicate lack of validation. Genes showing 0 value in the “Novelty” column are genes without records for KIRC in Pubmed, whereas genes showing 1 value are genes with records.
Third-round validation in the HPA
The protein expression levels of CASP4, P4HB and GABARAPL1 were then analyzed in HPA database. Fifty-nine histological section images for KIRC and normal kidney tissues were analyzed. The results showed that the protein expression levels of CASP4 have no significant difference between KIRCs and normal tissues (data not shown). Consistent to the above validation at mRNA level, the protein level of P4HB is significantly increased in KIRC tissues, and GABARAPL1 is decreased in KIRC tissues compared to that in normal tissues (Figure 2).
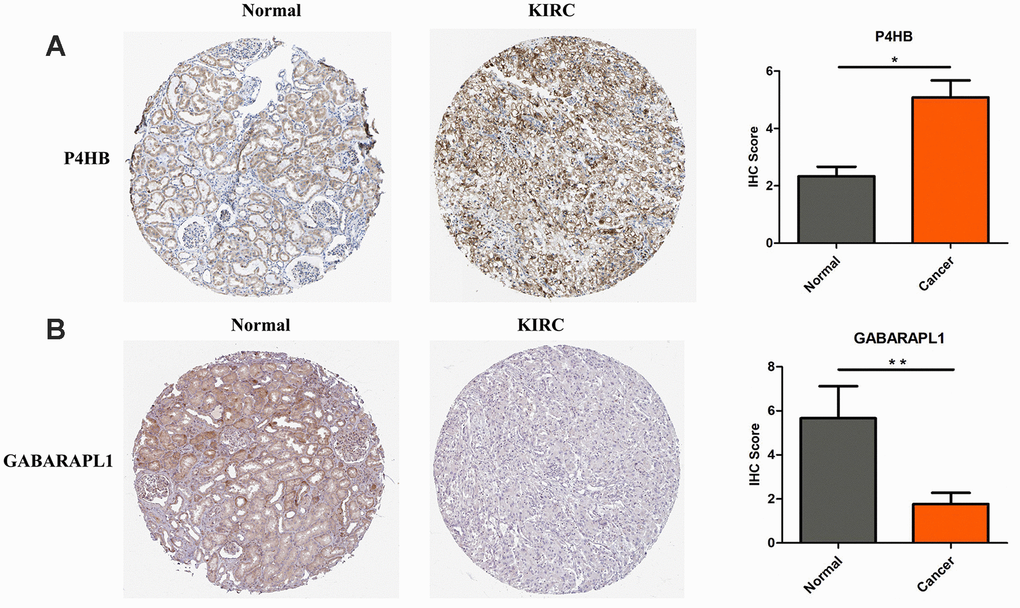
Figure 2. P4HB protein expression was significantly higher in KIRC tissues in comparison with normal tissues, while GABRAPL1 protein expression was significantly lower. Representive IHC images of P4HB (A) and GABRAPL1 (B) in normal (left) and KIRC (middle) tissues. Images were downloaded from HPA Database. Statistical analyses of the protein expression levels of P4HB and GABRAPL1 according to the information of normal and KIRC tissues (right). * p<0.05; ** p<0.01.
Experimental validation
According to the screening and validation steps as described above, the two genes P4HB and GABRAPL1 were considered as the novel candidates for KIRC biomarkers. Figure 3A and 3B showed the corresponding ROC curve of the two best candidates computed on the expression values reported in TCGA dataset. Both of them have AUC >0.9 and p < 0.0001, a very efficient ability to discriminate KIRCs from normal kidney.
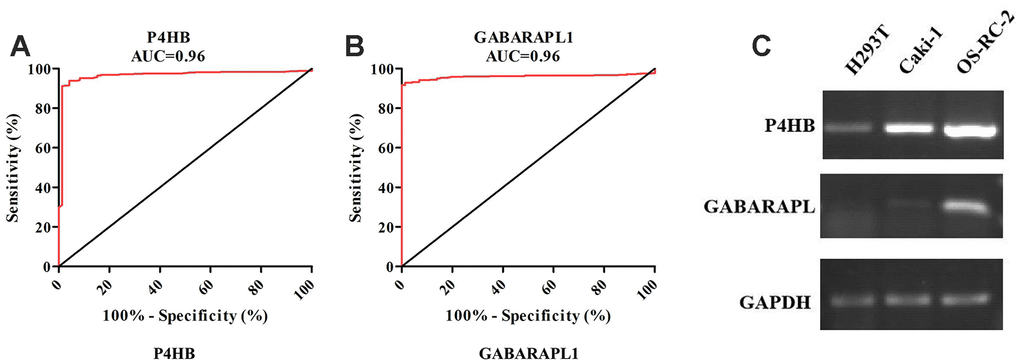
Figure 3. ROC analysis of P4HB and GABRAPL1 never related to KIRC diagnosis showing a very high ability to discriminate controls from KIRC samples validated in TCGA (A and B). The AUC is plotted as sensitivity% vs 100-specifificity%. The calculated AUC is reported in each case. The p value is <0.0001 in all cases; Detection of P4HB and GABARAPL1 mRNA expression level in H293T cell (normal kidney), OS-RC-2 and Caki-1 cell (cancer cells) by RT-PCR (C). GAPDH gene was used as the internal control. P4HB expression in cancer cells is clearly higher than normal kidney cell, while GABARAPL1 expression in cancer cells is clearly lower than normal kidney cell.
The two candidates were further validated in cell lines and tissues by RT-PCR. In contrast with normal renal epithelial cell line 293 (H293T), the mRNA level of P4HB was elevated in KIRC cell lines OR-SC-2 and Caki-1 (Figure 3C). The mRNA level of GABARAPL1 was also increased in KIRC cell line, which was inconsistent with above validation results. Hence, we just concentrated on P4HB for further study and analysis.
Prognostic significance
The prognostic significance of P4HB transcription expression was investigated based on survival data in 532 TCGA-KIRC patients. Both quarter and median are typical options to stratify cancer patients into high and low gene expression groups. Patients were split into “high”- or “low”-expressing groups by the quarter or median of P4HB expression values. The results showed that high expression of P4HB mRNA was related to significantly worse OS for KIRC patients (p<0.0001) when using either the median or quarter as the cut-off (Figure 4A and Supplementary Figure 1). Consequently, we determined the independent prognostic value of P4HB in KIRC. The association between P4HB expression and the clinic-pathological parameters of KIRC patients is shown in Table 2. Results showed that the high P4HB expression group has a significantly higher ratio of patients in advanced stages (III/IV) (71/61 vs. 136/262; p<0.0001), recurrence status (9/20 vs. 15/101; p=0.026), and death (64/69 vs. 111/288; p<0.0001) compared to the low P4HB expression group.
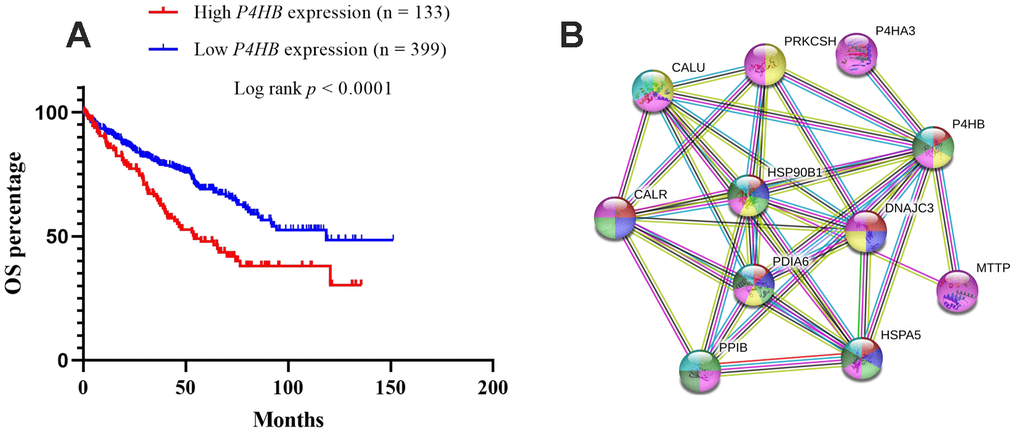
Figure 4. Kaplan-Meier survival analyses on differential P4HB expression groups with OS in the included 532 KIRC patients (A). The patients were stratified into high and low P4HB groups by quarter (25% upper vs 75% lower). Compared with low mRNA expression of P4HB, high P4HB expressions were significantly correlated with poor OS (p < 0.0001); The interaction network of P4HB protein with other proteins (B). CALR, HSP90B1, HSPA5, PPIB, MTTP, P4HA3, PDIA6, PRKCSH, and CALU physically/functionally connect P4HB. Note: The interaction network was obtained from STRING database.
Table 2. The association between P4HB expression and the demographic and clinicopathological parameters of patients with primary KIRC in the TCGA.
| Parameters | P4HB mRNA expressio | ||||
| High (n=133) | Low (n=399) | χ2 | p value | ||
| Age (Mean ± SD) | 60.97±11.97 | 60.45±12.20 | 0.670 | ||
| Gender | Female | 37 | 149 | 3.979 | 0.058 |
| Male | 96 | 250 | |||
| Clinical stage | I/II | 61 | 262 | 16.026 | <0.0001 |
| III/IV | 71 | 136 | |||
| Discrepancy | 1 | 1 | |||
| Smoking history | 1 | 10 | 35 | 1.000 | 0.056 |
| 2/3/4/5 | 10 | 31 | |||
| Null | 113 | 333 | |||
| Recurrence status | No | 20 | 101 | 5.505 | 0.026 |
| Yes | 9 | 15 | |||
| Null | 104 | 283 | |||
| Living status | Living | 69 | 288 | 18.623 | <0.0001 |
| Dead | 64 | 111 | |||
To explore whether P4HB high expression could be an independent predictor for KIRC patients, univariate and multivariate Cox regression analyses were conducted. In univariate Cox regression analyses, the higher stage and high P4HB mRNA expression exhibited unfavorable effects on OS (p<0.0001 and p<0.0001, respectively) (Table 3). In multivariate analysis, the higher stage and higher P4HB mRNA expression were independent unfavorable biomarkers of OS (p < 0.0001 and p=0.007, respectively) (Table 3). These results strongly indicated that P4HB could be an independent unfavorable prognostic biomarker in KIRC.
Table 3. Univariate and multivariate analysis of OS in patients with primary KIRC
| Parameters OS | Univariate analysis | Multivariate analysis | ||||||
| HR | 95%CI | p | HR | 95%CI | p | |||
| Age ≥60 vs <60 | 0.553 | 0.404 | 0.757 | <0.0001 | 0.642 | 0.468 | 0.830 | 0.006 |
| Female vs Male | 1.060 | 0.779 | 1.442 | 0.710 | ||||
| Clinical stage III/IV vs I/II | 3.865 | 2.820 | 5.297 | <0.0001 | 3.462 | 2.513 | 4.770 | <0.0001 |
| Smoking history 2/3/4/5 vs 1 | 0.778 | 0.254 | 2.383 | 0.661 | ||||
| P4HB expression High vs Low | 1.853 | 1.362 | 2.520 | <0.0001 | 1.518 | 1.109 | 2.076 | 0.007 |
To study the potential significance of P4HB in KIRC, we used GSEA to compare the high expression and low expression of P4HB in the TCGA dataset. The result indicated that several vital regulatory genes involved in pentose phosphate pathway, fructose and mannose metabolism, amino sugar and nucleotide sugar metabolism, galactose metabolism, intestinal immune network for IGA production, proteasome, N-glycan biosynthesis were enriched in cells with high P4HB expression (Supplementary Figure 2).
Interaction networks of P4HB
The STRING database was used to explore known and predicted protein–protein association with P4HB. As shown in Figure 4, the top 10 predicted functional partners were as follows: CALR (score = 0.999), HSP90B1 (score = 0.998), HSPA5 (score = 0.991), PPIB (score = 0.986), MTTP (score = 0.987), P4HA3 (score = 0.994), PDIA6 (score = 0.994), PRKCSH (score = 0.987), CALU (score = 0.991), and DNAJC3 (score = 0.986) (Figure 4B). Function enrichment analysis against gene ontology in this network indicated that for biological processes, this network is most enriched in response to endoplasmic reticulum (ER) stress, endoplasmic reticulum unfolded protein response, protein folding and post-translational protein modification, while for cellular components, it is significantly enriched in endoplasmic reticulum lumen, endoplasmic reticulum chaperone complex, and melanosome.
Discussion
Autophagy is important for sustaining cellular homeostasis through degrading and recycling organelles and proteins in eukaryotes [6]. This process can aid in the proliferation and survival of terminal cancers [6]. There is increasing evidence that targeting autophagy can promote the efficacy of many cancer therapies [15]. Recently, three ARGs including WIPI1, BAG1 and PEX3 were found to be melanoma diagnostic biomarkers with high AUC values, sensibility and specificity values [11]. Jonasch et al. had showed that autophagy possesses an anticancer role in KIRC tumorigenesis [16]. The monoallelic loss and/or mutation of autophagy-related gene ATG7 was found to be frequently associated with KIRC, and its low expression correlated with KIRC progression [16]. This implies that ARGs may be considered as potential co-targets in the KIRC therapeutic strategies. Nevertheless, an extensive analysis of ARGs’ gene and protein expression levels in human KIRC samples has not been reported before.
The current study represents the first systemic analysis of the expression levels of ARGs in KIRC tissues. 222 ARGs’ expression were analyzed in 1048 human KIRC samples by transcriptomic and proteomic data. According to a multi-step selection and validation procedure (Figure 1), P4HB was predicted to be a novel ARG biomarker in KIRC samples, which shows high specificity and sensitivity values (Figure 3A). P4HB (Prolyl 4-hydroxylase, beta polypeptide), also known as protein disulfide isomerase, is a multifunctional protein that catalyzes the formation and rearrangement of disulfide bonds. It can act as a molecular chaperone to refine misfolded proteins in response to endoplasmic reticulum (ER) stress. P4HB is significantly increased in several solid tumors including bladder cancer [17, 18], brain and CNS cancer, lung cancer, ovarian cancer [19], prostate cancer [20, 21]. Moreover, P4HB is associated with temozolomide (TMZ) resistance in GBM cells [22]. Recently, Zhou et al. had shown that P4HB knockdown can induce the apoptosis of human HT29 colon cancer cell through generating reactive oxygen species and inhibiting STAT3 signaling [23]. Yusenko et al. and Higgins et al. had demonstrated that the transcriptional expression of P4HB in KIRC specimens is significantly higher than that in the non-tumor tissues (fold changes were 2.937 and 2.435, respectively) [24, 25]. The current study confirmed that P4HB is highly expressed in KIRC compared with that in the corresponding normal tissue, and is also increased in two KIRC cells (Figure 3C). All the results above show that P4HB might be a novel diagnosis KIRC marker. The prognostic value of P4HB expression in glioma and gastric cancer had been studied [26, 27], however, its prognostic value in other cancers including kidney cancer is still unknown. In 2018, Zhou et al. showed that diffuse glioma patients with high P4HB expression has a poor OS, and may function in tumor progression of diffuse gliomas [26]. Zhao et al. demonstrated P4HB overexpression is correlated with TNM staging and peritoneum cavity metastasis in gastric cancer, and patients with high-expression of P4HB had a shorter disease-free survival (DFS) than those with low-expression [27]. In this study, we firstly found that patients with high P4HB mRNA expression has shorter overall survival than that patients with low P4HB mRNA expression by univariate and multivariate analysis, indicating that P4HB may be an independent unfavorable prognostic biomarker for OS in KIRC patients.
The ER is a cellular organelle responsible for secreted and membrane protein folding. ER stress and cell death typically through apoptosis were triggered by cellular stressors, for example, low glucose, hypoxia and deregulation of calcium homeostasis [28, 29]. Autophagy was found to be induced for cell survival after ER stress in renal proximal tubular cells [30]. PPI analysis of P4HB based on STRING database gained 10 top proteins (including CALR, HSP90B1, HSPA5, PPIB, MTTP, P4HA3, PDIA6, PRKCSH, CALU, DNAJC3) which can interact with P4HB. Functional enrichment analysis of these interaction partners showed enrichment in the “response to ER stress” and “ER unfolded protein response”. This indicates that P4HB may interact with ER stress related proteins such as HSP90B1, HSPA5 and PDIA6 to regulate autophagy in KIRC. Moreover, Hsp90 was found to be involved in the autophagy via regulating diverse signaling pathways, such as toll-like receptor (TLR)-mediated autophagy, Ulk1-mediated mitophagy, and chaperone-mediated autophagy (CMA) [31]. Cerezo et al. had demonstrated that by inhibiting HSPA5 specifically by a new compound HA15, the autophagy and apoptosis was induced, and the unfolded protein response (UPR) was increased [32]. Bai et al. had shown that PDIA6 is overexpressed in non-small cell lung cancer cells (NSCLC) and its overexpression can inhibit cisplatin-induced cell apoptosis and autophagy via the MAP4K1/JNK/c-Jun signaling pathway [33]. Hence, we assume that P4HB might regulate autophagy through these above signaling pathways in KIRC. Further studies are required to solve these remaining questions.
Conclusions
In summary, P4HB as an autophagy related gene is found to be significantly increased in KIRCs at both mRNA and protein levels, showing a high ability of diagnosis and prognosis. Therefore, the further study of the molecular mechanism of P4HB in tumorigenesis and progression of KIRC may offer additional opportunity of therapeutic target identification for KIRC patients.
Materials and Methods
222 ARGs (Autophagy-related genes) were collected from HADb (Human Autophagy Database, http://www.autophagy.lu/clustering/) at March 2019.
ARGs expression in different datasets
Selection phase: Expression of 222 ARG genes listed in Supplementary Table 1 was evaluated in The Cancer Genome Atlas (TCGA)-KIRC dataset (UCSC Xena, https://xena.ucsc.edu/) [34]. This dataset contains the mRNA expression data of 605 samples (533 KIRCs and 72 normal kidneys). ROC (receiver operating characteristic) analysis, the frequently-used method for binary assessment, was then performed to assess the effectiveness of the transcriptional expression of any interesting gene to discriminate KIRC from healthy samples. The computed area under the curve (AUC) value ranging from 0.5 to 1.0 indicates the discrimination ability from 50 to 100%.
First-round validation: Genes showing different expression levels between KIRC and normal kidney from above analysis, were then searched in NCBI Pubmed for to look for their any significance in KIRC, at the date of April 1, 2019. Search in “ALL fields” was performed to decrease false negative results. Genes with no any significance in KIRC in Pubmed were kept for next steps of investigations in another two independent datasets (GSE40435 and GSE53757) to validate their expression distinction between KIRC and normal kidney by using GEO2R. The gene expression profiling datasets (GSE40435 and GSE53757) were obtained from Gene Expression Omnibus (GEO, https://www.ncbi.nlm.nih.gov/gds). 101 pairs of KIRC and normal kidney specimens were enrolled in GSE40435 (platform: GPL10588 Illumina HumanHT-12 V4.0 expression beadchip) while 72 pairs of KIRC and normal ones were enrolled in GSE53757 (platform: GPL570 Affymetrix Human Genome U133 Plus 2.0 Array). Finally, three ARGs were found to be differentially expressed between KIRCs and normal kidneys in all the three cohorts of TCGA, GSE40435 and GSE53757.
Second-round validation: The three genes validated within the previous phases was verified using the Oncomine database (https://www.oncomine.org/resource/main.html) [35]. The Oncomine applies a combination of threshold values, namely, p value, fold change vs controls, and gene rank. Very strict thresholds were applied, namely, p≤0.0001, fold change ≥2, and gene rank top 10%.
Third-round validation: The 2 genes identified above step were then analyzed at the protein expression level in HPA (Human Protein Atlas, https://www.proteinatlas.org/) [36]. 48 KIRC tissues and 11 healthy kidney controls were retrieved. The IHC staining intensity in HPA database was scored from 0 to 2 (0, no staining; 1, weak staining; 2 strong staining). The staining extent was scored from 0 to 4 based on the percentage of immune-reactive tumor cells (0%, 1–5%, 6–25%, 26–75%, 76–100%). A score ranging from 0 to 8 was calculated by multiplying the staining extent score with the staining intensity score, resulting in a negative (0–4) staining or a positive (6–8) staining for each example.
Experimental Validation: The mRNA transcriptional level of P4HB and GABARAPL1 was assessed in normal renal epithelial cell 293 (H293T) and renal cancer cell (OS-RC-2 and Caki-1) stored in our lab. Total RNAs of these three cells were extracted with Trizol reagent (Thermo, MA, USA) following the manufacturer’s instructions. The purity and concentration of the RNA was detected by a NanoDrop 2000 spectrophotometer (NanoDrop Technologies, Thermo Fisher Scientific, USA). cDNA was obtained by using the kit (PrimeScript II 1st Strand cDNA Synthesis Kit, TaKaRa). An equal amount of total RNA was used as a template for RT-PCR (Reverse transcription polymerase chain reaction) with random primers. The RT-PCR products were visualized using a 1% agarose gel. The sequences of primers used were as follows: P4HB (Forward: 5-AGGCTGATGACATCGTGAACT-3; Reverse: 5-GGTATTTGGAGAACACGTCACTG-3); GABARAPL1 (Forward: 5-ATGAAGTTCCAGTACAAGGAGGA-3; Reverse: 5-GCTTTTGGAGCCTTCTCTACAAT-3); GAPDH (Forward: 5-ATGACAACTTTGGTATCGTGG-3; Reverse: 5-AGGGATGATGTTCTGGAGAG-3).
Protein-protein interactions (PPI) network analysis
STRING is a database of predicted functional interactions between proteins [37]. The STRING (https://string-db.org/) was carried out to obtain the functional protein–protein interactions (PPIs) of P4HB protein.
Gene set enrichment analysis (GSEA)
GSEA software was used to explore the subtype specific gene expression patterns and potential cellular pathways. By using TCGA_KIRC dataset, the high group and low group were divided based on the average of mRNA expression of P4HB because the mRNA expression obeys the normal distribution for its large sample. Nominal p < 0.05 and a false discovery rate (FDR) < 25% had considered to be significantly enriched for enriched gene sets analysis.
Statistical analysis
Statistical analysis was carried out using SPSS ver. 18 (SPSS Inc., Chicago, IL, USA). Chi-square test was used to assess the possible association between P4HB expression and clinic-pathological factors. Kaplan-Meier curves of OS were constructed in GraphPad Prism 8.0 by setting the quarter (upper 25% vs lower 75%) or median (upper 50% vs lower 50%) of P4HB expression as the cut-off, respectively. A log-rank test was performed to examine the significant differences between the low expression group and high expression group. Univariate and multivariate Cox regression models were performed to analyze the prognostic value of P4HB mRNA expression in terms of OS for KIRC. Factors with prognostic significance in the univariate analysis were contained in the subsequent multivariate analysis. P < 0.05 was regarded as statistically significant.
Supplementary Materials
Author Contributions
L.X., H.L., L.Z., and X.G. designed the experiments; L.X., H.L., L.Z., Y.D., X.M., L.G., F.M., H.D., Z.Y., and X.G. acquired data and analyze data; L.X., H.L., L.Z. and X.G. wrote draft of the manuscript; L.X., H.L., L.Z., L.G. and X.G made critical revision of the manuscript for intellectual content. All authors provided critical feedback and helped shape the research, analysis, and manuscript.
Conflicts of Interest
The authors declare that there is no conflict of interests. No animal or human studies were carried out by the authors for this article.
Funding
This study was supported by Innovative National Natural Science Foundation of China (No.81602362), Supporting grants of Henan University (No.2015YBZR048; No.B2015151), Yellow River Scholar Program (No.H2016012), and Program for Innovative Talents of Science and Technology in Henan Province (No. 18HASTIT048), Projects for College Students in Henan University (No. 201819002), China Postdoctoral Science Foundation (No.2017M62237) and Henan Postdoctoral Foundation (No. 001702052), Program for Science and Technology Development in Henan Province (No.162102310391, No.172102210187, No.192102310379, No.192102310350), Program for Scientific and Technological Research of Henan Education Department (No.14B520022), Program for Young Key Teacher of Henan Province (2016GGJS-214), Kaifeng Science and Technology Major Project (18ZD008), Supporting grant of Bioinformatics Center of Henan University (No.2018YLJC01).
References
- 1. Siegel RL, Miller KD, Jemal A. Cancer statistics, 2018. CA Cancer J Clin. 2018; 68:7–30. https://doi.org/10.3322/caac.21442 [PubMed]
- 2. Gremel G, Djureinovic D, Niinivirta M, Laird A, Ljungqvist O, Johannesson H, Bergman J, Edqvist PH, Navani S, Khan N, Patil T, Sivertsson Å, Uhlén M, et al. A systematic search strategy identifies cubilin as independent prognostic marker for renal cell carcinoma. BMC Cancer. 2017; 17:9. https://doi.org/10.1186/s12885-016-3030-6 [PubMed]
- 3. Majer W, Kluzek K, Bluyssen H, Wesoły J. Potential approaches and recent advances in biomarker discovery in clear-cell renal cell carcinoma. J Cancer. 2015; 6:1105–13. https://doi.org/10.7150/jca.12145 [PubMed]
- 4. Shibasaki N, Yamasaki T, Kanno T, Arakaki R, Sakamoto H, Utsunomiya N, Inoue T, Tsuruyama T, Nakamura E, Ogawa O, Kamba T. Role of IL13RA2 in sunitinib resistance in clear cell renal cell carcinoma. PLoS One. 2015; 10:e0130980. https://doi.org/10.1371/journal.pone.0130980 [PubMed]
- 5. Salama MF, Carroll B, Adada M, Pulkoski-Gross M, Hannun YA, Obeid LM. A novel role of sphingosine kinase-1 in the invasion and angiogenesis of VHL mutant clear cell renal cell carcinoma. FASEB J. 2015; 29:2803–13. https://doi.org/10.1096/fj.15-270413 [PubMed]
- 6. Mathew R, Karantza-Wadsworth V, White E. Role of autophagy in cancer. Nat Rev Cancer. 2007; 7:961–67. https://doi.org/10.1038/nrc2254 [PubMed]
- 7. Coutts AS, La Thangue NB. Regulation of actin nucleation and autophagosome formation. Cell Mol Life Sci. 2016; 73:3249–63. https://doi.org/10.1007/s00018-016-2224-z [PubMed]
- 8. Chen Y, Yu L. Autophagic lysosome reformation. Exp Cell Res. 2013; 319:142–46. https://doi.org/10.1016/j.yexcr.2012.09.004 [PubMed]
- 9. Graef M, Nunnari J. Mitochondria regulate autophagy by conserved signalling pathways. EMBO J. 2011; 30:2101–14. https://doi.org/10.1038/emboj.2011.104 [PubMed]
- 10. Morsch AL, Wisniewski E, Luciano TF, Comin VH, Silveira GB, Marques SO, Thirupathi A, Silveira Lock PC, De Souza CT. Cigarette smoke exposure induces ROS-mediated autophagy by regulating sestrin, AMPK, and mTOR level in mice. Redox Rep. 2019; 24:27–33. https://doi.org/10.1080/13510002.2019.1601448 [PubMed]
- 11. D’Arcangelo D, Giampietri C, Muscio M, Scatozza F, Facchiano F, Facchiano A. WIPI1, BAG1, and PEX3 Autophagy-Related Genes Are Relevant Melanoma Markers. Oxid Med Cell Longev. 2018; 2018:1471682. https://doi.org/10.1155/2018/1471682 [PubMed]
- 12. Levy JM, Towers CG, Thorburn A. Targeting autophagy in cancer. Nat Rev Cancer. 2017; 17:528–42. https://doi.org/10.1038/nrc.2017.53 [PubMed]
- 13. Rabinowitz JD, White E. Autophagy and metabolism. Science. 2010; 330:1344–48. https://doi.org/10.1126/science.1193497 [PubMed]
- 14. Singla M, Bhattacharyya S. Autophagy as a potential therapeutic target during epithelial to mesenchymal transition in renal cell carcinoma: an in vitro study. Biomed Pharmacother. 2017; 94:332–40. https://doi.org/10.1016/j.biopha.2017.07.070 [PubMed]
- 15. Yang ZJ, Chee CE, Huang S, Sinicrope FA. The role of autophagy in cancer: therapeutic implications. Mol Cancer Ther. 2011; 10:1533–41. https://doi.org/10.1158/1535-7163.MCT-11-0047 [PubMed]
- 16. Liu XD, Yao J, Tripathi DN, Ding Z, Xu Y, Sun M, Zhang J, Bai S, German P, Hoang A, Zhou L, Jonasch D, Zhang X, et al. Autophagy mediates HIF2α degradation and suppresses renal tumorigenesis. Oncogene. 2015; 34:2450–60. https://doi.org/10.1038/onc.2014.199 [PubMed]
- 17. Sanchez-Carbayo M, Socci ND, Lozano J, Saint F, Cordon-Cardo C. Defining molecular profiles of poor outcome in patients with invasive bladder cancer using oligonucleotide microarrays. J Clin Oncol. 2006; 24:778–89. https://doi.org/10.1200/JCO.2005.03.2375 [PubMed]
- 18. Dyrskjøt L, Kruhøffer M, Thykjaer T, Marcussen N, Jensen JL, Møller K, Ørntoft TF. Gene expression in the urinary bladder: a common carcinoma in situ gene expression signature exists disregarding histopathological classification. Cancer Res. 2004; 64:4040–48. https://doi.org/10.1158/0008-5472.CAN-03-3620 [PubMed]
- 19. Bonome T, Levine DA, Shih J, Randonovich M, Pise-Masison CA, Bogomolniy F, Ozbun L, Brady J, Barrett JC, Boyd J, Birrer MJ. A gene signature predicting for survival in suboptimally debulked patients with ovarian cancer. Cancer Res. 2008; 68:5478–86. https://doi.org/10.1158/0008-5472.CAN-07-6595 [PubMed]
- 20. Welsh JB, Sapinoso LM, Su AI, Kern SG, Wang-Rodriguez J, Moskaluk CA, Frierson HF
Jr , Hampton GM. Analysis of gene expression identifies candidate markers and pharmacological targets in prostate cancer. Cancer Res. 2001; 61:5974–8. [PubMed] - 21. Singh D, Febbo PG, Ross K, Jackson DG, Manola J, Ladd C, Tamayo P, Renshaw AA, D’Amico AV, Richie JP, Lander ES, Loda M, Kantoff PW, et al. Gene expression correlates of clinical prostate cancer behavior. Cancer Cell. 2002; 1:203–09. https://doi.org/10.1016/S1535-6108(02)00030-2 [PubMed]
- 22. Sun S, Lee D, Ho AS, Pu JK, Zhang XQ, Lee NP, Day PJ, Lui WM, Fung CF, Leung GK. Inhibition of prolyl 4-hydroxylase, beta polypeptide (P4HB) attenuates temozolomide resistance in malignant glioma via the endoplasmic reticulum stress response (ERSR) pathways. Neuro Oncol. 2013; 15:562–77. https://doi.org/10.1093/neuonc/not005 [PubMed]
- 23. Zhou Y, Yang J, Zhang Q, Xu Q, Lu L, Wang J, Xia W. P4HB knockdown induces human HT29 colon cancer cell apoptosis through the generation of reactive oxygen species and inactivation of STAT3 signaling. Mol Med Rep. 2019; 19:231–37. https://doi.org/10.3892/mmr.2018.9660 [PubMed]
- 24. Yusenko MV, Kuiper RP, Boethe T, Ljungberg B, van Kessel AG, Kovacs G. High-resolution DNA copy number and gene expression analyses distinguish chromophobe renal cell carcinomas and renal oncocytomas. BMC Cancer. 2009; 9:152. https://doi.org/10.1186/1471-2407-9-152 [PubMed]
- 25. Higgins JP, Shinghal R, Gill H, Reese JH, Terris M, Cohen RJ, Fero M, Pollack JR, van de Rijn M, Brooks JD. Gene expression patterns in renal cell carcinoma assessed by complementary DNA microarray. Am J Pathol. 2003; 162:925–32. https://doi.org/10.1016/S0002-9440(10)63887-4 [PubMed]
- 26. Zou H, Wen C, Peng Z, Shao YΥ, Hu L, Li S, Li C, Zhou HH. P4HB and PDIA3 are associated with tumor progression and therapeutic outcome of diffuse gliomas. Oncol Rep. 2018; 39:501–10. https://doi.org/10.3892/or.2017.6134 [PubMed]
- 27. Zhang J, Wu Y, Lin YH, Guo S, Ning PF, Zheng ZC, Wang Y, Zhao Y. Prognostic value of hypoxia-inducible factor-1 alpha and prolyl 4-hydroxylase beta polypeptide overexpression in gastric cancer. World J Gastroenterol. 2018; 24:2381–91. https://doi.org/10.3748/wjg.v24.i22.2381 [PubMed]
- 28. Yorimitsu T, Nair U, Yang Z, Klionsky DJ. Endoplasmic reticulum stress triggers autophagy. J Biol Chem. 2006; 281:30299–304. https://doi.org/10.1074/jbc.M607007200 [PubMed]
- 29. Ogata M, Hino S, Saito A, Morikawa K, Kondo S, Kanemoto S, Murakami T, Taniguchi M, Tanii I, Yoshinaga K, Shiosaka S, Hammarback JA, Urano F, Imaizumi K. Autophagy is activated for cell survival after endoplasmic reticulum stress. Mol Cell Biol. 2006; 26:9220–31. https://doi.org/10.1128/MCB.01453-06 [PubMed]
- 30. Kawakami T, Inagi R, Takano H, Sato S, Ingelfinger JR, Fujita T, Nangaku M. Endoplasmic reticulum stress induces autophagy in renal proximal tubular cells. Nephrol Dial Transplant. 2009; 24:2665–72. https://doi.org/10.1093/ndt/gfp215 [PubMed]
- 31. Wang B, Chen Z, Yu F, Chen Q, Tian Y, Ma S, Wang T, Liu X. Hsp90 regulates autophagy and plays a role in cancer therapy. Tumour Biol. 2016; 37:1–6. https://doi.org/10.1007/s13277-015-4142-3 [PubMed]
- 32. Cerezo M, Rocchi S. New anti-cancer molecules targeting HSPA5/BIP to induce endoplasmic reticulum stress, autophagy and apoptosis. Autophagy. 2017; 13:216–17. https://doi.org/10.1080/15548627.2016.1246107 [PubMed]
- 33. Bai Y, Liu X, Qi X, Liu X, Peng F, Li H, Fu H, Pei S, Chen L, Chi X, Zhang L, Zhu X, Song Y, et al. PDIA6 modulates apoptosis and autophagy of non-small cell lung cancer cells via the MAP4K1/JNK signaling pathway. EBioMedicine. 2019; 42:311–25. https://doi.org/10.1016/j.ebiom.2019.03.045 [PubMed]
- 34. Goldman M, Craft B, Swatloski T, Cline M, Morozova O, Diekhans M, Haussler D, Zhu J. The UCSC cancer genomics browser: update 2015. Nucleic Acids Res. 2015; 43:D812–17. https://doi.org/10.1093/nar/gku1073 [PubMed]
- 35. Rhodes DR, Yu J, Shanker K, Deshpande N, Varambally R, Ghosh D, Barrette T, Pandey A, Chinnaiyan AM. ONCOMINE: a cancer microarray database and integrated data-mining platform. Neoplasia. 2004; 6:1–6. https://doi.org/10.1016/S1476-5586(04)80047-2 [PubMed]
- 36. Pontén F, Jirström K, Uhlen M. The Human Protein Atlas—a tool for pathology. J Pathol. 2008; 216:387–93. https://doi.org/10.1002/path.2440 [PubMed]
- 37. Snel B, Lehmann G, Bork P, Huynen MA. STRING: a web-server to retrieve and display the repeatedly occurring neighbourhood of a gene. Nucleic Acids Res. 2000; 28:3442–44. https://doi.org/10.1093/nar/28.18.3442 [PubMed]