


Introduction
Hepatocellular carcinoma (HCC) is the most prevalent malignancy in the liver with a high incidence and mortality rate globally [1]. It is the fifth most commonly diagnosed cancer in men, the ninth in women, and the second leading cause of cancer death worldwide in 2012 [2]. HCC had a poor prognosis as the ratio of mortality to incidence is 0.95 [2] and the 5-year survival rate of advanced HCC was less than 5% [3]. The advanced fibrosis, mainly cirrhosis and hepatitis, caused by the Hepatitis B virus (HBV) and hepatitis C virus (HCV) were the most common cause for HCC [4–6]. Moreover, other factors such as alcohol consumption, obesity, aflatoxin exposure, and nonalcoholic fatty liver disease could also contribute to the development of HCC [4]. The understanding of the etiology and the molecular mechanisms of HCC leads to the development of drugs including sorafenib, regorafenib, nivolumab, and lenvatinib, which have been approved by the FDA in unresectable HCC treatment [7–10]. However, these drugs are not satisfying, due to the rapid drug resistance development and toxicities [9, 11–13]. Therefore, there is an urgent need for further understanding of the pathological mechanism of HCC and developing combination therapies that target different signaling mechanisms to reduce the drug resistance of HCC treatment.
The tumor microenvironment is an important part of tumor structure and function, and it plays a key role in the initiation and progression of carcinogenesis [14, 15]. Therefore, a better understanding of the molecular mechanism of the tumor microenvironment may provide new and valuable targets for cancer prevention, management, and risk assessment. As the major structural component of the tumor microenvironment, type IV collagen (Col IV) forms a ‘chicken-wire’ meshwork together with laminins, proteoglycans and entactin/nidogen. Also, Col IV has been found as a useful marker for evaluating liver preneoplastic lesions (fibrosis and cirrhosis), for its swift increase with fibrotic progression [16–18]. Moreover, the Col IV serum level was found to be a marker for evaluating primary and metastatic liver cancer, and recurrence risk of HCC after liver resection [19]. Recently, Col IV has shown the ability to promote liver metastasis of lung cancer by regulating the chemokine CCL7 signals [20, 21]. Therefore, Col IV may play a key role in hepatocarcinogenesis. However, the underlying mechanism still needs to be elucidated. Moreover, there are six Col IV isoforms, α1 (IV)-α6 (IV) which are encoded by COL4A1-COL4A6 genes, and the regulatory role of each isoform in HCC has yet to be discovered.
To address the above questions, the sequencing data of HCC were collected and analyzed from GEO and TCGA databases. The result showed that among the six Col IV isoforms, only COL4A1 and COL4A2 were significantly upregulated from liver preneoplastic lesions (cirrhosis and dysplasia) to HCC. Subsequently, the COL4A1 and COL4A2 network genomic alterations, biological function, and regulatory network in HCC were analyzed by using cBioPortal and LinkedOmics. Thus, this study revealed the expression and regulatory network of COL4A1 and COL4A2 in hepatocarcinogenesis, which might be novel targets for HCC diagnosis and treatment.
Results
Transcriptional levels of COL4As in the carcinogenic process from preneoplastic lesions (cirrhosis and dysplasia) to HCC
Six COL IV isoforms (COL4As) have been identified in mammalian cells. We initially assessed the transcriptional levels of COL4As in multiple HCC studies from GEO and TCGA databases. The mRNA expression levels of COL4A1 and COL4A2 were significantly upregulated in patients with liver cirrhosis and HCC tissues in two datasets. In the Mas Liver (GSE14323), COL4A1 was overexpressed in liver cirrhosis (fold change = 4.233, p = 2.78E-13) and HCC (fold change =3.759, p = 1.40E-12), while COL4A2 was higher expressed in liver cirrhosis (fold change = 2.487, p = 7.88E-14) and HCC (fold change =3.492, p = 1.01E-10) versus normal tissues (Figure 1A and Supplementary Figure 1B). In the Wurmbach liver (GSE6764), COL4A1 was increased in cirrhosis (fold change =2.997, p = 7.24E-6), liver cell dysplasia (fold change =2.140, p = 7.46E-6), and HCC (fold change =3.711, p = 1.16E-10). COL4A2 was also increased in cirrhosis (fold change =3.412, p = 2.02E-6), liver cell dysplasia (fold change =2.223, p = 1.35E-4), and HCC (fold change =3.154, p = 7.07E-7) compared to normal tissues (Supplementary Figure 1A and 1C). Apart from this, COL4A1 and COL4A2 were in the top 5% over-expression gene rank of liver cirrhosis and HCC in both datasets (Supplementary Figure 1B, 1C). In comparison, COL4A3-COL4A6 were not significantly changed in HCC versus normal tissues (Figure 1A and Supplementary Figure 1A). Further analysis of 371 HCC patients in TCGA consistently showed different effects of COL4A1-COL4A6 in hepatocarcinogenesis (Figure 1B). Moreover, the mRNA levels of both COL4A1 and COL4A2 were significantly increased in subgroups of HCC patients classified by ethnicity, gender, age, tumor grade, and disease stages compared to normal people (Figure 2A–2L). Additionally, the expressions of COL4A1 and COL4A2 in HCC and normal individuals were evaluated by immunohistochemistry staining (The Human Protein Atlas). The COL4A1 and COL4A2 proteins were more highly expressed in HCC tissues than in the normal liver tissues, and were located especially in the HCC tissue lacunar (Figure 3). Thus, COL4A1 and COL4A2 expressions may serve as potential diagnostic indicators in HCC.
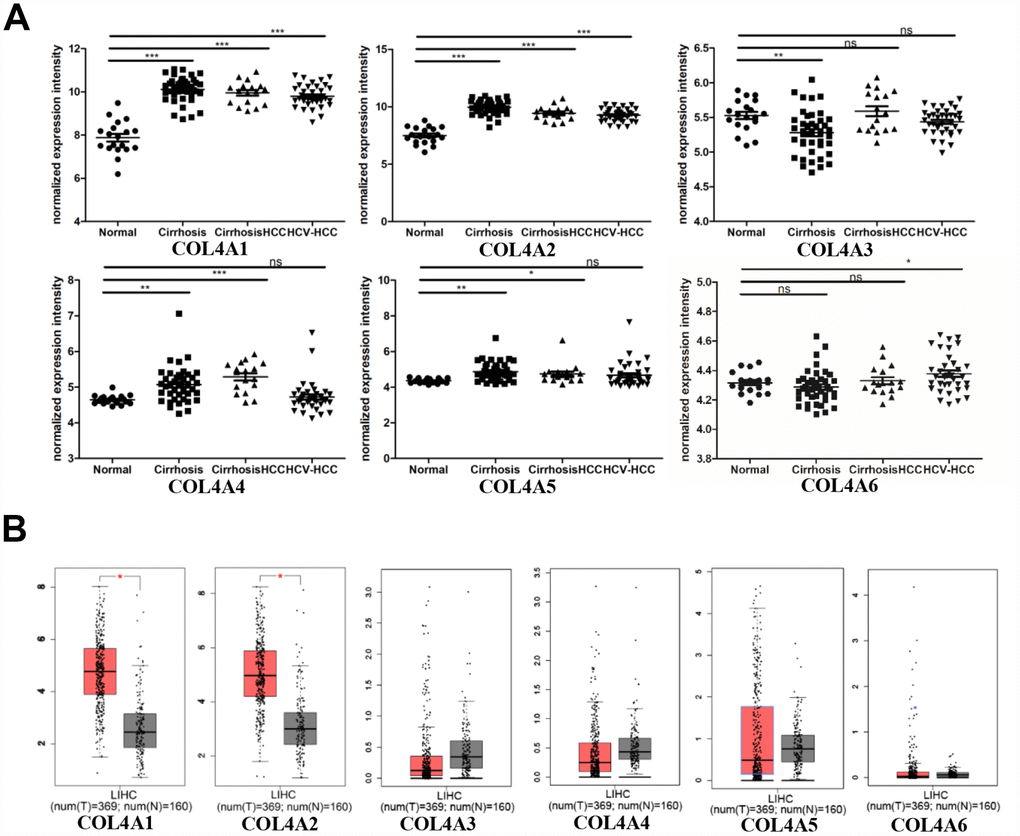
Figure 1. COL4As expression in hepatocellular carcinoma (HCC). The transcription levels of COL4A1 and COL4A2 were significantly upregulated in preneoplastic lesion (cirrhosis) and HCC tissues compared to normal tissues. (A) Dot plot showing the COL4As mRNA levels in GEO dataset (GSE14323). Normal (n=19): normal liver; Cirrhosis (n=41): HCV cirrhosis without HCC; Cirrhosis HCC (n=17): HCV cirrhosis with HCC; HCV-HCC (n=36): HCC by HCV infection. Data are mean ± SD. *, P < 0.05, **, P < 0.01, ***, P < 0.001 (Student’s t-test). (B) Box plot showing the COL4As mRNA levels in The Cancer Genome Atlas (TCGA) (GEPIA). Normal: n=160; Tumor: n=369. The significance test method was one-way ANOVA, using disease state (Tumor or Normal) as variable for calculating differential expression.
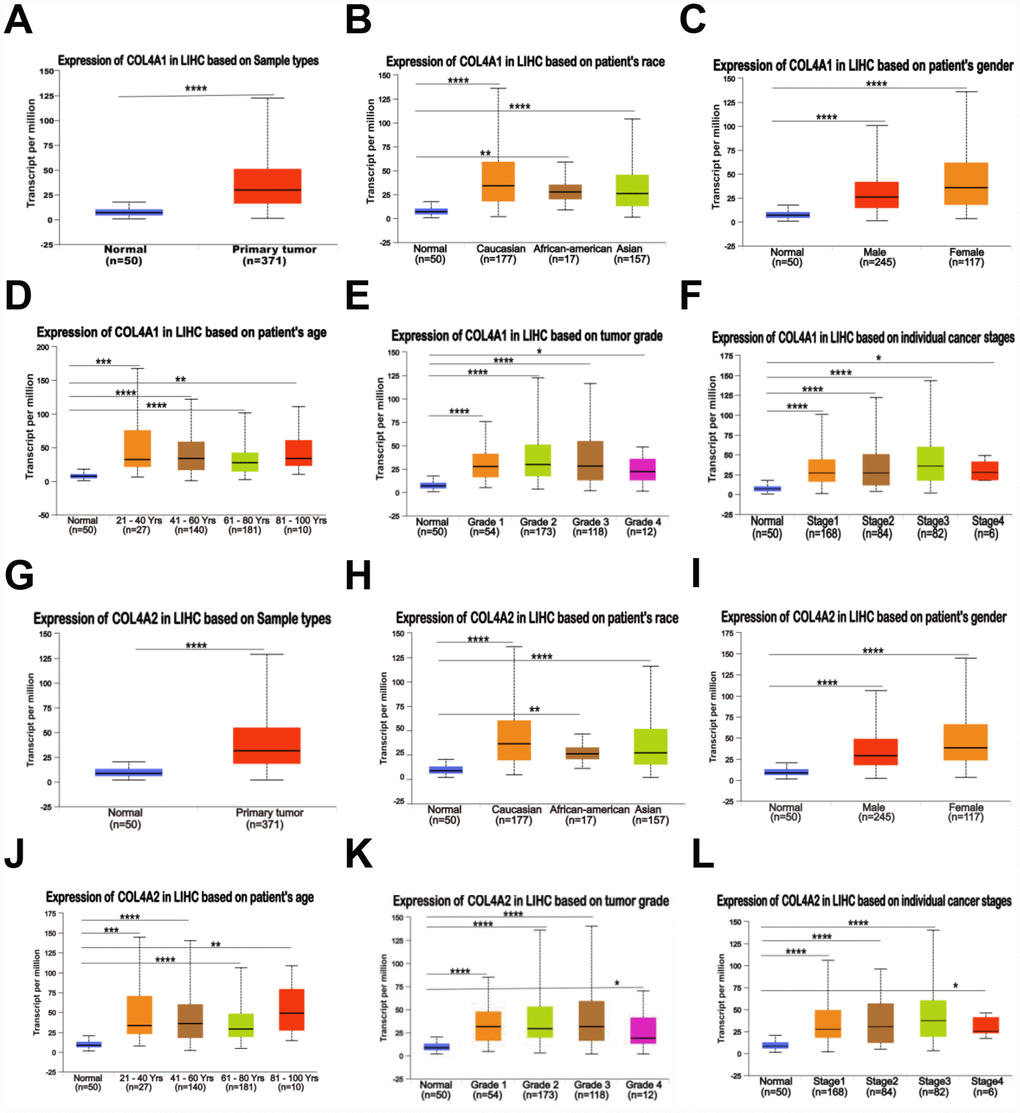
Figure 2. Relationship between the mRNA levels of COL4A1/2 and the clinic pathological features of patients with HCC, stratified based on ethnicity, gender, age, tumor grade, and disease stages (UALCAN). (A, G) Box plot showing the relative transcript level of COL4A1 and COL4A2 in normal and primary tumor (HCC) tissues. (B, H) Box plot showing the relative transcript level of COL4A1 and COL4A2 in normal samples of any ethnicity, and HCC tissues of Caucasian, African-American or Asian. (C, I) Box plot showing the relative transcript level of COL4A1 and COL4A2 in normal tissues of any gender, and HCC tissues of male or female. (D, J) Box plot showing the relative transcript level of COL4A1 and COL4A2 in healthy individuals of any age, and HCC tissues of 21–40, 41–60, 61–80, or 81–100 yrs. (E, K) Box plot showing the relative transcript level of COL4A1 and COL4A2 in normal tissues, and HCC tissues with grade 1, 2, 3 or 4. (F, L) Box plot showing the relative transcript level of COL4A1 and COL4A2 in normal tissues, and HCC tissues in stage 1, 2, 3 or 4. Data are mean ± SE. *, P < 0.05; **, P < 0.01; ***, P < 0.001, ****, P < 0.0001 (t-test).
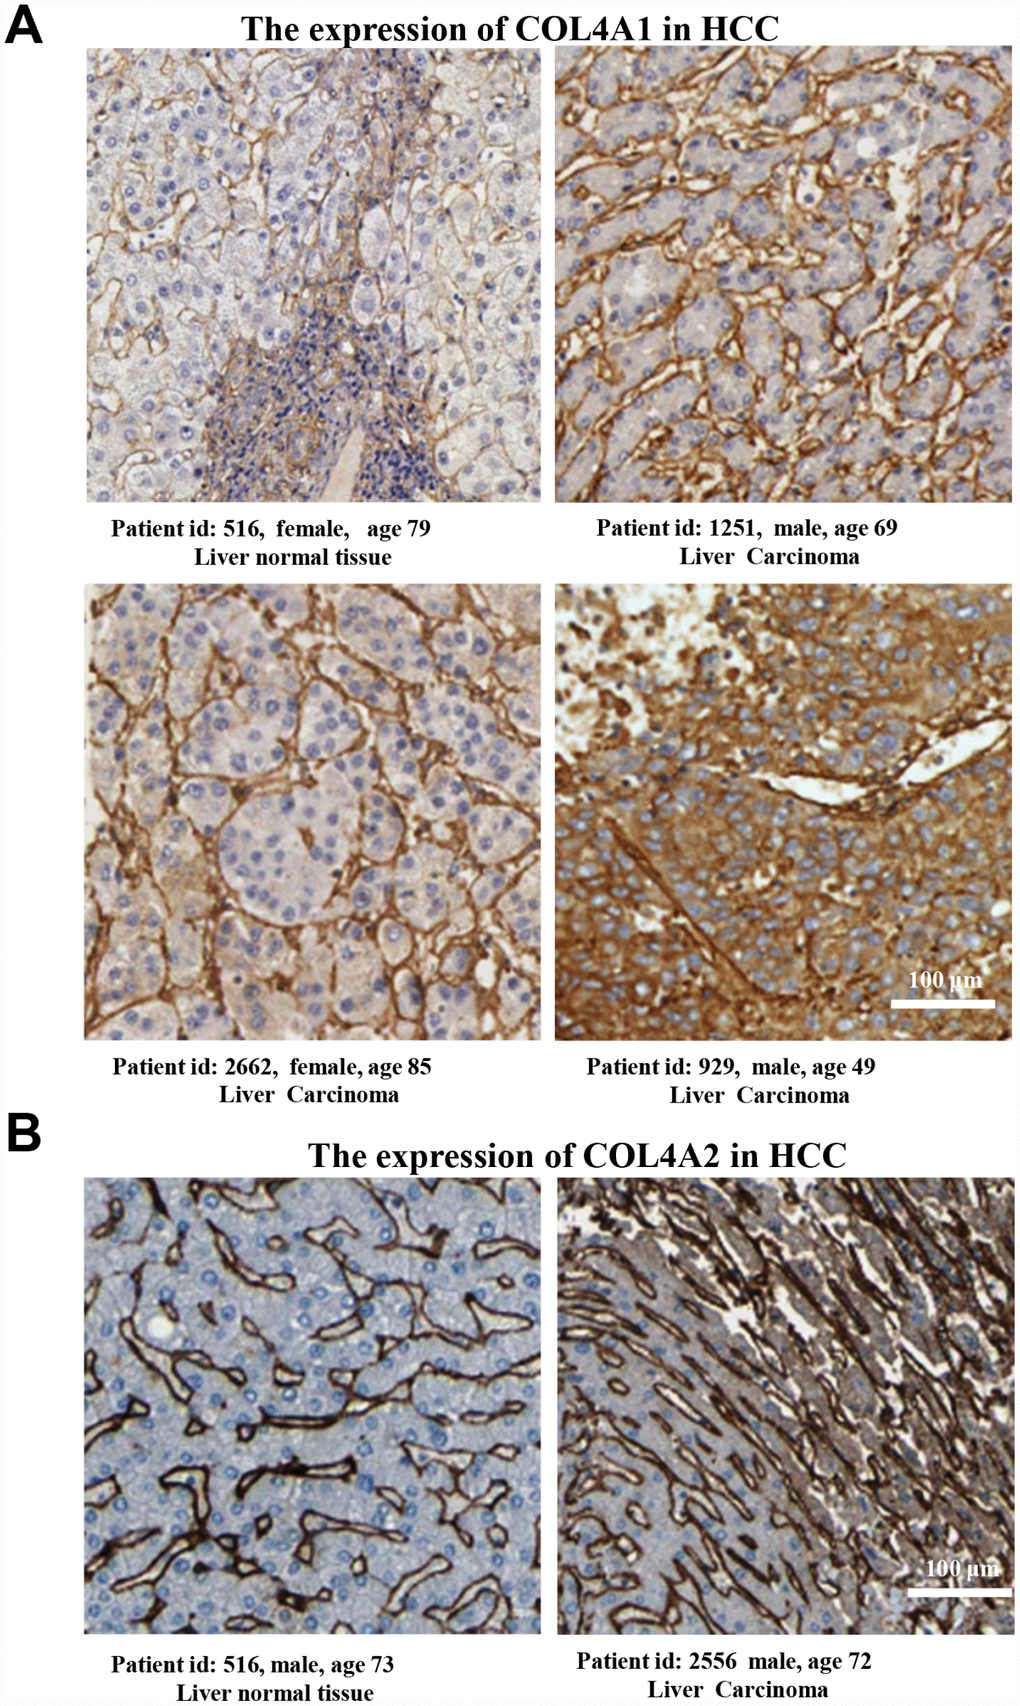
Figure 3. The COL4A1 and COL4A2 proteins were expressed higher in HCC tissues than in the normal liver tissue. (A–B) Immunohistochemistry staining showing the protein expression of COL4A1 (A) and COL4A2 (B) in liver normal tissues and liver carcinoma.
The cooperative genomic alterations of COL4A1 and COL4A2 networks in HCC
We then analyzed the cooperative genomic alterations of COL4A1 and COL4A2 networks by using cBioPortal for liver hepatocarcinoma (TCGA, provisional).
COL4A1 was altered in 41 of 371 (11%) HCC patients, and COL4A2 was altered in 37 of 371 (10%) HCC patients (Figure 4A). The genomic alterations included amplification (3.8% for both COL4A1 and COL4A2), mRNA up-regulation (5.6% for COL4A1, 4.6% for COL4A2), and mutation (2.1% for COL4A1, 1.6% for COL4A2) (Table 1). Thus, mRNA up-regulation and amplification are the most genomic alteration types for both COL4A1 and COL4A2 in HCC.
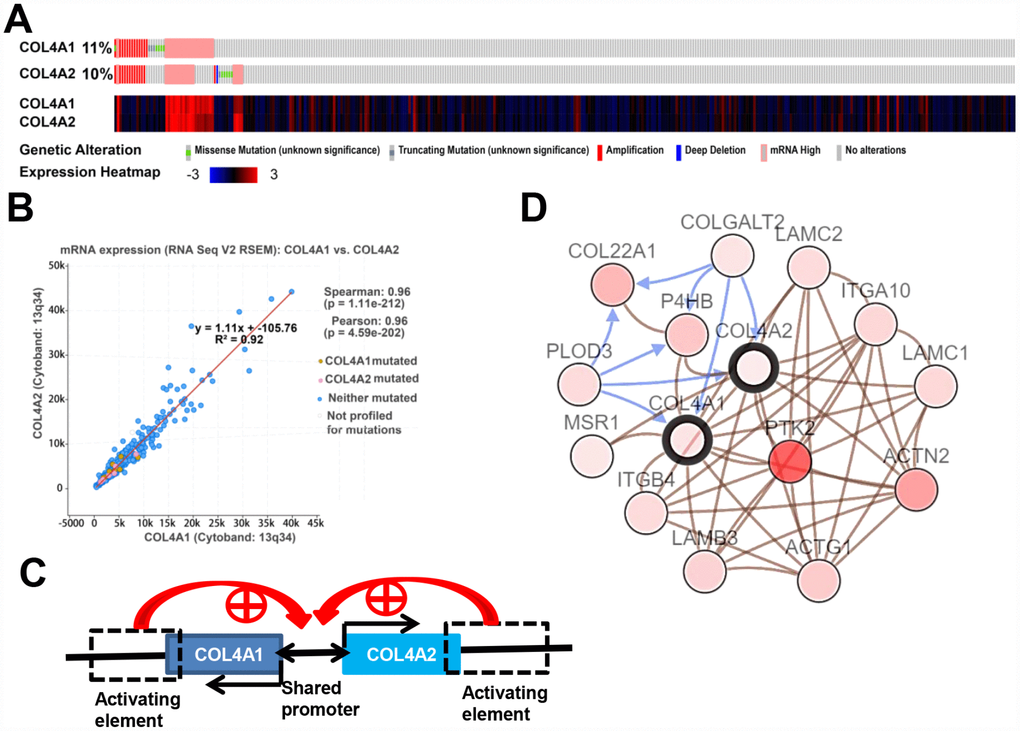
Figure 4. COL4A1 and COL4A2 genomic alterations, correlation, and signaling pathway in HCC (cBioPortal). (A) Heat map showing the genomic alteration types and expression of COL4A1 and COL4A2 in HCC tissues (n=371). The genomic alterations are highlighted in different markers. One column represents one individual. (B) Correlation analysis showing the significant positive correlation between COL4A1 and COL4A2. (C) COL4A1 and COL4A2 shared a bidirectional promoter, which was regulated by the downstream activating element. (D) Network showing the COL4A1/COL4A2 (with a bold border) and their neighboring genes with alteration frequencies >10% in HCC. PTK2 (in darker red) was the most frequently altered neighbor gene (46.4%). The brown connection shows that these genes are involved in the same biological component, such as a complex. The blue connection shows that the first gene causes a state change, such as a phosphorylation change, within the second gene.
Table 1. The most frequently altered neighbor genes of COL4A1 and COL4A2 in HCC(cBioPortal).
| Gene symbol | Amplification | Homozygous deletion | Up-regulation | Down-regulation | Mutation | Total alteration |
| COL4A1 | 3.80% | 0.00% | 5.60% | 0.00% | 2.10% | 11.00% |
| COL4A2 | 3.80% | 0.30% | 4.60% | 0.00% | 1.60% | 9.90% |
| PTK2 | 16.10% | 0.30% | 41.00% | 0.50% | 2.10% | 46.40% |
| ACTN2 | 8.60% | 0.00% | 15.50% | 0.00% | 1.60% | 24.10% |
| THBS3 | 13.70% | 0.00% | 13.70% | 0.00% | 1.60% | 20.10% |
| COL22A1 | 16.40% | 0.00% | 1.10% | 0.00% | 3.20% | 19.30% |
| P4HB | 6.20% | 0.30% | 11.80% | 0.30% | 0.30% | 15.80% |
| ACTG1 | 6.20% | 0.00% | 9.90% | 0.00% | 0.30% | 15.30% |
| LAMB3 | 9.40% | 0.00% | 3.50% | 0.00% | 1.90% | 13.90% |
| ITGA10 | 9.90% | 0.00% | 2.10% | 0.00% | 1.90% | 13.10% |
| LAMC1 | 9.10% | 0.00% | 3.20% | 0.00% | 1.60% | 12.90% |
| LAMC2 | 9.10% | 0.00% | 1.90% | 0.00% | 1.60% | 12.60% |
| ITGB4 | 5.60% | 0.00% | 4.80% | 0.00% | 2.40% | 12.60% |
| PLOD3 | 0.80% | 0.00% | 11.50% | 0.50% | 0.30% | 12.60% |
| COLGALT2 | 9.40% | 0.00% | 0.50% | 0.00% | 1.30% | 11.00% |
| MSR1 | 0.30% | 7.00% | 3.50% | 0.00% | 0.30% | 10.20% |
Moreover, the expression levels of COL4A1 and COL4A2 were highly correlated in 371 HCC patients (Figure 4A). Therefore, the correlation coefficient between COL4A1 and COL4A2 in HCC was calculated via cBioPortal. The results showed that COL4A1 was strongly correlated with COL4A2 (r = 0.96), possibly because they shared the same bidirectional promoter (Figure 4B, 4C).
Further, to identify the altered biological function of COL4A1 and COL4A2 networks in HCC, the most frequently altered neighbor genes (a total of 50) were collected and evaluated by analyzing GO and KEGG in the DAVID database. The COL4A1/COL4A2 neighboring genes with alteration frequencies >10% (16 out of a total of 94) in HCC were listed in Figure 4D and Table 1. Similar to COL4A1 and COL4A2, mRNA up-regulation and amplification were the main alteration types for a majority of these neighboring genes. The most frequently altered neighbor genes of COL4A1/ COL4A2 were PTK2 (46.4%), ACTN2 (24.1%), and THBS3 (20.1%). Analysis of significantly enriched GO results indicated that the proteins encoded by these genes localized primarily to the extracellular exosome, plasma membrane, and extracellular region (Figure 5A), where they were mainly involved in the extracellular matrix organization, cell adhesion, and integrin-mediated signaling pathway (Figure 5B). These proteins also served as structural constituents of protein binding, integrin binding, protein complex binding, and collagen binding (Figure 5C). Moreover, KEGG analysis showed enrichment in focal adhesion, PI3K-Akt pathway, ECM-receptor interaction, and pathway in cancer (Figure 5D). Thus, the biological interaction network of COL4A1 and COL4A2 alterations is involved in the extracellular matrix (ECM) and several ECM-receptor activated pathways.
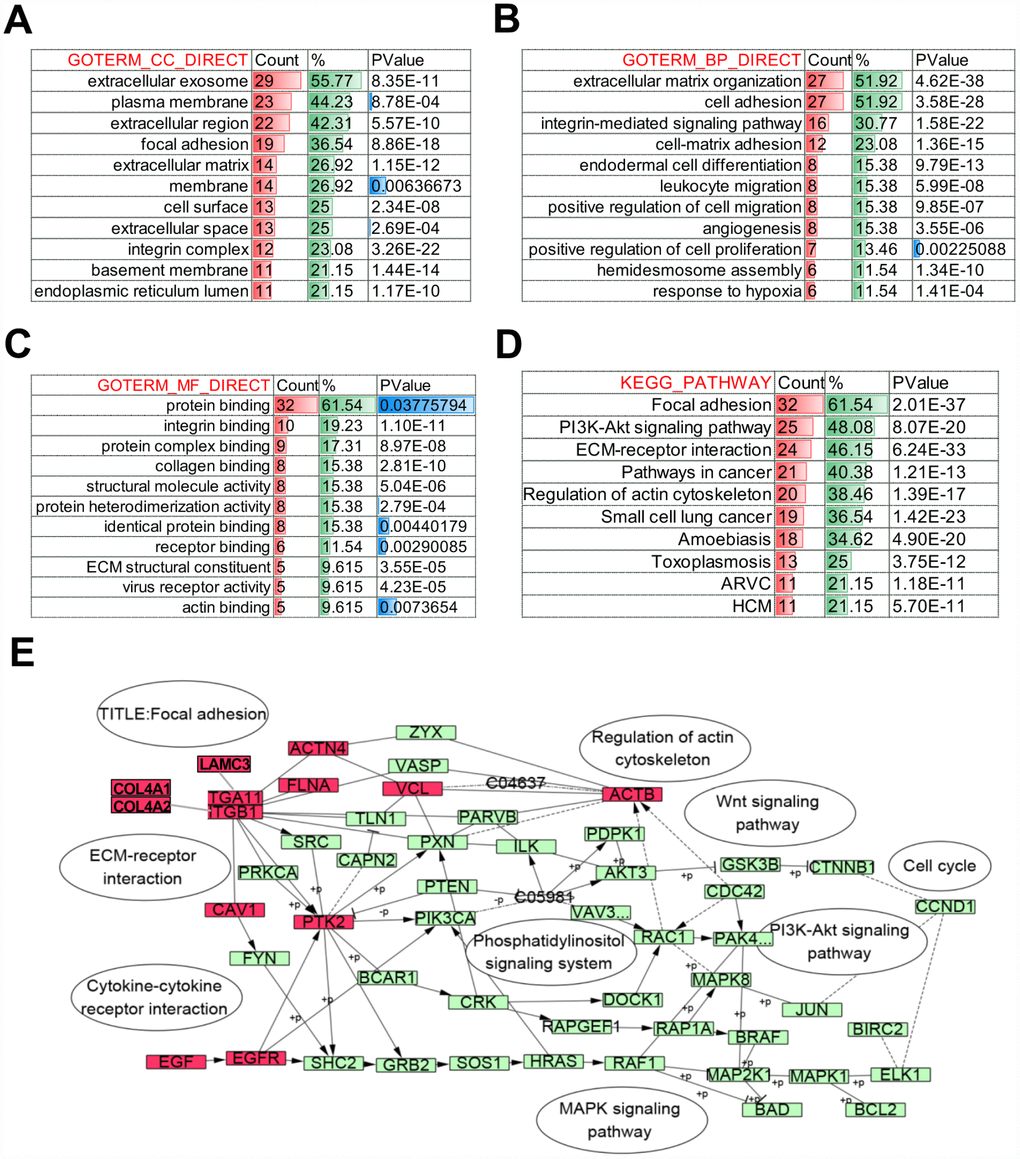
Figure 5. Biological function of COL4A1 and COL4A2 signaling network alterations in HCC. The histogram showing the biological function of the top 50 most frequently altered neighbor genes of COL4A1 and COL4A2 in HCC. (A) Cellular components. (B) Biological processes. (C) Molecular functions. (D) KEGG pathway analysis. (E) Network showing the KEGG pathway of Focal adhesion. The altered genes are highlight in red.
The biological function of COL4A1 and COL4A2 in HCC
Next, the genes which correlated with COL4A1 and COL4A2 and differentially expressed in HCC were collected and analyzed by LinkedOmics to further examine the biological function of COL4A1 and COL4A2 in HCC. COL4A1 displayed a positive correlation with 7111 genes and negative with 3128 genes; whereas 6680 genes were positively correlated with COL4A2, whereas 2714 genes in the opposite (FDR < 0.01, Figure 6A and 6B). The top 20 most positively and negatively correlated genes for COL4A1 and COL4A2 were exhibited in the heatmap (Figure 6C–6F). This result implied a similar effect of COL4A1 and COL4A2 in the transcriptome. Specially, COL4A1/COL4A2 were highly correlated with PXDN (r = 0.8937 / 0.8904) and SPARC (r = 0.8882 / 0.9124), reflecting significant changes in the extracellular matrix of HCC (Figure 6D). Further, GO term analysis indicated that the COL4A1 and COL4A2 correlated genes were located prominently in the extracellular matrix, membrane region, and cell-substrate junction, where they served as structural constituents in the extracellular matrix. They also involved in extracellular structure organization, angiogenesis, and cell-substrate adhesion (Figure 7A–7C). Moreover, KEGG analysis result showed that these genes took part in activating actin cytoskeleton, PI3K-Akt, cGMP-PKG, and cell adhesion pathway (Figure 7D). Thus, these results further demonstrated that the biological interaction network of COL4A1 and COL4A2 is involved in ECM-receptor activated pathways.
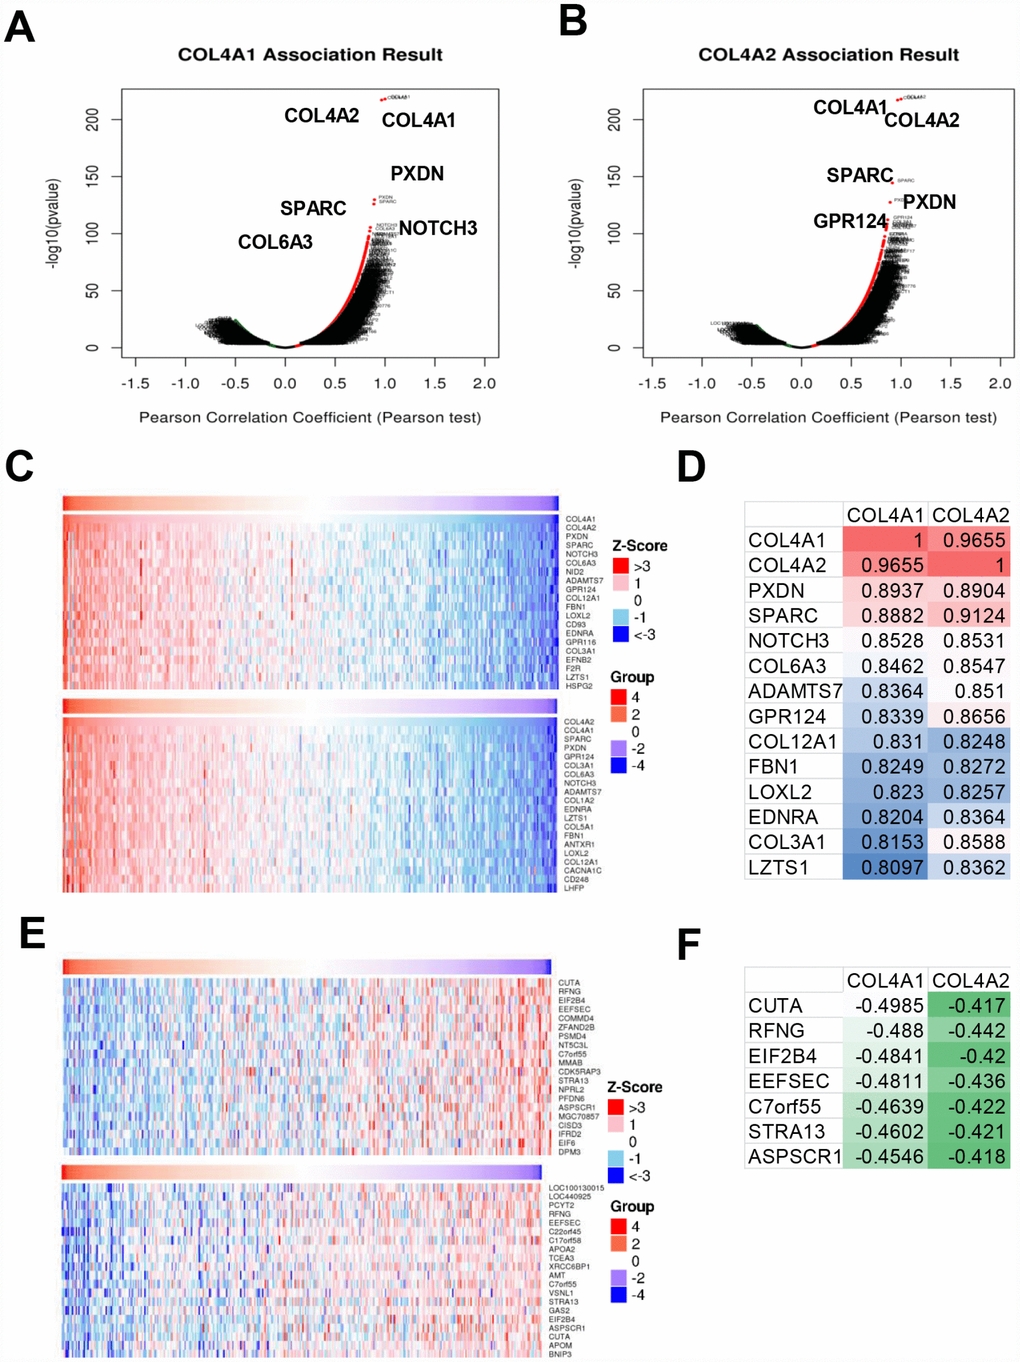
Figure 6. The genes correlated with COL4A1 and COL4A2 and differentially expressed in HCC (LinkedOmics). (A, B) The volcano plot showing the genes correlated with COL4A1 and COL4A2 and differentially expressed in HCC. (C, E) The heatmap showing the top 20 genes positively or negatively correlated with COL4A1 or COL4A2. (D, F) The same correlated genes for COL4A1 and COL4A2 in top 20 positively or negatively correlated genes.
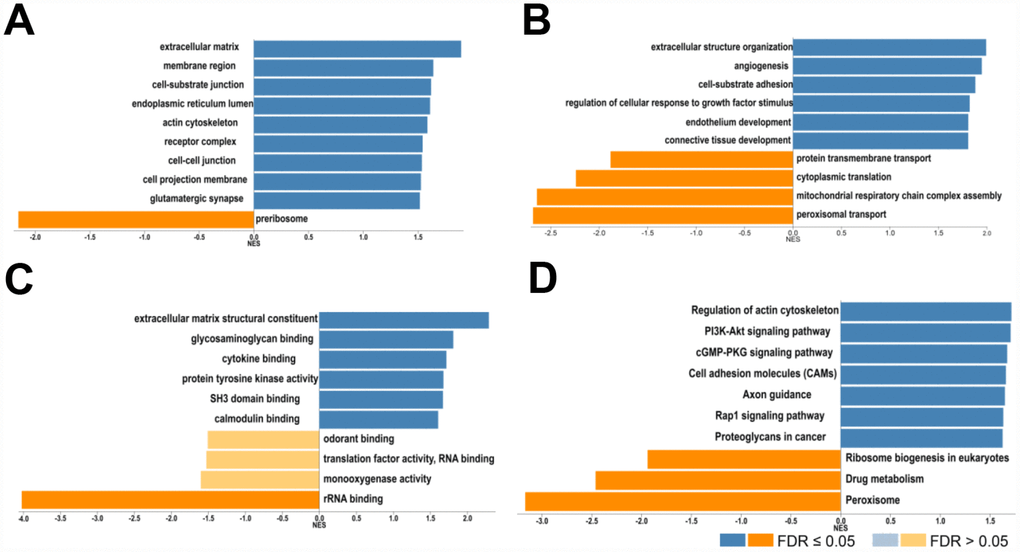
Figure 7. Biological function of COL4A1 and COL4A2 correlated genes in HCC. GO term and KEGG analysis by GSEA were conducted to clarify the biological function of COL4A1 and COL4A2 correlated genes. (A) Cellular components. (B) Biological processes. (C) Molecular functions. (D) KEGG pathway analysis. The column represents the Normalized Enrichment Score (NES), and the color of the column represents the FDR.
COL4A1 and COL4A2 network of kinase, miRNA, or transcription factor targets in HCC
To discover the specific targets network of COL4A1 and COL4A2 in HCC, the most correlated kinases, miRNA, and transcription factors were collected and analyzed by GSEA. As summarized in Table 2, for COL4A1 and COL4A2 in HCC, the most correlated kinase-targets network were PRKG1, PTK2B, MAPK7, and CAMK2A; the most correlated microRNA-targets network were MIR-140, MIR-204/MIR-211, MIR-7, MIR-23A/MIR-23B, MIR-130A/MIR-301/MIR-130B, MIR-519E, MIR-518C, and MIR-9; the most correlated transcript factor-target networks were V$SRF_Q6, V$RSRFC4_Q2, CTGYNNCTYTAA_UNKNOWN, V$MEF2_01, V$AML1_Q6, V$HEN1_01 and V$EVI1_04 (v7.4 TRANSFAC). The target genes of these transcript factors, kinases, and microRNAs in HCC were listed in Supplementary Table 1. Furthermore, KEGG analysis showed that these genes involved in pathways in cancer, PI3K-Akt signaling pathway, focal adhesion, MAPK signaling pathway, regulation of actin cytoskeleton, microRNAs in cancer, proteoglycans in cancer, and cGMP-PKG signaling pathway (Figure 8). Thus, COL4A1 and COL4A2 may involve in hepatocarcinogenesis by activating the above-mentioned transcript factors-target networks, the kinase-target networks, and the microRNA-target networks.
Table 2. The transcript factor, microRNA, and kinase regulatory network of COL4A1 and COL4A2 in HCC (LinkedOmics).
| Type | Gene Set | Size | Leading edge number | Enrichment Score (ES) | Normalized Enrichment Score (NES) | FDR |
| Transcript factor | V$SRF_Q6 | 231 | 94 | 0.55044 | 1.6597 | 0.00565 |
| V$RSRFC4_Q2 | 198 | 83 | 0.51218 | 1.5405 | 0.00674 | |
| CTGYNNCTYTAA_UNKNOWN | 81 | 30 | 0.5617 | 1.6209 | 0.00698 | |
| V$MEF2_01 | 134 | 51 | 0.54747 | 1.6178 | 0.00707 | |
| V$AML1_Q6 | 248 | 110 | 0.49829 | 1.5057 | 0.00736 | |
| V$HEN1_01 | 182 | 70 | 0.50724 | 1.5007 | 0.00739 | |
| V$EVI1_04 | 218 | 101 | 0.49922 | 1.5135 | 0.00746 | |
| GKCGCNNNNNNNTGAYG_UNKNOWN | 52 | 17 | -0.20659 | -1.2159 | 0.44429 | |
| V$PPARG_01 | 40 | 14 | -0.21978 | -0.96831 | 0.76375 | |
| microRNA | AAACCAC, MIR-140 | 100 | 55 | 0.51847 | 1.5346 | 0.01111 |
| ACCAAAG, MIR-9 | 458 | 210 | 0.49907 | 1.5234 | 0.01114 | |
| AAAGGGA, MIR-204, MIR-211 | 211 | 102 | 0.51606 | 1.5365 | 0.01145 | |
| GTCTTCC, MIR-7 | 149 | 61 | 0.51346 | 1.5208 | 0.01147 | |
| AATGTGA, MIR-23A, MIR-23B | 389 | 198 | 0.50816 | 1.5423 | 0.01158 | |
| TTGCACT, MIR-130A, MIR-301, MIR-130B | 365 | 220 | 0.5123 | 1.5697 | 0.01165 | |
| GGCACTT, MIR-519E | 113 | 72 | 0.5321 | 1.5528 | 0.01183 | |
| TCCAGAG, MIR-518C | 138 | 65 | 0.53458 | 1.5672 | 0.01187 | |
| Kinase | Kinase_PRKG1 | 30 | 15 | 0.7136 | 1.9136 | 0 |
| Kinase_PTK2B | 6 | 3 | 0.87902 | 1.7424 | 0.03337 | |
| Kinase_MAPK7 | 30 | 13 | 0.64928 | 1.7218 | 0.03881 | |
| Kinase_CAMK2A | 52 | 23 | 0.59432 | 1.6769 | 0.04961 |
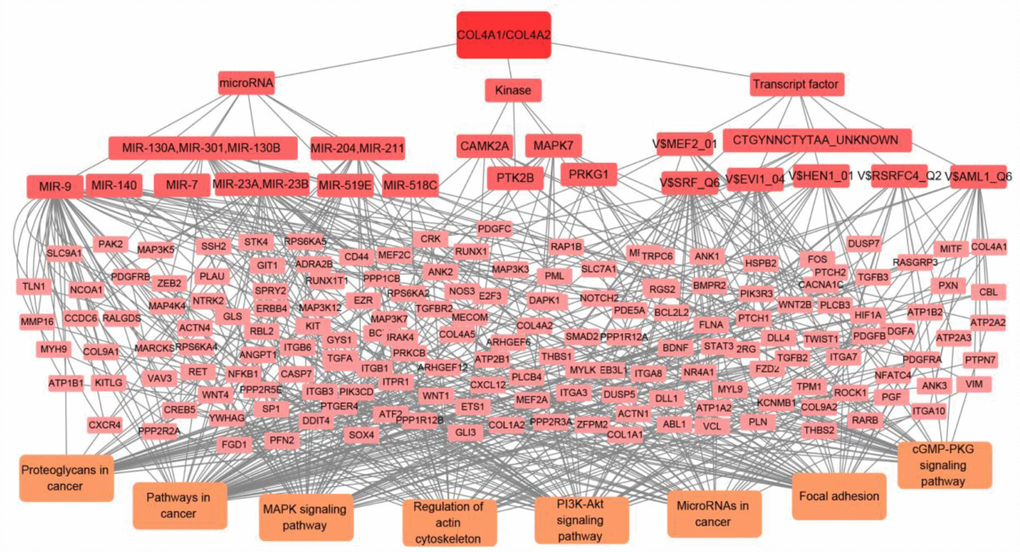
Figure 8. The transcript factor, microRNA, and kinase targets network of COL4A1 and COL4A2 in HCC (LinkedOmics). COL4A1 and COL4A2 may involve in hepatocarcinogenesis by regulating the transcript factors-target networks (V$SRF_Q6, V$RSRFC4_Q2, CTGYNNCTYTAA_UNKNOWN, V$MEF2_01, V$AML1_Q6, V$HEN1_01, V$EVI1_04), the kinase-target networks (PRKG1, PTK2B, MAPK7, and CAMK2A), and the microRNA-target networks (MIR-140, MIR-204/MIR-211, MIR-7, MIR-23A/MIR-23B, MIR-130A/MIR-301/MIR-130B, MIR-519E, MIR-518C, and MIR-9).
COL4A2 overexpression was positively correlated with shorter progression-free survival in HCC patients
To demonstrate the direct association of COL4A1 and COL4A2 with HCC, the COL4A1 and COL4A2 genomic altered or unaltered HCC patients were collected to evaluate their clinical features. As shown in Figure 9A, the mRNA level of COL4A1 and its associated genes, such as COL4A2, PXDN, and SPARC, were higher in the COL4A1-altered group than in the COL4A1-unaltered group. Similarly, the COL4A2 and its correlated genes, such as COL4A1, PXDN, and SPARC, were overexpressed in the COL4A2-altered patients compared to the COL4A2-unaltered patients (Figure 9B). Additionally, the overexpressed COL4A1 or COL4A2 could activate pathways in cancer including notch, platelet activation, cGMP-PKG, PI3K-Akt, focal adhesion, actin cytoskeleton, and ECM-receptor interaction (Figure 9C), which was consistent with the above biological pathways activated by COL4A1 and COL4A2 (Figure 7D). Furthermore, compared to the COL4A2-unaltered group, the COL4A2-altered group was significantly associated with shorter progression-free survival (P = 0.0271, Figure 9D). Therefore, it strongly suggested that COL4A2 overexpression might promote HCC progression after initial treatment.
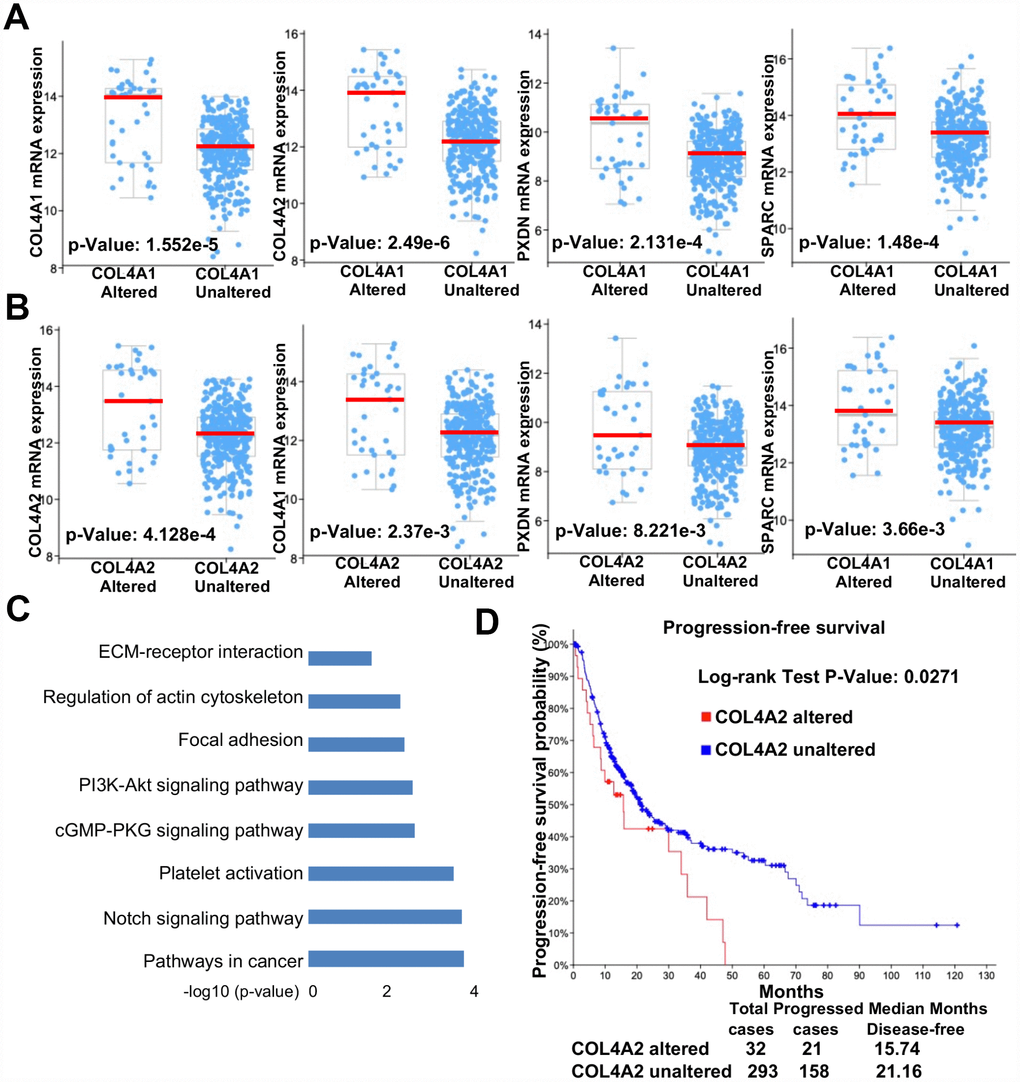
Figure 9. Collagen VI mutation and overexpression positively correlated with the progression-free survival of HCC patients. (A–B) Scatter plot comparison of mRNA levels (COL4A1, COL4A2, PXDN, and SPARC) between genomic altered and unaltered groups (A: COL4A1, B: COL4A2). (C) Column plot illustration of activated signaling pathways in COL4A1/COL4A2 genomic altered HCC samples. (D) Kaplan-Meier survival analysis of HCC patients with or without altered COL4A2 DNA sequences.
Discussion
Tumor microenvironment including inflammatory cells, stroma, and the extracellular matrix is critically important for tumor initiation and progression [15]. COL IV is a major structural component of the tumor microenvironment, which was steep increased during liver preneoplastic lesion, such as fibrosis and cirrhosis [18]. Thus, COL IV may involve initiating hepatocarcinogenesis. To investigate the different role of each isoform of COL IV in hepatocarcinogenesis, the HCC expression profile was analyzed using public sequencing data in GEO and TCGA, in which among the six COL IV isoforms, only COL4A1 and COL4A2 was significantly upregulated from preneoplastic lesions (cirrhosis and dysplasia) to HCC. Then, the COL4A1 and COL4A2 network genomic alterations, biological function, and regulatory network were further analyzed to provide deep insights into the function of COL IV in hepatocarcinogenesis.
In this study, the transcriptional levels of COL4A1 and COL4A2 in approximately 500 clinical samples from two GEO datasets and one TCGA dataset were significantly increased in cirrhosis and HCC. Both COL4A1 and COL4A2 were found in the top 5% of the over-expression-gene-rank of liver cirrhosis and the top 3% of HCC. Moreover, they were strongly correlated with clinic pathological features of patients with HCC based on ethnicity, gender, age, tumor grade, and disease stages. Thus, COL4A1 and COL4A2 may be helpful in the diagnose of HCC. As the detection of early HCC is still not systematic, more than 60% of patients are diagnosed with advanced HCC [22]. On the other hand, HCC patients have a better prognosis with a 5-year survival rate of more than 70% if diagnosed at an early stage [23]. Therefore, extensive researches have been conducted on identifying the makers for early HCC, many markers, such as AFP-L3 [24], DCP [25], GPC3 [26, 27], OPN [28], GP73 [29], SCCA [30], annexin A2 [31], suPAR [32], MDK [33], AXL [34], and TRX [35] were screened and undergoing further assessment in phase II studies. Considering the high heterogeneity in HCC patients, it is necessary to combine multiple markers for the detection of early HCC. Thus, combining the above markers with COL4A1 and COL4A2 will improve the diagnose reliability of early HCC.
The accumulation of cooperative genomic alterations enables the cells to grow rapidly and develop into tumors [36, 37]. The mRNA up-regulation and amplification were the most genomic alteration types for COL4A1/COL4A2 network genes in HCC. Among the altered genes, PTK2, encoding a cytoplasmic protein tyrosine kinase which was found concentrated in the focal adhesions, was the most frequently altered in HCC (46.4%). Upon activation, PTK2 regulates a variety of cellular functions, including cell adhesion, survival, proliferation, and migration [38–41]. Multiple studies demonstrated that PTK2 was overexpression and hyperphosphorylation in HCC [42–44], and the recent studies described that PTK2 activated CSC properties and tumorigenicity of HCC cells, leading to HCC recurrence and sorafenib resistance [44]. Therefore, COL4A1 and COL4A2 may mediate the initiation and progression of HCC by activating PTK2. Moreover, the functional analysis of altered genes of COL4A1/COL4A2 network showed that these genes involved in PI3K/Akt signaling pathway, which was the one classical downstream signal of PTK2. Accumulated evidence showed that overactivated PI3K/Akt/mTOR signaling pathway frequently occurs in HCC, which was highly correlated with poor prognosis and poor overall survival [45, 46]. All these evidences indicated that activation of PTK2-PI3K/Akt/mTOR pathway by COL4A1 and COL4A2 may contribute to hepatocarcinogenesis. This result was further confirmed by the significant correlation between COL4A2 overexpression and shorter progression-free survival. However, due to the present insufficient data between COL4A1 dominant mutations and progression-free survival, the correlation between COL4A1 and hepatocarcinogenesis needs to be explored further.
Furthermore, to get a systematic regulatory network of COL4A1/COL4A2 in HCC, the GSEA was conducted to identify the networks of transcription factors, kinases, and miRNAs. The above networks showed a strong correlation between COL4A1/COL4A2 and PI3K/Akt, cGMP-PKG, MAPK and other pathways in cancer. Among the networks of transcription factors, SRF was the most significant one with the highest enrichment score. Several studies indicated that dysregulated SRF could trigger HCC formation and progression, and SRF was also involved in EMT transition which led to sorafenib resistant in HCC [47–50]. Thus, COL4A1 and COL4A2 may involve in hepatocarcinogenesis via SRF transcript factor. Moreover, the other kinase networks including PRKG1, MAPK7, and CAMK2 were associated with COL4A1 and COL4A2, which may also be the potential targets for HCC treatment. However, the studies focused on the relationship between these kinases and HCC are still insufficient, and further studies are needed. Among the networks of miRNAs, MIR-9, MIR-7, MIR-140, and MIR-204 displayed a role in inhibiting the proliferation, progression, metastasis, sorafenib resistant of HCC [51–55], which may be promising targets for HCC management.
This study analyzed the expression and regulatory network of COL IV in hepatocarcinogenesis. Our finding suggested that the increased expression of COL4A1 and COL4A2 may involve in HCC initiation and progression by activating PTK2–PI3K/Akt signaling pathway. Last but not least, SRF, a tumor-associated transcription factor, may also involve in hepatocarcinogenesis induced by COL4A1 and COL4A2.
Materials and Methods
Ethics statement
This study was approved by the Academic Committee of No. 2 Affiliated Hospital, Guangzhou Medical University, Guangzhou, China, and the investigation was conducted according to Declaration of Helsinki principles. All the datasets were collected from the publishing literature, so all written informed consent was obtained.
Analysis of gene expression profile in preneoplastic lesions and HCC using GEO data
To analyze the expression profile of six COL IV isoforms in preneoplastic lesions and HCC, GEO datasets (access #: GSE14323 and GSE6764) were downloaded, evaluated, and normalized by different R packages, such as GEOquery and limma [56, 57]. The expression profile was mapped by Graphpad Prism [58]. The mRNA levels of six COL IV isoforms in preneoplastic lesions and HCC tissues were compared with that in the normal tissues, using the Student’s t-test to calculate p-value. P ˂ 0.05 were considered different significantly (*, P < 0.05, **, P < 0.01, ***, P < 0.001, ****, P < 0.0001).
Oncomine analysis
The mRNA expression fold change and Over-expression Gene Rank of COL4A1 and COL4A2 in HCC were analyzed by using the Oncomine database. Oncomine (www.oncomine.org) is the current world’s largest microarray database with 715 datasets (86733 samples) [59, 60]. The datasets used here were Mas Liver and Wurmbach Liver, which matched the GSE14323 and GSE6764 datasets in GEO [61, 62]. The mRNA levels of COL4A1 and COL4A2 in preneoplastic lesions (cirrhosis) and HCC tissues were compared with that in the normal tissues. Student’s t-test was performed to generate a p-value.
UALCAN analysis
The relationship between the mRNA levels of COL4A1/COL4A2 and the pathological clinic features of patients with HCC on ethnicity, gender, age, tumor grade, and disease stages was analyzed by using UALCAN. UALCAN (http://ualcan.path.uab.edu) is a web portal to facilitate gene expression analysis of cancer subgroups and cancer survival analyses [63]. The mRNA levels of COL4A1 and COL4A2 in HCC samples were compared with that in the normal tissues. P ˂ 0.05 were considered different significantly (*, P < 0.05, **, P < 0.01, ***, P < 0.001, ****, P < 0.0001). Student’s t-test was performed to generate a p-value.
GEPIA (Gene Expression Profiling Interactive Analysis) database
The expression profile of six COL IV isoforms in HCC was further examined by using GEPIA database. GEPIA web provides a server to analyze the gene expression profiling between cancer and normal tissues [64]. The significance test method was one-way ANOVA, using disease state (Tumor or Normal) as variable for calculating differential expression.
cBioPortal for cancer genomics
The cooperative genomic alterations of COL4A1 and COL4A2 network were analyzed by using cBioPortal. The cBioPortal for Cancer Genomics (http://cbioportal.org) is an integrated website for analyzing complex cancer genomics and clinical profiles [37]. The liver hepatocellular carcinoma (TCGA, Provisional) including 373 samples with mRNA data was selected for further analysis. The genomic profiles included mutations, putative CNA, and mRNA expression. The overview of COL4A1 and COL4A2 genomic alterations was shown in the tab OncoPrint. The 50 most frequently altered neighbor genes of COL4A1 and COL4A2 were visualized in the tab Network. GO and KEGG pathway of the 50 most frequently altered neighbor genes were analyzed by using DAVID [65].
LinkedOmics analysis
The correlated genes of COL4A1 and COL4A2 in HCC were analyzed by using LinkedOmics. The LinkedOmics database (http://www.linkedomics.org/login.php) is a web-portal for multi-omics and clinical data analysis of 32 cancer types with 11158 samples from TCGA [66]. The genes correlated with COL4A1 and COL4A2 in HCC were visualized in the LinkFinder module. The GO (CC, BP and MF), KEGG pathways, kinase-target, miRNA-target and transcription factor-target analysis of the COL4A1 and COL4A2 correlated genes were visualized in the LinkInterpreter module.
Author Contributions
Y-X.L. and JQ.C. performed literature searches and designed studies; YL.L. and XR.K. collected data, interpreted data, and wrote the paper; JY.Z., H.S., and Y.C. revised and polished the language.
Acknowledgments
Transcriptomic profiles of human HCC tissues (access #: GSE14323 and GSE6764) were downloaded from Gene Expression Omnibus. We appreciate Dr. Mas and Wurmbach’s team for sharing such valuable patient resources in the GEO database. We also appreciate researchers who have developed and maintained public databases such as Oncomine, cBioPortal, GEPIA, UALCAN, and LinkedOmics which will accelerate the understanding and treatment of human cancer.
Conflicts of Interest
The authors declare no conflicts of interest.
Funding
This work was supported by the National Nature Science Foundation of China (31871379), the National Basic Research Program of China 973 Program (2015CB964700), the Chinese Government Grant (ODCCC2268), the Guangdong Province Science and Technology Plan (2018A050506070, 2016B030301007, 2015B020230007, 2014B020225004), Guangzhou City Science and Technology Plan (201704020212), and the China Postdoctoral Science Fund (2018M643045).
References
- 1. McGlynn KA, London WT. The global epidemiology of hepatocellular carcinoma: present and future. Clin Liver Dis. 2011; 15:223–43, vii–x. vii-x. https://doi.org/10.1016/j.cld.2011.03.006 [PubMed]
- 2. Ferlay J, Soerjomataram I, Dikshit R, Eser S, Mathers C, Rebelo M, Parkin DM, Forman D, Bray F. Cancer incidence and mortality worldwide: sources, methods and major patterns in GLOBOCAN 2012. Int J Cancer. 2015; 136:E359–86. https://doi.org/10.1002/ijc.29210 [PubMed]
- 3. Louafi S, Boige V, Ducreux M, Bonyhay L, Mansourbakht T, de Baere T, Asnacios A, Hannoun L, Poynard T, Taïeb J. Gemcitabine plus oxaliplatin (GEMOX) in patients with advanced hepatocellular carcinoma (HCC): results of a phase II study. Cancer. 2007; 109:1384–90. https://doi.org/10.1002/cncr.22532 [PubMed]
- 4. Jindal A, Thadi A, Shailubhai K. Hepatocellular Carcinoma: Etiology and Current and Future Drugs. J Clin Exp Hepatol. 2019; 9:221–32. https://doi.org/10.1016/j.jceh.2019.01.004 [PubMed]
- 5. Komindr A, Praditphol N, Suphanpayak S, Sae-Eaw R, Nussati A, Tujinda S, Kongteeraphap P, Intaraksa S, Rukchampong R, Deesawat T. Correlation of HBV and HCV with CH, LC, HCC in liver biopsied tissue at Rajavithi Hospital. J Med Assoc Thai. 2005; 88:788–809. [PubMed]
- 6. Chen XP, Long X, Jia WL, Wu HJ, Zhao J, Liang HF, Laurence A, Zhu J, Dong D, Chen Y, Lin L, Xia YD, Li WY, et al. Viral integration drives multifocal HCC during the occult HBV infection. J Exp Clin Cancer Res. 2019; 38:261. https://doi.org/10.1186/s13046-019-1273-1 [PubMed]
- 7. Bruix J, Sherman M, and American Association for the Study of Liver Diseases. Management of hepatocellular carcinoma: an update. Hepatology. 2011; 53:1020–22. https://doi.org/10.1002/hep.24199 [PubMed]
- 8. Bruix J, Tak WY, Gasbarrini A, Santoro A, Colombo M, Lim HY, Mazzaferro V, Wiest R, Reig M, Wagner A, Bolondi L. Regorafenib as second-line therapy for intermediate or advanced hepatocellular carcinoma: multicentre, open-label, phase II safety study. Eur J Cancer. 2013; 49:3412–19. https://doi.org/10.1016/j.ejca.2013.05.028 [PubMed]
- 9. El-Khoueiry AB, Sangro B, Yau T, Crocenzi TS, Kudo M, Hsu C, Kim TY, Choo SP, Trojan J, Welling TH
3rd , Meyer T, Kang YK, Yeo W, et al. Nivolumab in patients with advanced hepatocellular carcinoma (CheckMate 040): an open-label, non-comparative, phase 1/2 dose escalation and expansion trial. Lancet. 2017; 389:2492–502. https://doi.org/10.1016/S0140-6736(17)31046-2 [PubMed] - 10. Yamamoto Y, Matsui J, Matsushima T, Obaishi H, Miyazaki K, Nakamura K, Tohyama O, Semba T, Yamaguchi A, Hoshi SS, Mimura F, Haneda T, Fukuda Y, et al. Lenvatinib, an angiogenesis inhibitor targeting VEGFR/FGFR, shows broad antitumor activity in human tumor xenograft models associated with microvessel density and pericyte coverage. Vasc Cell. 2014; 6:18. https://doi.org/10.1186/2045-824X-6-18 [PubMed]
- 11. Zhai B, Sun XY. Mechanisms of resistance to sorafenib and the corresponding strategies in hepatocellular carcinoma. World J Hepatol. 2013; 5:345–52. https://doi.org/10.4254/wjh.v5.i7.345 [PubMed]
- 12. Kim K, Jha R, Prins PA, Wang H, Chacha M, Hartley ML, He AR. Regorafenib in advanced hepatocellular carcinoma (HCC): considerations for treatment. Cancer Chemother Pharmacol. 2017; 80:945–54. https://doi.org/10.1007/s00280-017-3431-5 [PubMed]
- 13. Personeni N, Pressiani T, Rimassa L. Lenvatinib for the treatment of unresectable hepatocellular carcinoma: evidence to date. J Hepatocell Carcinoma. 2019; 6:31–39. https://doi.org/10.2147/JHC.S168953 [PubMed]
- 14. Liotta LA, Kohn EC. The microenvironment of the tumour-host interface. Nature. 2001; 411:375–79. https://doi.org/10.1038/35077241 [PubMed]
- 15. Mbeunkui F, Johann DJ
Jr . Cancer and the tumor microenvironment: a review of an essential relationship. Cancer Chemother Pharmacol. 2009; 63:571–82. https://doi.org/10.1007/s00280-008-0881-9 [PubMed] - 16. Mak KM, Chen LL, Lee TF. Codistribution of collagen type IV and laminin in liver fibrosis of elderly cadavers: immunohistochemical marker of perisinusoidal basement membrane formation. Anat Rec (Hoboken). 2013; 296:953–64. https://doi.org/10.1002/ar.22694 [PubMed]
- 17. Rojkind M, Ponce-Noyola P. The extracellular matrix of the liver. Coll Relat Res. 1982; 2:151–75. https://doi.org/10.1016/S0174-173X(82)80031-9 [PubMed]
- 18. Chen W, Rock JB, Yearsley MM, Ferrell LD, Frankel WL. Different collagen types show distinct rates of increase from early to late stages of hepatitis C-related liver fibrosis. Hum Pathol. 2014; 45:160–65. https://doi.org/10.1016/j.humpath.2013.08.015 [PubMed]
- 19. Kawai S, Kubo S, Tsukamoto T, Tanaka H, Shuto T, Yamamoto T, Hirohashi K, Kinoshita H. Serum concentration of type IV collagen 7S domain as a marker for increased risk of recurrence after liver resection for hepatocellular carcinoma. Dig Surg. 2003; 20:201–08. https://doi.org/10.1159/000070386 [PubMed]
- 20. Vaniotis G, Rayes RF, Qi S, Milette S, Wang N, Perrino S, Bourdeau F, Nyström H, He Y, Lamarche-Vane N, Brodt P. Collagen IV-conveyed signals can regulate chemokine production and promote liver metastasis. Oncogene. 2018; 37:3790–805. https://doi.org/10.1038/s41388-018-0242-z [PubMed]
- 21. Burnier JV, Wang N, Michel RP, Hassanain M, Li S, Lu Y, Metrakos P, Antecka E, Burnier MN, Ponton A, Gallinger S, Brodt P. Type IV collagen-initiated signals provide survival and growth cues required for liver metastasis. Oncogene. 2011; 30:3766–83. https://doi.org/10.1038/onc.2011.89 [PubMed]
- 22. Altekruse SF, McGlynn KA, Reichman ME. Hepatocellular carcinoma incidence, mortality, and survival trends in the United States from 1975 to 2005. J Clin Oncol. 2009; 27:1485–91. https://doi.org/10.1200/JCO.2008.20.7753 [PubMed]
- 23. Takayama T, Makuuchi M, Kojiro M, Lauwers GY, Adams RB, Wilson SR, Jang HJ, Charnsangavej C, Taouli B. Early hepatocellular carcinoma: pathology, imaging, and therapy. Ann Surg Oncol. 2008; 15:972–78. https://doi.org/10.1245/s10434-007-9685-0 [PubMed]
- 24. Li D, Mallory T, Satomura S. AFP-L3: a new generation of tumor marker for hepatocellular carcinoma. Clin Chim Acta. 2001; 313:15–19. https://doi.org/10.1016/S0009-8981(01)00644-1 [PubMed]
- 25. Naraki T, Kohno N, Saito H, Fujimoto Y, Ohhira M, Morita T, Kohgo Y. gamma-Carboxyglutamic acid content of hepatocellular carcinoma-associated des-gamma-carboxy prothrombin. Biochim Biophys Acta. 2002; 1586:287–98. https://doi.org/10.1016/S0925-4439(01)00107-7 [PubMed]
- 26. Haruyama Y, Kataoka H. Glypican-3 is a prognostic factor and an immunotherapeutic target in hepatocellular carcinoma. World J Gastroenterol. 2016; 22:275–83. https://doi.org/10.3748/wjg.v22.i1.275 [PubMed]
- 27. Zhou F, Shang W, Yu X, Tian J. Glypican-3: A promising biomarker for hepatocellular carcinoma diagnosis and treatment. Med Res Rev. 2018; 38:741–67. https://doi.org/10.1002/med.21455 [PubMed]
- 28. Shang S, Plymoth A, Ge S, Feng Z, Rosen HR, Sangrajrang S, Hainaut P, Marrero JA, Beretta L. Identification of osteopontin as a novel marker for early hepatocellular carcinoma. Hepatology. 2012; 55:483–90. https://doi.org/10.1002/hep.24703 [PubMed]
- 29. Kladney RD, Cui X, Bulla GA, Brunt EM, Fimmel CJ. Expression of GP73, a resident Golgi membrane protein, in viral and nonviral liver disease. Hepatology. 2002; 35:1431–40. https://doi.org/10.1053/jhep.2002.32525 [PubMed]
- 30. Giannelli G, Fransvea E, Trerotoli P, Beaugrand M, Marinosci F, Lupo L, Nkontchou G, Dentico P, Antonaci S. Clinical validation of combined serological biomarkers for improved hepatocellular carcinoma diagnosis in 961 patients. Clin Chim Acta. 2007; 383:147–52. https://doi.org/10.1016/j.cca.2007.05.014 [PubMed]
- 31. Sun Y, Gao G, Cai J, Wang Y, Qu X, He L, Liu F, Zhang Y, Lin K, Ma S, Yang X, Qian X, Zhao X. Annexin A2 is a discriminative serological candidate in early hepatocellular carcinoma. Carcinogenesis. 2013; 34:595–604. https://doi.org/10.1093/carcin/bgs372 [PubMed]
- 32. Chounta A, Ellinas C, Tzanetakou V, Pliarhopoulou F, Mplani V, Oikonomou A, Leventogiannis K, Giamarellos-Bourboulis EJ. Serum soluble urokinase plasminogen activator receptor as a screening test for the early diagnosis of hepatocellular carcinoma. Liver Int. 2015; 35:601–07. https://doi.org/10.1111/liv.12705 [PubMed]
- 33. Shaheen KY, Abdel-Mageed AI, Safwat E, AlBreedy AM. The value of serum midkine level in diagnosis of hepatocellular carcinoma. Int J Hepatol. 2015; 2015:146389. https://doi.org/10.1155/2015/146389 [PubMed]
- 34. Reichl P, Fang M, Starlinger P, Staufer K, Nenutil R, Muller P, Greplova K, Valik D, Dooley S, Brostjan C, Gruenberger T, Shen J, Man K, et al. Multicenter analysis of soluble Axl reveals diagnostic value for very early stage hepatocellular carcinoma. Int J Cancer. 2015; 137:385–94. https://doi.org/10.1002/ijc.29394 [PubMed]
- 35. Li J, Cheng ZJ, Liu Y, Yan ZL, Wang K, Wu D, Wan XY, Xia Y, Lau WY, Wu MC, Shen F. Serum thioredoxin is a diagnostic marker for hepatocellular carcinoma. Oncotarget. 2015; 6:9551–63. https://doi.org/10.18632/oncotarget.3314 [PubMed]
- 36. Zhang H, Deng Y, Zhang Y, Ping Y, Zhao H, Pang L, Zhang X, Wang L, Xu C, Xiao Y, Li X. Cooperative genomic alteration network reveals molecular classification across 12 major cancer types. Nucleic Acids Res. 2017; 45:567–82. https://doi.org/10.1093/nar/gkw1087 [PubMed]
- 37. Gao J, Aksoy BA, Dogrusoz U, Dresdner G, Gross B, Sumer SO, Sun Y, Jacobsen A, Sinha R, Larsson E, Cerami E, Sander C, Schultz N. Integrative analysis of complex cancer genomics and clinical profiles using the cBioPortal. Sci Signal. 2013; 6:pl1. https://doi.org/10.1126/scisignal.2004088 [PubMed]
- 38. Batista S, Maniati E, Reynolds LE, Tavora B, Lees DM, Fernandez I, Elia G, Casanovas O, Lo Celso C, Hagemann T, Hodivala-Dilke K. Haematopoietic focal adhesion kinase deficiency alters haematopoietic homeostasis to drive tumour metastasis. Nat Commun. 2014; 5:5054. https://doi.org/10.1038/ncomms6054 [PubMed]
- 39. Zhao X, Guan JL. Focal adhesion kinase and its signaling pathways in cell migration and angiogenesis. Adv Drug Deliv Rev. 2011; 63:610–15. https://doi.org/10.1016/j.addr.2010.11.001 [PubMed]
- 40. Itoh S, Maeda T, Shimada M, Aishima S, Shirabe K, Tanaka S, Maehara Y. Role of expression of focal adhesion kinase in progression of hepatocellular carcinoma. Clin Cancer Res. 2004; 10:2812–17. https://doi.org/10.1158/1078-0432.CCR-1046-03 [PubMed]
- 41. Sulzmaier FJ, Jean C, Schlaepfer DD. FAK in cancer: mechanistic findings and clinical applications. Nat Rev Cancer. 2014; 14:598–610. https://doi.org/10.1038/nrc3792 [PubMed]
- 42. Williams KE, Bundred NJ, Landberg G, Clarke RB, Farnie G. Focal adhesion kinase and Wnt signaling regulate human ductal carcinoma in situ stem cell activity and response to radiotherapy. Stem Cells. 2015; 33:327–41. https://doi.org/10.1002/stem.1843 [PubMed]
- 43. Chen JS, Huang XH, Wang Q, Chen XL, Fu XH, Tan HX, Zhang LJ, Li W, Bi J. FAK is involved in invasion and metastasis of hepatocellular carcinoma. Clin Exp Metastasis. 2010; 27:71–82. https://doi.org/10.1007/s10585-010-9306-3 [PubMed]
- 44. Fan Z, Duan J, Wang L, Xiao S, Li L, Yan X, Yao W, Wu L, Zhang S, Zhang Y, Li Y, Zhu X, Hu Y, et al. PTK2 promotes cancer stem cell traits in hepatocellular carcinoma by activating Wnt/β-catenin signaling. Cancer Lett. 2019; 450:132–43. https://doi.org/10.1016/j.canlet.2019.02.040 [PubMed]
- 45. Villanueva A, Chiang DY, Newell P, Peix J, Thung S, Alsinet C, Tovar V, Roayaie S, Minguez B, Sole M, Battiston C, Van Laarhoven S, Fiel MI, et al. Pivotal role of mTOR signaling in hepatocellular carcinoma. Gastroenterology. 2008; 135:1972–83, 1983.e1-11. https://doi.org/10.1053/j.gastro.2008.08.008 [PubMed]
- 46. Zhou L, Huang Y, Li J, Wang Z. The mTOR pathway is associated with the poor prognosis of human hepatocellular carcinoma. Med Oncol. 2010; 27:255–61. https://doi.org/10.1007/s12032-009-9201-4 [PubMed]
- 47. Ohrnberger S, Thavamani A, Braeuning A, Lipka DB, Kirilov M, Geffers R, Autenrieth SE, Römer M, Zell A, Bonin M, Schwarz M, Schütz G, Schirmacher P, et al. Dysregulated serum response factor triggers formation of hepatocellular carcinoma. Hepatology. 2015; 61:979–89. https://doi.org/10.1002/hep.27539 [PubMed]
- 48. Kwon CY, Kim KR, Choi HN, Chung MJ, Noh SJ, Kim DG, Kang MJ, Lee DG, Moon WS. The role of serum response factor in hepatocellular carcinoma: implications for disease progression. Int J Oncol. 2010; 37:837–44. https://doi.org/10.3892/ijo_00000734 [PubMed]
- 49. Park MY, Kim KR, Park HS, Park BH, Choi HN, Jang KY, Chung MJ, Kang MJ, Lee DG, Moon WS. Expression of the serum response factor in hepatocellular carcinoma: implications for epithelial-mesenchymal transition. Int J Oncol. 2007; 31:1309–15. https://doi.org/10.3892/ijo.31.6.1309 [PubMed]
- 50. Bae JS, Noh SJ, Kim KM, Jang KY, Chung MJ, Kim DG, Moon WS. Serum response factor induces epithelial to mesenchymal transition with resistance to sorafenib in hepatocellular carcinoma. Int J Oncol. 2014; 44:129–36. https://doi.org/10.3892/ijo.2013.2154 [PubMed]
- 51. Wu W, Liu S, Liang Y, Zhou Z, Liu X. MiR-7 inhibits progression of hepatocarcinoma by targeting KLF-4 and promises a novel diagnostic biomarker. Cancer Cell Int. 2017; 17:31. https://doi.org/10.1186/s12935-017-0386-x [PubMed]
- 52. Han Y, Liu Y, Fu X, Zhang Q, Huang H, Zhang C, Li W, Zhang J. miR-9 inhibits the metastatic ability of hepatocellular carcinoma via targeting beta galactoside alpha-2,6-sialyltransferase 1. J Physiol Biochem. 2018; 74:491–501. https://doi.org/10.1007/s13105-018-0642-0 [PubMed]
- 53. Li J, Zhao J, Wang H, Li X, Liu A, Qin Q, Li B. MicroRNA-140-3p enhances the sensitivity of hepatocellular carcinoma cells to sorafenib by targeting pregnenolone X receptor. OncoTargets Ther. 2018; 11:5885–94. https://doi.org/10.2147/OTT.S179509 [PubMed]
- 54. Chu Y, Jiang M, Du F, Chen D, Ye T, Xu B, Li X, Wang W, Qiu Z, Liu H, Nie Y, Liang J, Fan D. miR-204-5p suppresses hepatocellular cancer proliferation by regulating homeoprotein SIX1 expression. FEBS Open Bio. 2018; 8:189–200. https://doi.org/10.1002/2211-5463.12363 [PubMed]
- 55. Jiang G, Wen L, Zheng H, Jian Z, Deng W. miR-204-5p targeting SIRT1 regulates hepatocellular carcinoma progression. Cell Biochem Funct. 2016; 34:505–10. https://doi.org/10.1002/cbf.3223 [PubMed]
- 56. Davis S, Meltzer PS. GEOquery: a bridge between the Gene Expression Omnibus (GEO) and BioConductor. Bioinformatics. 2007; 23:1846–47. https://doi.org/10.1093/bioinformatics/btm254 [PubMed]
- 57. Diboun I, Wernisch L, Orengo CA, Koltzenburg M. Microarray analysis after RNA amplification can detect pronounced differences in gene expression using limma. BMC Genomics. 2006; 7:252. https://doi.org/10.1186/1471-2164-7-252 [PubMed]
- 58. Berkman SJ, Roscoe EM, Bourret JC. Comparing self-directed methods for training staff to create graphs using Graphpad Prism. J Appl Behav Anal. 2019; 52:188–204. https://doi.org/10.1002/jaba.522 [PubMed]
- 59. Rhodes DR, Kalyana-Sundaram S, Mahavisno V, Varambally R, Yu J, Briggs BB, Barrette TR, Anstet MJ, Kincead-Beal C, Kulkarni P, Varambally S, Ghosh D, Chinnaiyan AM. Oncomine 3.0: genes, pathways, and networks in a collection of 18,000 cancer gene expression profiles. Neoplasia. 2007; 9:166–80. https://doi.org/10.1593/neo.07112 [PubMed]
- 60. Rhodes DR, Yu J, Shanker K, Deshpande N, Varambally R, Ghosh D, Barrette T, Pandey A, Chinnaiyan AM. ONCOMINE: a cancer microarray database and integrated data-mining platform. Neoplasia. 2004; 6:1–6. https://doi.org/10.1016/S1476-5586(04)80047-2 [PubMed]
- 61. Mas VR, Maluf DG, Archer KJ, Yanek K, Kong X, Kulik L, Freise CE, Olthoff KM, Ghobrial RM, McIver P, Fisher R. Genes involved in viral carcinogenesis and tumor initiation in hepatitis C virus-induced hepatocellular carcinoma. Mol Med. 2009; 15:85–94. https://doi.org/10.2119/molmed.2008.00110 [PubMed]
- 62. Wurmbach E, Chen YB, Khitrov G, Zhang W, Roayaie S, Schwartz M, Fiel I, Thung S, Mazzaferro V, Bruix J, Bottinger E, Friedman S, Waxman S, Llovet JM. Genome-wide molecular profiles of HCV-induced dysplasia and hepatocellular carcinoma. Hepatology. 2007; 45:938–47. https://doi.org/10.1002/hep.21622 [PubMed]
- 63. Chandrashekar DS, Bashel B, Balasubramanya SA, Creighton CJ, Ponce-Rodriguez I, Chakravarthi BV, Varambally S. UALCAN: A Portal for Facilitating Tumor Subgroup Gene Expression and Survival Analyses. Neoplasia. 2017; 19:649–58. https://doi.org/10.1016/j.neo.2017.05.002 [PubMed]
- 64. Tang Z, Li C, Kang B, Gao G, Li C, Zhang Z. GEPIA: a web server for cancer and normal gene expression profiling and interactive analyses. Nucleic Acids Res. 2017; 45:W98–102. https://doi.org/10.1093/nar/gkx247 [PubMed]
- 65. Huang W, Sherman BT, Lempicki RA. Bioinformatics enrichment tools: paths toward the comprehensive functional analysis of large gene lists. Nucleic Acids Res. 2009; 37:1–13. https://doi.org/10.1093/nar/gkn923 [PubMed]
- 66. Vasaikar SV, Straub P, Wang J, Zhang B. LinkedOmics: analyzing multi-omics data within and across 32 cancer types. Nucleic Acids Res. 2018; 46:D956–63. https://doi.org/10.1093/nar/gkx1090 [PubMed]