


Introduction
Kidney cancer is one of the most common urinary tumors in the world, with an estimated 73,820 new cases and 14,770 deaths in the United States in 2019 [1]. The incidence and mortality of kidney cancer in China is also increasing. In 2015, the estimated number of new cases was 66,800 and the number of deaths was 23,400 [2]. Clear cell renal cell carcinoma (ccRCC) is the major subtype of kidney cancer and is the most common type of renal cell carcinoma (RCC) in adults. According to the World Health Organization, it is one of the most deadly urinary tumors with an annual global mortality rate of approximately 90,000 [3]. Although extensive research has been conducted on the mechanisms of carcinogenesis and progression, the etiology of ccRCC still remains unclear. The development and progression of RCC is reportedly associated with a variety of factors, including genetic aberrations and cellular or metabolic factors [4]. Considering the high morbidity and mortality of RCC, it is critical to reveal the causes and the underlying molecular mechanisms, and to explore molecular biomarkers for early diagnosis, prevention and personalized therapy.
Clear cell renal cell carcinoma represents a heterogeneous group of histologically similar neoplasms. Its development and progression are multistep processes characterized by aberrant genes, which subsequently lead to phenotypic cellular transformation [5]. RNA sequencing (RNA-Seq) has been used to detect genome-wide genetic changes [6]. Comprehensive and systematic study of the interactions between differentially expressed pathways and protein-coding genes can more accurately identify the biological changes that occur during the process of ccRCC carcinogenesis. Therefore, using these bioinformatics methods to analyze RNA-Seq data can aid the understanding of molecular pathogenesis and identify relevant tumor biomarkers. To fully comprehend the changes in gene expression that occur during ccRCC, RNA-Seq has been used to identify many key genes involved in disease progression. So far, the key drivers of carcinogenesis are still unknown, limiting the progress of ccRCC targeted therapy [7]. Therefore, understanding the pathogenesis of this disease remains a major challenge and many key genes are yet to be identified.
In this study, we first selected the gene sets GSE15641, GSE16441 and GSE66270 from the Gene Expression Omnibus (GEO). Second, we applied the R package ‘LIMMA’ from the Bioconductor project [8] and Venn diagram software to obtain the differentially expressed genes (DEGs) commonly found in the above three data sets. Third, the Database for Annotation, Visualization and Integrated Discovery (DAVID) was used to analyze these DEGs including molecular function (MF), cellular components (CC), biological processes (BP), and Kyoto Encyclopedia of Gene and Genome (KEGG) pathways. Fourth, we established a protein-protein interaction (PPI) network and then applied Cytotype MCODE (Molecular Complex Detection) for additional DEG analysis to identify some significant module. Fifth, cytoHubba was used to screen 10 hub genes. In addition, these hub genes were imported into the Kaplan Meier plotter online database to obtain important prognostic information (P < 0.05). Meanwhile, we further verified the expression of hub DEGs between ccRCC tissues and normal kidney tissues by gene expression profiling analysis (GEPIA; P<0.05). Finally, two DEGs (CCND1 and PECAM1/CD31) were generated. In summary, the aim of this study was to improve the understanding of the carcinogenesis of ccRCC by analyzing information about the genetic changes that occur during disease progression and by revealing the expression of biomarkers that may be used for clinical diagnosis, treatment, and disease progression monitoring.
Results
Identification of DEGs in kidney cancer
There were 63 ccRCC tissues and 54 normal kidney tissues in our present study. Via limma software package, 2217, 3197 and 5343 DEGs from GSE15641, GSE16441 and GSE66270 were extracted respectively. The differential expression of multiple genes from two sets of sample data included in each of the three microarrays is shown in Figure 1A–1C. Then, Venn diagram software was used to identify the commonly DEGs in the three datasets. Results showed that a total of 379 commonly DEGs were detected, including 249 downregulated genes (logFC< 1) and 130 up-regulated genes (logFC> 1) in the ccRCC tissues (Figure 1D).
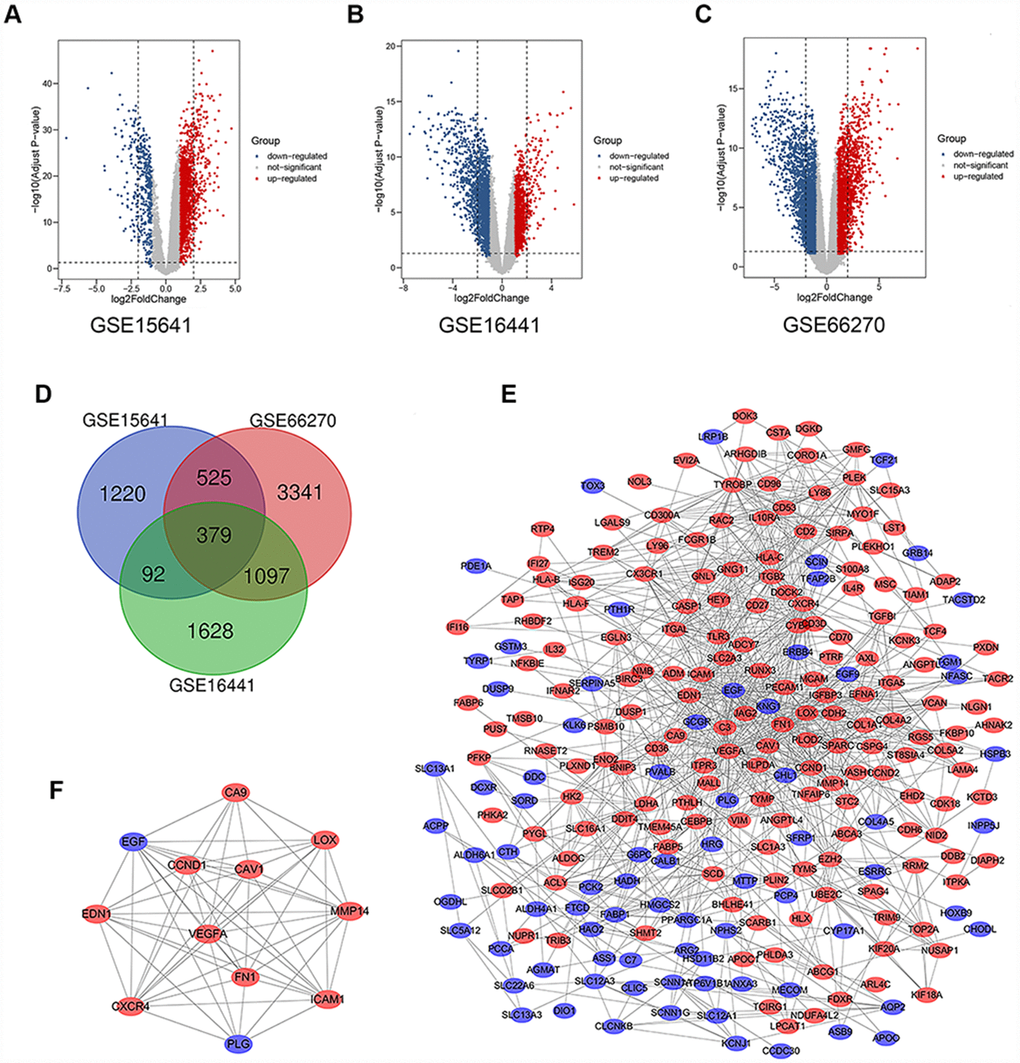
Figure 1. Differential expression of data between two sets of samples, Venn diagram, PPI network and the most significant module of DEGs. (A) GSE15641 data, (B) GSE16441 data, and (C) GSE66270 data. The red points represent upregulated genes screened on the basis of fold change > 1.0 and a corrected P-value of < 0.05. The blue points represent downregulation of the expression of genes screened on the basis of fold change < 1.0 and a corrected P-value of < 0.05. The black points represent genes with no significant difference. (D) DEGs were selected with a |fold change| >1 and P-value <0.05 among the mRNA expression profiling sets GSE15641, GSE16441 and GSE66270. The 3 datasets showed an overlap of 379 genes. (E) The PPI network of DEGs was constructed using Cytoscape. (F) The most significant module was obtained from PPI network with 12 nodes and 58 edges. Upregulated genes are marked in light red; downregulated genes are marked in light blue. Abbreviations: FC: fold change; GEO: Gene Expression Omnibus; DEGs: differentially expressed genes; PPI: protein–protein interaction.
DEGs gene ontology and KEGG pathway analysis in kidney cancers
To analyze the biological classification of DEGs, functional and pathway enrichment analyses were performed using DAVID. GO analysis results showed that changes in BP of DEGs were significantly enriched in angiogenesis, extracellular matrix organization, response to hypoxia, excretion and response to drug (Table 1). Changes in CC were mainly enriched in extracellular exosome, plasma membrane, extracellular space, cell surface, and integral component of plasma membrane (Table 1). Changes in MF of DEGs were mainly enriched in transporter activity, protein homodimerization activity, receptor binding, extracellular matrix structural constituent, and cysteine-type endopeptidase inhibitor activity involved in apoptotic process (Table 1). KEGG pathway analysis revealed that the DEGs were mainly enriched in viral myocarditis, Cell adhesion molecules, Phagosome, Biosynthesis of antibiotics and PI3K-Akt signaling pathway (Table 1).
Table 1. GO and KEGG pathway enrichment analysis of DEGs in ccRCC samples.
| Term | Description | Count in gene set | P-value |
| Gene Ontology | |||
| GO:0001525 | Angiogenesis | 24 | 4.59E-10 |
| GO:0030198 | Extracellular matrix organization | 22 | 1.33E-09 |
| GO:0001666 | Response to hypoxia | 20 | 4.94E-09 |
| GO:0007588 | Excretion | 10 | 6.05E-08 |
| GO:0042493 | Response to drug | 24 | 1.63E-07 |
| GO:0070062 | Extracellular exosome | 128 | 2.66E-20 |
| GO:0005886 | Plasma membrane | 142 | 4.29E-12 |
| GO:0005615 | Extracellular space | 67 | 1.11E-11 |
| GO:0009986 | Cell surface | 36 | 1.37E-09 |
| GO:0005887 | Integral component of plasma membrane | 62 | 1.12E-08 |
| GO:0005215 | Transporter activity | 19 | 2.19E-07 |
| GO:0042803 | Protein homodimerization activity | 36 | 3.44E-06 |
| GO:0005102 | Receptor binding | 21 | 4.90E-05 |
| GO:0005201 | Extracellular matrix structural constituent | 9 | 6.94E-05 |
| GO:0043027 | Cysteine-type endopeptidase inhibitor activity involved in apoptotic process | 6 | 9.09E-05 |
| Biological pathway | |||
| hsa05416 | Viral myocarditis | 12 | 6.03E-07 |
| hsa04514 | Cell adhesion molecules (CAMs) | 17 | 3.51E-06 |
| hsa04145 | Phagosome | 17 | 7.21E-06 |
| hsa01130 | Biosynthesis of antibiotics | 20 | 1.29E-05 |
| hsa04151 | PI3K-Akt signaling pathway | 26 | 2.30E-05 |
| hsa04510 | Focal adhesion | 19 | 3.10E-05 |
| hsa04066 | HIF-1 signaling pathway | 12 | 1.06E-04 |
| hsa00010 | Glycolysis / Gluconeogenesis | 10 | 1.33E-04 |
| hsa04512 | ECM-receptor interaction | 11 | 2.13E-04 |
| hsa03320 | PPAR signaling pathway | 9 | 7.09E-04 |
The significant modular analyses through DEGs protein–protein interaction network (PPI)
To identify the significant modular, the STRING online database (available online: http://string-db.org) and Cytoscape software were used to merge the 379 DEGs. The PPI network of DEGs was constructed (Figure 1E) and the most significant module was obtained using Cytoscape (Figure 1F). The functional analyses of genes involved in this module were analyzed using DAVID. GO analysis results showed that changes in BP of the significant module genes were significantly enriched in response to hypoxia, angiogenesis, positive regulation of peptidase activity, platelet degranulation and mammary gland alveolus development (Table 2). Changes in CC of the significant module genes were mainly enriched in platelet alpha granule lumen, extracellular space, extracellular region, cell surface, and cytoplasmic vesicle (Table 2). Changes in MF of the significant module genes were mainly enriched in peptidase activator activity, integrin binding and protein binding (Table 2). KEGG pathway analysis revealed that the significant module genes were mainly enriched in focal adhesion, bladder cancer, pathways in cancer, proteoglycans in cancer and viral myocarditis (Table 3).
Table 2. GO and KEGG pathway enrichment analysis of the significant module in ccRCC samples.
| Term | Description | Count in gene set | P-value |
| Gene Ontology | |||
| GO:0001666 | Response to hypoxia | 5 | 3.32E-06 |
| GO:0001525 | Angiogenesis | 5 | 9.29E-06 |
| GO:0010952 | Positive regulation of peptidase activity | 3 | 3.03E-05 |
| GO:0002576 | Platelet degranulation | 4 | 3.57E-05 |
| GO:0060749 | Mammary gland alveolus development | 3 | 5.28E-05 |
| GO:0031093 | Platelet alpha granule lumen | 4 | 4.22E-06 |
| GO:0005615 | Extracellular space | 7 | 5.39E-05 |
| GO:0005576 | Extracellular region | 6 | 0.00157 |
| GO:0009986 | Cell surface | 4 | 0.00361 |
| GO:0031410 | Cytoplasmic vesicle | 3 | 0.00844 |
| GO:0016504 | Peptidase activator activity | 3 | 1.73E-05 |
| GO:0005178 | Integrin binding | 3 | 0.00203 |
| GO:0005515 | Protein binding | 11 | 0.00843 |
| GO:0001618 | Virus receptor activity | 2 | 0.04469 |
| Biological pathway | |||
| hsa04510 | Focal adhesion | 5 | 1.42E-04 |
| hsa05219 | Bladder cancer | 3 | 0.00151 |
| hsa05200 | Pathways in cancer | 5 | 0.00167 |
| hsa05205 | Proteoglycans in cancer | 4 | 0.0025 |
| hsa05416 | Viral myocarditis | 3 | 0.00291 |
| hsa05212 | Pancreatic cancer | 3 | 0.00377 |
| hsa04066 | HIF-1 signaling pathway | 3 | 0.00806 |
| hsa04668 | TNF signaling pathway | 3 | 0.00994 |
Table 3. Functional roles of 10 hub genes.
| No. | Gene symbol | Full name | Function |
| 1 | VEGFA | Vascular Endothelial Growth Factor A | Pathways: VEGF Signaling Pathway and Bladder cancer; GO: protein homodimerization activity and protein heterodimerization activity. |
| 2 | FN1 | Fibronectin 1 | Pathways: RET signaling and Cell surface interactions at the vascular wall; GO: heparin binding and protease binding. |
| 3 | ITGB1 | Integrin Subunit Beta 2 | Pathways: Activated TLR4 signalling and Focal Adhesion; GO: protein heterodimerization activity. |
| 4 | ICAM1 | Intercellular Adhesion Molecule 1 | Pathways: Interferon gamma signaling and Glucocorticoid receptor regulatory network. |
| 5 | CXCR4 | C-X-C Motif Chemokine Receptor 4 | Pathways: Human cytomegalovirus infection and Blood-Brain Barrier and Immune Cell Transmigration: VCAM-1/CD106 Signaling Pathways; GO: G protein-coupled receptor activity and ubiquitin protein ligase binding. |
| 6 | PECAM1 | Platelet And Endothelial Cell Adhesion Molecule 1 | Pathways: Blood-Brain Barrier and Immune Cell Transmigration: VCAM-1/CD106 Signaling Pathways and Innate Immune System |
| 7 | CCND1 | Cyclin D1 | Pathways: Gastric cancer and Bladder cancer; GO: protein kinase activity and enzyme binding. |
| 8 | TYROBP | TYRO Protein Tyrosine Kinase Binding Protein | Pathways: RET signaling and Innate Immune System; GO: identical protein binding and obsolete signal transducer activity, downstream of receptor. |
| 9 | EGF | Epidermal Growth Factor | Pathways: Gastric cancer and Vesicle-mediated transport; GO: calcium ion binding and epidermal growth factor receptor binding. |
| 10 | CAV1 | Caveolin 1 | Pathways: Focal Adhesion and TNF signaling (REACTOME); GO: identical protein binding and signaling receptor binding. |
Hub gene selection and survival outcomes of the cohorts
We filtered 30 hub genes that were identified by filtering according to the criterion of degrees >10 criteria (each node had more than 10 interactions), and the 10 most significant genes according to node degree were VEGFA, FN1, ITGB2, ICAM1, CXCR4, PECAM1/CD31, TYROBP, CCND1, EGF, CAV1. (Figure 2A) The names, abbreviations and functions for these hub genes are shown in Table 3. A network of the hub genes and their co-expression genes was analyzed using cBioPortal online platform (Figure 2B). The biological process and KEGG enrichment analysis of the hub genes is shown in Figure 2C–2D. Hierarchical clustering shows that the hub gene can basically distinguish between kidney cancer samples and non-cancer samples (Figure 2E).
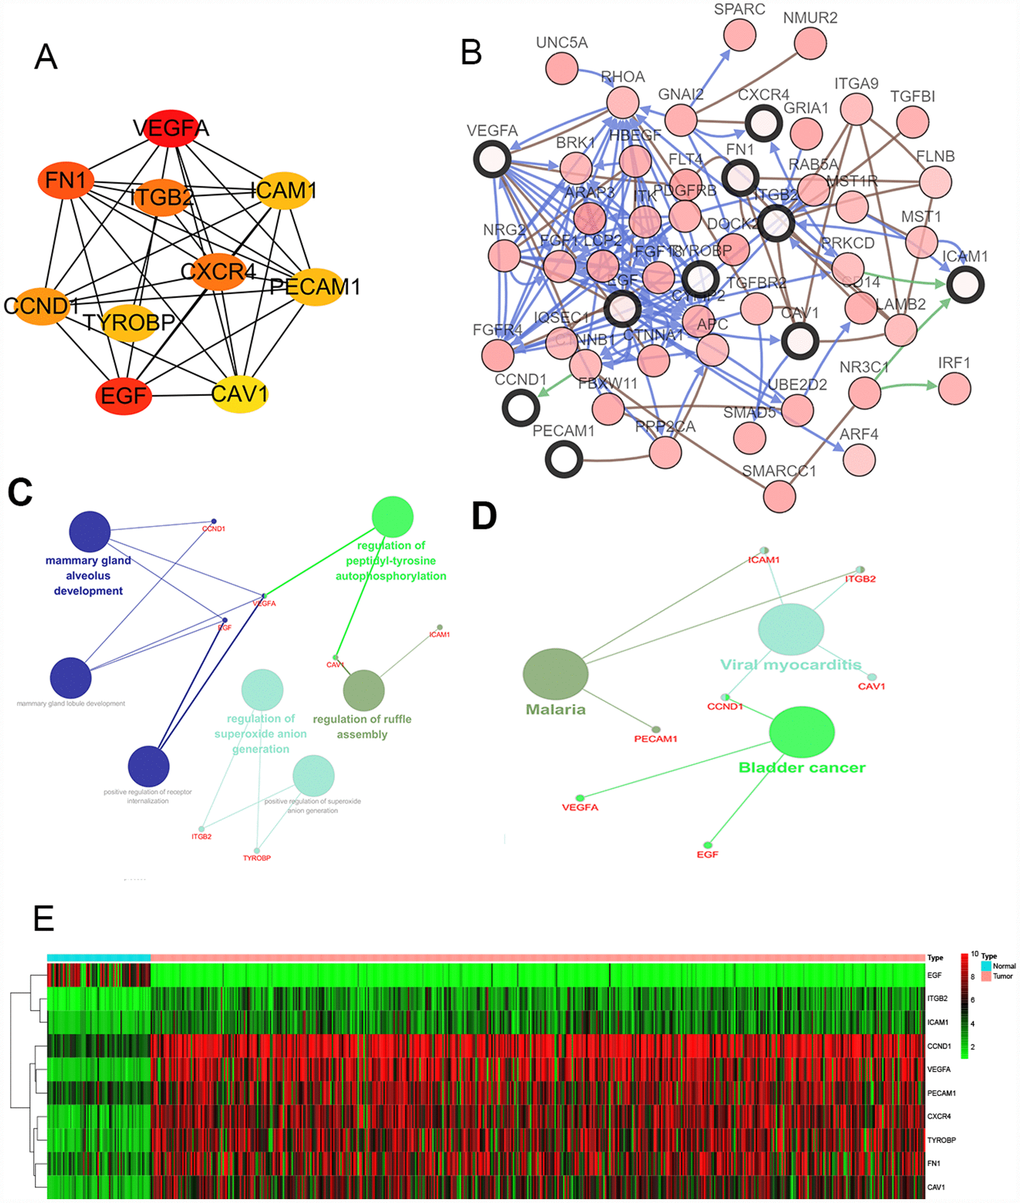
Figure 2. Interaction network and analysis of the hub genes. (A) Screen out the 10 most important hub genes using the cytoscape software plugin cytoHubba. (B) Hub genes and their co-expression genes were analyzed using cBioPortal. Nodes with bold black outline represent hub genes. Nodes with thin black outline represent the co-expression genes. (C) The biologic process functional annotation analysis of hub genes was performed by ClueGO and CluePedia. Different colors of nodes refer to the functional annotation of ontologies. Corrected P value <.01 was considered statistically significant. (D) The KEGG functional annotation analysis of hub genes was performed by ClueGO and CluePedia. Different colors of nodes refer to the functional annotation of ontologies. Corrected P value <.01 was considered statistically significant. (E) Hierarchical clustering heatmap of 10 most important hub genes was constructed depend on TCGA cohort. Red indicates that the expression of genes is relatively upregulated, green indicates that the expression of genes is relatively downregulated, and black indicates no significant changes in gene expression; gray indicates that the signal strength of genes was not high enough to be detected. Abbreviation: TCGA: the cancer genome atlas program; KEGG: Kyoto Encyclopedia of Genes and Genomes.
To determine whether the hub genes in ccRCC have clinical relevance, we performed correlation analysis with the clinical correlative of kidney cancer outcomes in TCGA kidney cancer data sets. Using the data from gene expression profiling interactive analysis (GEPIA), we noted that ccRCC patients who had an association of genomic alterations in CCND1 showed reductions in overall and disease-free survival (P=2.5E-05 for overall survival and P=6.7E-05 for disease-free survival) (Figure 3A–3B). In addition, the PECAM1/CD31 alteration was significantly associated with worse overall survival (P=3.3E-05 for overall survival) while disease-free survival was not statistically significant (P=0.24 for disease-free survival) (Figure 3C–3D).
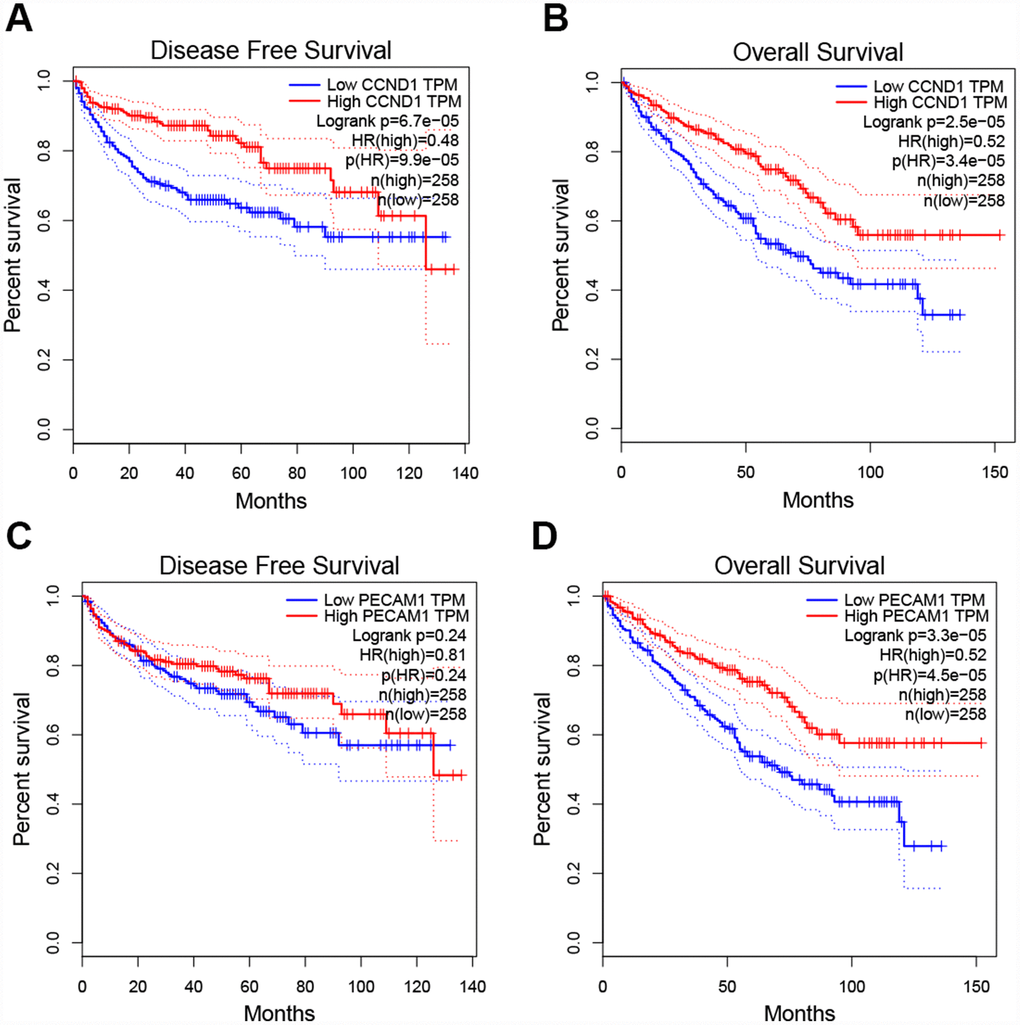
Figure 3. Univariate survival analysis of the hub genes was performed using the Kaplan-Meier curve. (A–B) The gene of CCND1 expression showed obviously significant better DFS and OS in ccRCC samples (Logrank P < .05). (C–D) The expression of the PECAM1/CD31 gene showed a significantly better OS in the ccRCC sample, whereas there was no statistical difference in DFS. Abbreviation: DFS: disease-free survival; OS: overall survival; ccRCC: clear cell renal cell carcinoma.
Additionally, when have optimized cut-off for hub gene analysis, we found that high expression of FN1, ICAM1, CXCR4, TYROBP, EGF, and CAV1 are associated with poor prognosis (Figure 4) and suggested that these genes can also be used as indicators to monitor prognosis.
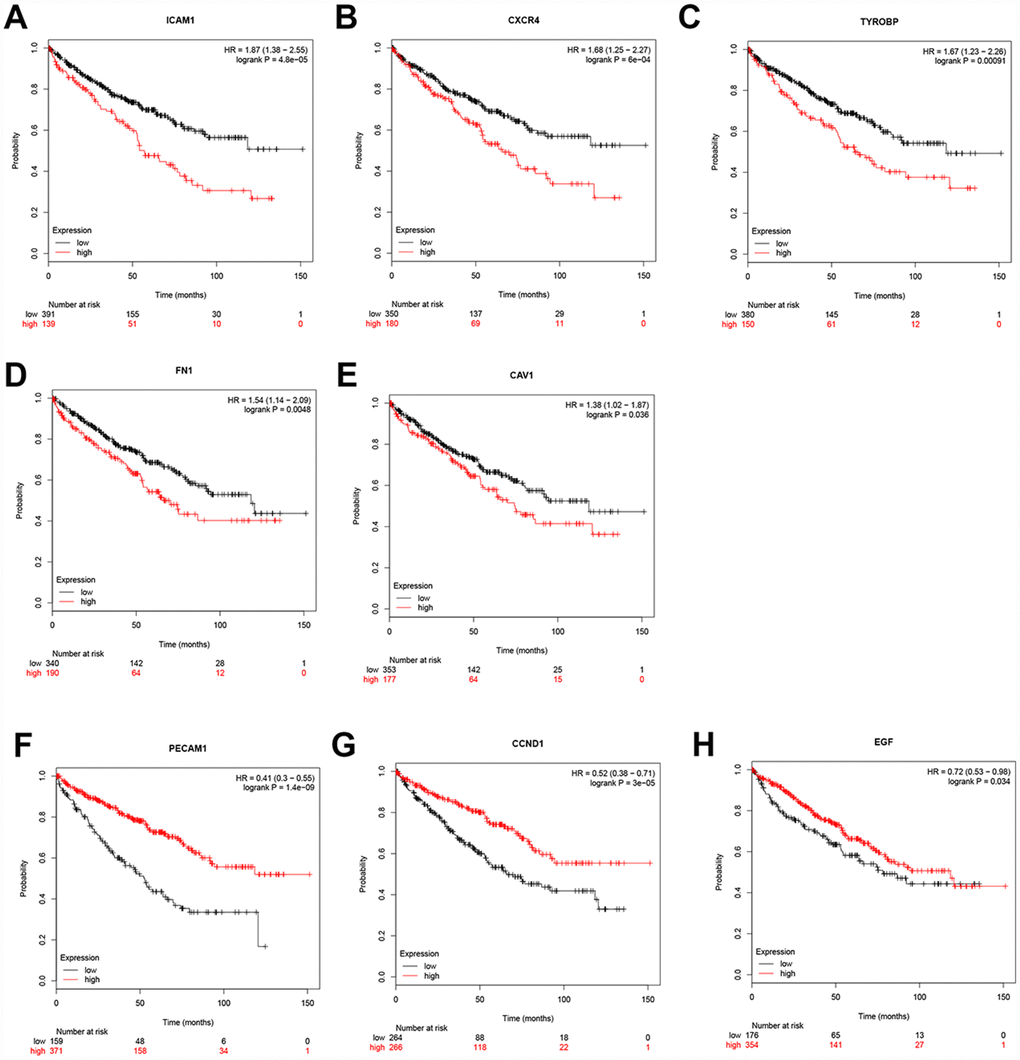
Figure 4. Univariate survival analysis of the hub genes was performed using the Kaplan-Meier curve. The 8 genes of 10 hub genes showed significant difference in OS. Each elevated expression in the 5 significant hub genes showed obviously significant worse OS in ccRCC samples, whereas elevation of the remaining 3 hub genes showed better OS (Logrank P < .05). Abbreviation: OS: overall survival; ccRCC: Clear cell renal cell carcinoma.
Differential expression of CCND1 and PECAM1/CD31
The mRNA expression of CCND1 and PECAM1/CD31 were compared between kidney tumor samples and adjacent normal tissues respectively based on RNA-sequence data from TCGA database. Transcriptional level of CCND1 expressions were found highly expressed in 533 ccRCC tissues compared with 72 normal tissues (Figure 5A). As was shown in Figure 5B, CCND1 mRNA expressions of ccRCC samples were significantly correlated with mild clinical stages, and the highest CCND1 mRNA expressions were found in stage 1. Similarly, relationship between CCND1 mRNA expression and different pathological grade was measured, which suggested that mRNA expressions of CCND1 were significantly correlated with pathological grades (Figure 5C). In addition, mRNA level of PECAM1/CD31 was also increased in ccRCC tissues (Figure 5D). PECAM1/CD31 mRNA expression in the ccRCC sample was also significantly correlated with mild clinical staging, and the highest PECAM1/CD31 mRNA expression was found in stage 1 (Figure 5E). Meanwhile, mRNA expression levels of PECAM1/CD31 were also associated with lower clinicopathological grading (Figure 5F).
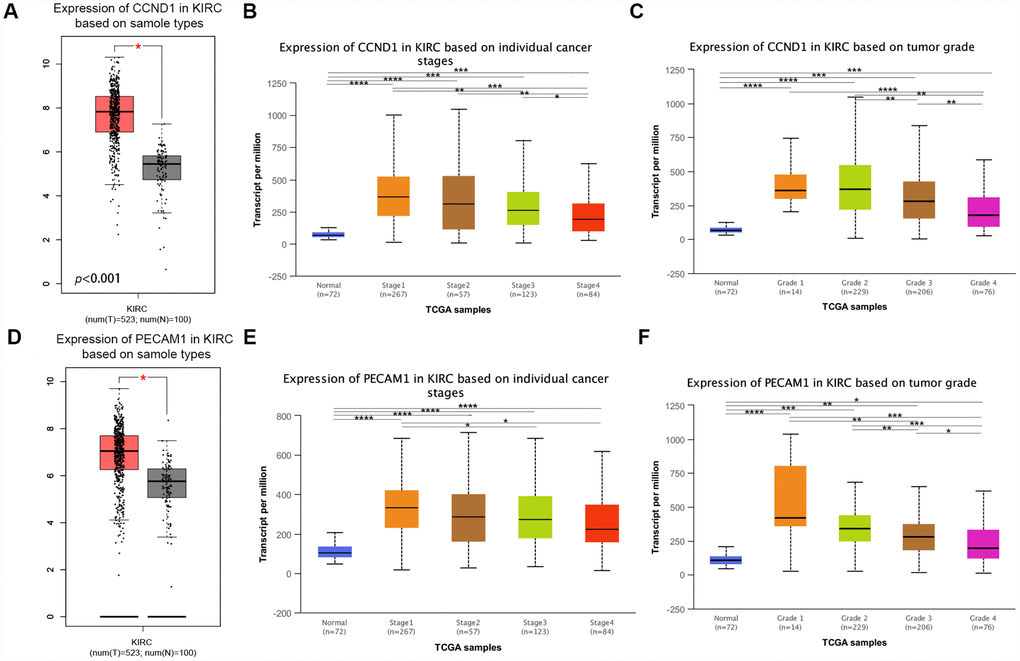
Figure 5. Transcriptional expression of CCND1 and PECAM1/CD31 in ccRCC tumor tissues and adjacent normal renal tissues. (A) Transcriptional level of CCND1 expression was found highly expressed in 533 ccRCC tissues compared with 72 normal tissues (p<0.0001). (B) Transcriptional expression of CCND1 was significantly correlated with AJCC stages, patients who were in more mild stages tended to express higher mRNA expression of CCND1. (C) Transcriptional expression of CCND1 was significantly correlated with ISUP grade, patients who were in more mild grade score tended to express elevated mRNA exspression of CCND1. Highest mRNA expressions of CCND1 were found in stage 1 or grade 1. (D) Transcriptional level of PECAM1/CD31 expression was found highly expressed in 533 ccRCC tissues compared with 72 normal tissues (p<0.0001). (E) Transcriptional expression of PECAM1/CD31 was significantly correlated with AJCC stages, patients who were in more mild stages tended to express higher mRNA expression of PECAM1/CD31. (F) Transcriptional expression of PECAM1/CD31 was significantly correlated with ISUP grade, patients who were in more mild grade score tended to express elevated mRNA expression of PECAM1/CD31. Highest mRNA expressions of PECAM1/CD31 were found in stage 1 or grade 1.
In addition, representative proteins expressions of immunohistochemistry images indicated that CCND1 staining was not detected in normal kidney tissues, while its medium staining was observed in ccRCC tissues (Supplementary Figure 1). Taken together, it suggested that transcriptional and proteomic expressions of CCND1 were highly expressed in ccRCC tissues compared with normal tissues. Therefore, the hub gene CCND1 and PECAM1/CD31 may play key role in the progression of clear cell renal cell carcinoma. Overall, elevated expression of CCND1 and PECAM1/CD31 mRNA was significantly associated with mild clinical pathological parameters in ccRCC patients and was only significantly elevated in the early stages of the disease. Therefore, it may play an important role in the early diagnosis of ccRCC.
Clinicopathological characteristics baseline for ccRCC patients and cox regression analyses of CCND1 as well as PECAM1/CD31 in TCGA cohort
This study included 533 selected samples in TCGA cohort. As shown in Supplementary Table 1, the clinical characteristics of these samples contained information regarding age, gender, laterality, T stage, N stage, M stage AJCC stage, and ISUP grade.
Univariate and multivariate analyses were conducted to identify OS-correlated characteristics. In univariate Cox regression analysis models of CCND1, traditional prognostic factors such as pTNM stage, AJCC stage, and ISUP grade were significantly relevant to OS (p<0.05; Supplementary Table 2) in ccRCC patients in the TCGA cohorts. Importantly, CCND1 amplification markedly correlated with poor OS (hazard ratio [HR]=0.408, p<0.001). In multivariate Cox regression analysis, traditional prognostic factors, specifically pM stage, were still relevant to OS (HR=2.764, p<0.001; Supplementary Table 2) in ccRCC patients. Importantly, elevated CCND1 expression was significantly associated with poor OS (HR=0.603, p=0.043) in TCGA cohorts of ccRCC patients.
In addition, in univariate Cox regression analysis models of PECAM1/CD31, traditional prognostic factors such as pTNM stage, AJCC stage, and ISUP grade also were significantly relevant to OS (p<0.05; Supplementary Table 3) in ccRCC patients in the TCGA cohorts. Significantly, PECAM1/CD31 amplification markedly correlated with poor OS (HR=0.448, p<0.001). In addition, in multivariate Cox regression analysis, traditional prognostic factors such as pM stage, were still relevant to OS (HR=2.971, p<0.001; Supplementary Table 3) in ccRCC patients. Importantly, elevated PECAM1/CD31 expression was significantly associated with poor OS (HR=0.595, p=0.016) in TCGA cohorts of ccRCC patients.
External prognostic validation of CCND1 and PECAM1/CD31
Consistent with previous results, we enrolled survival and follow-up data from an independent cohort GSE3538 (Zhao Renal dataset). It suggested that high expression of CCND1 and PECAM1/CD31 in GSE3538 were significantly associated with favorable prognosis in ccRCC patients (Figure 6) [9].
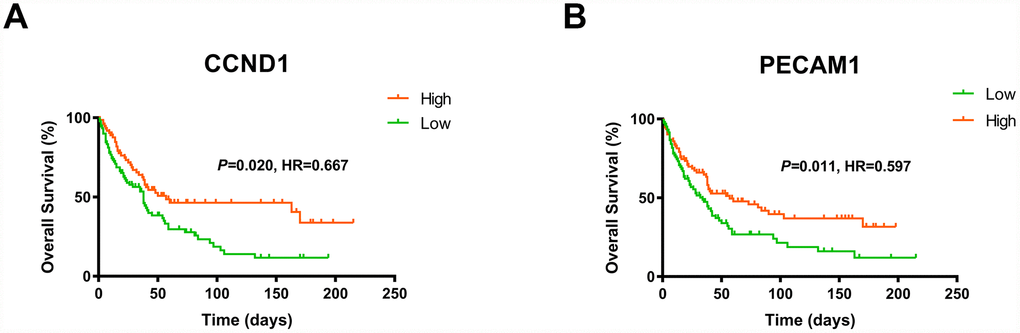
Figure 6. The gene of CCND1 and PECAM1/CD31 expression significantly correlated OS and PFS in an independent external ccRCC cohort GSE3538.
Subsequently, we measure CCND1 and PECAM1/CD31 expression level in three pairs of ccRCC tumor and normal samples. Significantly elevated CCND1 and PECAM1/CD31 expression in human ccRCC tissues compared with normal tissues in protein and mRNA levels (Figure 7A–7B).
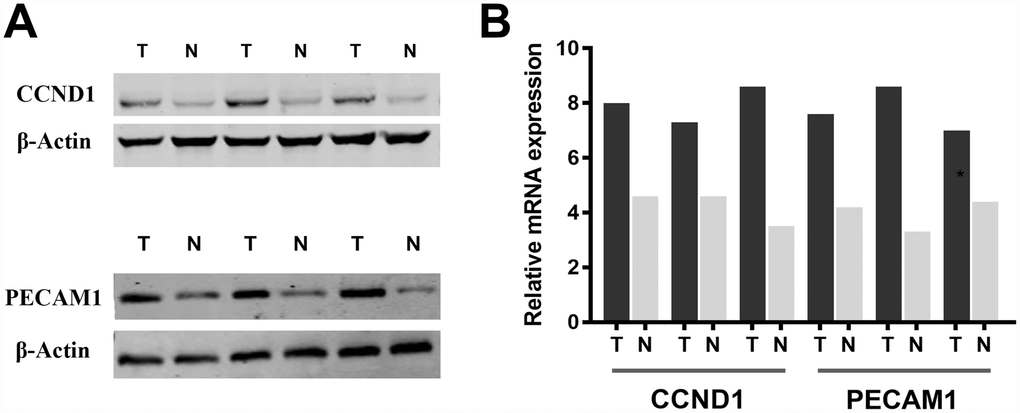
Figure 7. Significantly elevated CCND1 and PECAM1/CD31 expression in human ccRCC tissues compared with normal tissues in (A) protein and (B) mRNA levels.
Expression of CCND1 and PECAM1 other types of tumors and prognostic value
We have already discussed the better prognosis of ccRCC patients with high expression of CCND1 and PECAM1/CD31. To assess the expression and prognostic value of CCND1 and PECAM1/CD31 in other tumors, we used the tumor-immune system interactions (TISIDB, http://cis.hku.hk/TISIDB/index.php) online database to detect the expression of CCND1 and PECAM1/CD31 in other types of tumors other than kidney cancer and to assess the prognostic value based on TCGA cohort. As shown in Supplementary Figure 2, the high expression of CCND1 is not only related to the better prognosis of patients with kidney renal clear cell carcinoma, but also related to the better prognosis of liver hepatocellular carcinoma. However, the high expression of CCND1 is associated with poor prognosis of head and neck squamous cell carcinoma, lung adenocarcinoma, mesothelioma and pancreatic adenocarcinoma. In addition, while the high expression of PECAM1/CD31 is related to the better prognosis of patients with kidney renal clear cell carcinoma, and skin cutaneous melanoma, the high expression of PECAM1/CD31 is related to the poor prognosis of patients with brain low grade glioma and uveal melanoma(Supplementary Figure 3).
GSEA analysis
A total of 100 significant genes were obtained by GSEA with positive and negative correlation. Importantly, GSEA was used to perform hallmark analysis for CCND1 and PECAM1/CD31. Results suggested that the most involved significant pathways of CCND1 included hedgehog signaling, heme metabolism, PI3K/AKT/mTOR signaling, TGF-β signaling, UV-response, and wnt-β/catemin signaling. The details are shown in Figure 8A–8E. In addition, transcriptional expression profiles of the 100 significant genes were performed in a heat map (Figure 8F). In addition, GSEA enrichment analysis showed that the most important pathways for PECAM1/CD31 include angiogenesis, apical junction, hedgehog signaling, TGF-beta signaling, and WNT/β/CATEMIN signaling. The details are shown in Figure 9A–9E. Meanwhile, transcriptional expression profiles of 100 significant genes related to PECAM1/CD31 were performed in the heat map (Figure 9F).
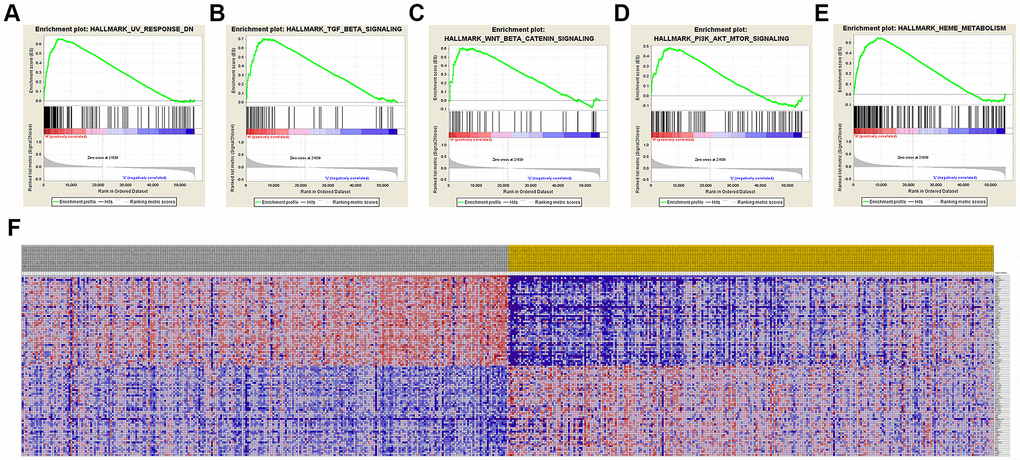
Figure 8. Significant CCND1-related genes and hallmarks pathways in ccRCC obtained by GSEA. A total of 100 significant genes were obtained by GSEA with positive and negative correlation. (A–E) The most involved significant pathways included hedgehog signaling, heme metabolism, PI3K/AKT/MTOOR signaling, TGF-β signaling, UV-response, and WNT/β/CATEMIN signaling. (F) Transcriptional expression profiles of the 100 significant genes were performed in a heat map.
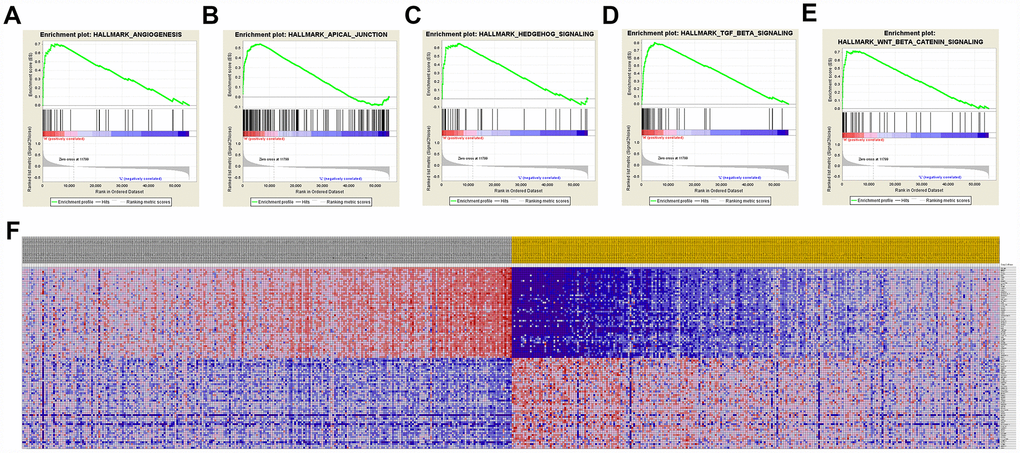
Figure 9. Significant PECAM1/CD31-related genes and hallmarks pathways in ccRCC obtained by GSEA. A total of 100 significant genes were obtained by GSEA with positive and negative correlation. (A–E) The most involved significant pathways included angiogenesis, apical junction, hedgehog signaling, TGF-beta signaling, and WNT/β/CATEMIN signaling. (F) Transcriptional expression profiles of the 100 significant genes were performed in a heat map.
Discussion
Clear cell renal cell carcinoma is one of the most common genitourinary system malignancies in the world. It is well known that advanced ccRCC is difficult to treat while early ccRCC has a favorable prognosis. Although various causes and underlying mechanisms of ccRCC formation and progression were investigated in multiple “omics” studies, the global morbidity and mortality of ccRCC has remained high over the past few decades. Similar to other solid tumors, the development and progression of ccRCC is characterized by abnormal genetic and protein expression. Numerous studies have demonstrated that development of ccRCC is the result of an accumulation of cellular and molecular aberrations, including epigenetic, transcriptomic, miRNA, proteomic and metabolomic abnormalities [10–13]. The multiple “omics” research that aim to identify diagnostic biomarkers for early detection of kidney cancer, highlight not only the heterogeneity, but also the potential molecular commonalities in different stages of kidney cancer. Clearly, ccRCC has significant molecular heterogeneity, involving numerous genetic and protein level changes, thus, a group of well-selected candidates could represent all of these tumors. With the development of bioinformatics, several molecular markers in ccRCC have been identified as potential novel prognostic biomarkers, but none of them has been independently validated. Neither have these biomarkers been compared with each other to determine further studies and screen candidates. The molecular signature of ccRCC, which may provide potential biomarkers for early detection and monitoring for progression, is still far from fully defined.
In our study, unlike a single genetic or cohort study, the study analyzed three microarray datasets, including 63 kidney tumors and 54 normal kidney samples. A total of 379 DEGs were identified in ccRCC, including 249 upregulated genes and 130 downregulated genes. Gene ontology was performed based on DAVID, which showed that the DEGs were mainly enriched in angiogenesis, extracellular matrix organization, response to hypoxia, excretion and response to drug categories. Pathway enrichment was analyzed based on the KEGG database to evaluate the functional relevance of DEGs. Based on the STRING database and Cytoscape software, relevant PPIs were constructed and visualized that contained 379 nodes and 1704 edges.
The most significant 10 hub genes were selected, and comprised VEGFA, FN1, ITGB2, ICAM1, CXCR4, PECAM1/CD31, TYROBP, CCND1, EGF, and CAV1. To screen for early diagnosis of renal cancer, we selected two genes that were elevated in the early stages of renal cell carcinoma: CCND1 and PECAM1/CD31.
The gene CCND1 encodes the cyclin D1 protein, a member of the cyclin family involved in the regulation of cell cycle progression. Cyclin D1, dimerizes with cyclin-dependent kinase (CDK) 4 or CDK6 to regulate the G1/S phase transition of the cell cycle [14]. Previous studies have showed that cyclin D1 plays a vital role in tumors of the breast [15], lung [16], bladder [17] and colon [18]. In a recent study, He et al. observed that expression of cyclin D1 in breast cancer tissue was higher than in normal samples, and the expression levels were significantly correlated with tumor size, clinical stage and pathological grade [19]. The relationship between CCND1 and renal cell carcinoma has not yet been fully determined, but its tendency to increase expression in the early stages of renal cell carcinoma may serve as an indicator for early diagnosis of renal cell carcinoma.
Platelet and endothelial cell adhesion molecule 1, (PECAM1, also named CD31), encodes a protein involved in several processes of primary tumor growth and proliferation, including angiogenesis, vascular permeability, and extracellular circulation [20]. There is evidence that PECAM1/CD31 is involved in the progression of a variety of malignancies including melanoma and cancers of the lung and breast [21, 22]. There is a need to further explore the molecular mechanisms between the expression of PECAM1/CD31 and tumorigenesis, and identify potential therapeutic targets. Like CCND1, PECAM1/CD31 was also observed to be highly expressed in the early stages of ccRCC. This suggests that PECAM1/CD31 and CCND1 could be used as indicators for the early diagnosis of renal cancer.
Gene set enrichment analysis (GSEA) showed that significant pathways for CCND1 and PECAM1/CD31 include the transforming growth factor (TGF)-β and Wnt pathways. TGF-β signaling events are well known to control diverse processes and numerous responses, such as cell proliferation, differentiation, apoptosis, and migration [23]. In the early stages of tumor development, TGF-β often acts as a tumor suppressor, whereas in later phases, cancer cells can become resistant to its antimitogenic effects and TGF-β can shift into a tumor promoter [24–26]. In the later phases of cancer progression, TGF-β signaling can reduce expression of epithelial markers, such as E-cadherin, and promote epithelial-to-mesenchymal transition (EMT) by increasing the expression of mesenchymal markers including N-cadherin and vimentin [27, 28]. EMT is essential for normal embryonic development, but it also contributes to tumor invasion and metastasis. Recent studies have confirmed that TGF-β is involved in bone metastasis of breast cancer and prostate cancer [29–31]. Because TGF-β has a wide range of functions during tumor metastasis, specific blocking of TGF-β ligand and/or receptor activity may provide better antitumor therapeutic effects. Several clinical trials of drugs that target TGF-β are currently underway including those that are aimed at cancer progression and metastasis [32].
The Wnt signaling pathway has also been intensively studied and plays a role in cell proliferation, growth, cell fate and differentiation [33, 34]. Mutations in Wnt signaling pathway components are linked to many diseases, including cancer [35]. It is important to understand that the Wnt signaling pathway also provides potential benefits for genetic therapy. The components of the Wnt signaling pathway can be divided into Wnt ligands and Wnt receptors [36]. There are 19 Wnt ligands, all of which have a cysteine-rich domain and can activate different types of Wnt signaling pathways by binding to specific Wnt signaling receptors [37]. In addition, some Wnt ligands are also involved in the formation and development of cancer. WNT1 encodes a number of glycoproteins that are reported to be markers of advanced metastasis in cancer patients [38]. WNT3A was found to be overexpressed and correlated with the level of MMP9 in colorectal tumor tissues [39]. Wnt signaling is involved in determining cell fate, and mutations in Wnt signaling pathway components are reported to be strongly associated with different types of human cancers, such as lung, breast and ovarian cancer [40–42]. Thus, inhibitors of Wnt signaling could be used for cancer treatment.
The phosphatidylinositol 3-kinase (PI3K) signaling pathway is overactivated in most cancers [43]. PI3K signaling plays an important role in cellular physiology, coordinates insulin signaling during organism growth, and mediates key cellular processes such as glucose homeostasis, protein synthesis, cell proliferation and survival. This pathway has been a fierce field of investigation, especially in light of cancer genome studies that have showed it is one of the most common pathways altered in human malignancies. PI3K signaling impacts on many processes that regulate the hallmarks of cancer, including cell proliferation, survival, and genomic instability, and metabolism [44].
Our study is an attempt to construct a gene regulatory network incorporating DEGs that have been identified in normal tissues and primary ccRCC, and to initiate the functional annotation of hub genes that they share. Furthermore, we believe that alterations in ICAM1, CXCR4, TYROBP, FN1, and CAV1 are significantly associated with worse prognosis, indicating that these genes may play important roles in creating aggressive malignant phenotypes of ccRCC. This study had the following limitations. First, the data we utilized were drawn from unbalanced samples of normal tissues and primary ccRCCs, which were of poor quantity and downloaded from the GEO database, rather than samples obtained by our team. Second, this study failed to explore underlying mechanisms of signaling pathways in ccRCC, although a series of functional annotations and enrichment analyses were investigated. Further research should focus on exploring the detailed mechanisms between the hub genes and ccRCC carcinogenesis.
In conclusion, this study has identified DEGs and hub genes in normal tissues and primary ccRCC tissues, that may help us uncover the mechanisms behind the development of ccRCC, and provide more clues for its prognosis. Further research is needed to elucidate the molecular pathogenesis and alteration of the signaling pathways of the hub genes in ccRCC.
Materials and Methods
Transcriptional expression profiles process
NCBI-GEO is regarded as a free public database of transcriptional expression profile and we obtained the gene expression profile of GSE15641, GSE16441 and GSE66270 in kidney cancer and normal kidney tissues. The data of GSE15641 were obtained with the GPL96 platform (Affymetrix Human Genome U133A Array) and came from 32 kidney tumours and 23 normal kidney tissue sample. Similarly, the data of GSE16441 were based on the GPL6480 platform (Whole Human Genome Microarray 4x44K G4112F). The gene microarray data were collected from 17 renal clear cell carcinoma and 17 non-tumor. The GSE66270 data were obtained from the GPL570 platform (Affymetrix Human Genome U133 Plus 2.0 Array). 14 primary kidney tumours and 14 Adjacent Normal kieney tissues were analysed for the GSE66270 data set.
Standardization and elucidation of DEGs
DNA microarray analysis started with preprocessing and standardization of raw biological data. This procedure eliminated noise from the biological data and guaranteed integrity. Then, background correction of probe data, standardization, and summarization were performed by robust multiarray average analysis algorithm [45] in affy package of R [46].
The DEGs between normal kidney tissues and ccRCC samples were screened and identified across experimental conditions. Delineating parameters such as adjusted P values (adj. P), Benjamini and Hochberg false discovery rate (FDR) and fold change were utilized to filter DEGs and provide a balance between the discovery of statistically significant genes and limitations of falsepositives. Probe sets without corresponding gene symbols or genes with more than one probe set were removed or averaged. The absolute value of |log2FC| (fold change) >1.00 and P value <.05 were considered statistically significant. Then, the raw data in TXT format were checked in Venn software online to detect the commonly DEGs among the three datasets. The DEGs with log FC < 0 was considered as down-regulated genes, while the DEGs with log FC > 0 was considered as an up-regulated gene.
KEGG and GO enrichment analyses of DEGs
Database for Annotation, Visualization and Integrated Discovery (DAVID) (http://david.ncifcrf.gov) (version 6.7) is an online biological information database that integrates biological data and analysis tools, and provides a comprehensive set of functional annotation information of genes and proteins for users to extract biological information [47]. Kyoto Encyclopedia of Gene and Genome (KEGG) is a database resource for understanding advanced functions and biological systems from large-scale molecular data generated by high-throughput experimental techniques [48]. Gene ontology (GO) is a major bioinformatics tool for annotating genes and analyzing the biological processes of these genes [49]. We could use DAVID to visualize the DEGs enrichment of molecular function (MF), cellular components (CC), biological processes (BP) and biological pathways (P < 0.05).
Human protein atlas
The Human Pathology Atlas project (https://www. proteinatlas.org) contains immunohistochemistry (IHC) data using a tissue microarray-based analysis [50]. Staining intensity, quantity, location and patients’ information in patients with the respective cancer types were available online. In this study, representative proteins expressions of IHC images of CCND1 were detected in ccRCC and normal tissues in Human Protein Atlas.
PPI network and module analysis
DEG-encoded proteins and the PPI were obtained using the online database STRING (available online: http://string-db.org) [51]. An interaction with a combined score >0.4 was considered statistically significant. Cytoscape (version 3.7.1), a public source bioinformatics software platform, was used to visualize and analyze molecular interaction networks [52]. The plug-in Molecular Complex Detection (MCODE) (version 1.5.1) of Cytoscape was used for clustering a given network based on the topology to find densely connected regions [53]. MCODE can be used to identify the most dense and significant module in the PPI networks with criteria as follows: degree cut-off = 2, node score cut-off = 0.2, Max depth = 100, and K-score = 2.
Hub genes selection and analysis
The plug-in cytoHubba (version 0.1) of Cytoscape was used for screen out hub genes based on degress. The hub genes were selected with degrees ≥10(each node had more than 11 connections/interactions). A network of the genes and their co-expression genes was analyzed using cBioPortal (http://www.cbioportal.org) online platform [54]. ClueGO is a plug-in of Cytoscape that can visualize the nonredundant biological terms for large clusters of genes in a functionally grouped network [55]. The biological process from GO analysis of hub genes was performed and visualized by ClueGO (version 2.5.4) and CluePedia (version 1.5.4), which was a functional extension of ClueGO and a plug-in of Cytoscape [56]. In addition, hierarchical clustering of the hub genes was constructed.
Survival analysis
The Kaplan-Meier method was used to analyze differences in survival between groups. The primary endpoint was disease-free survival (DFS), the duration from the onset of curative treatment to the date of progression or the start date of the second-line treatment or the date of death, whichever occurs first. The overall survival (OS) as a secondary endpoint was the length of time from the date of diagnosis or first treatment to the date of death or last follow-up. The Kaplan-Meier method was used to estimate and account for the duration of follow-up, the 95% confidence interval (95% CI) and the log-rank test in the separation curve. The overall score was determined as the sum of the weights of each important central gene. Univariate and multivariate analysis were performed with Cox logistic regression models to find independent variables, including age at diagnosis, age (ref. < 60 years), gender (ref. Male), pT stage (ref. T1-T2), pN stage (ref. N0), pM stage (ref. M0), AJCC stage (ref. I-II), ISUP grade (ref. 1-2) and CCND1 and PECAM1/CD31 expression (ref. Low). X-tile software was utilized to take the cut-off value. All hypothetical tests were two-sided and p-values less than 0.05 were considered significant in all tests. Integrated score was identified as sum of the weight of CCND1 and PECAM1/CD31 and significant clinicopathological prognostic indicators.
Oncomine database
In this study, transcriptional expression profiles of CCND1 and PECAM1/CD31 in ccRCC patients were obtained from Oncomine database using Oncomine online database (http://www.oncomine.com) [57]. Difference of transcriptional expression was compared by Students’t-test. Cut-off of p value and fold change were as following: p-value=0.01, Fold Change=1.5, gene rank=10%, Data type: mRNA.
Western blotting analysis
Total protein was extracted from cells using RIPA lysis buffer (TaKaRa) according to the manufacturer’s instructions. Proteins in lysates were determined using the bicinchoninic acid (BCA) assay and 10% SDS-PAGE and then transferred onto a polyvinylidene fluoride (PVDF) membrane. The membrane was incubated with blocking buffer for 2 h at room temperature and then with the primary antibody anti-CCND1 (1:1000, ab16663, Abcam) and and anti-CD31 (PECAM1/CD31; 1:1000, ab28364, Abcam) overnight at 4°C. Then, the protein was visualized using ECL plus western blotting detection reagents (Biosciences) and detected with an enhanced chemiluminescence kit.
RNA extraction and quantitative real-time PCR analysis (qRT-PCR)
Total RNA from harvested patients’ sample cells was isolated by Trizol (Invitrogen, Carlsbad, CA), and qRT-PCR was performed using SYBR® Premix Ex TaqTM (TaKaRa) according to manufacturer’s protocol, as previously described [58]. The primers pairs were: CCND1 forward, 5′-GCTGTGCATCTACACCGACA-3′, CCND1 reverse, 5′-TTGAGCTTGTTCACCAGGAG-3′, CD31/PECAM1/CD31 forward, 5′-GTGCTGCAATGTGCTGTGAA-3′, CD31/PECAM1/CD31 reverse, 5′-CTGGTTCGTCTTCCGATCTGT-3′. The mRNA expression level was normalized to actin and replicated in triplicate according to the manufacturer’s instructions. The relative expression quantity was calculated using the 2-ΔΔCt method.
Data processing of gene set enrichment analysis (GSEA)
TCGA database were implemented with GSEA method using the Category version 2.10.1 package. Student’s-t-test statistical score was performed in consistent pathways and the mean of the differential expression genes was calculated. A permutation test with 1000 times was used to identify the significantly changed pathways. The adjusted P values (adj. P) using Benjamini and Hochberg (BH) false discovery rate (FDR) method by default were applied to correct the occurrence of false positive results [23]. The significant related genes were defined with an adj. P less than 0.01 and FDR less than 0.25. Statistical analysis and graphical plotting were conducted using R software (Version 3.6.1).
Ethics approval
The Ethics Committee of Longhua Hospital Affiliated to Shanghai University of Traditional Chinese Medicine approved the study.
Author Contributions
The work presented here was carried out in collaboration among all authors. ZXQ, ZHL and QYY defined the research theme, discussed analyses, interpretation, and presentation. YJF and SSN drafted the manuscript, analyzed the data, developed the algorithm and interpreted the results. XWH co-worked on associated data collection, cohort validation and helped to draft the manuscript. QYH, ZJZ, YK, SXY, and LF helped to perform the statistical analysis. WY and WR helped to perform the reference collection. All authors read and approved the final manuscript.
Conflicts of Interest
The authors declare no conflicts of interests.
Funding
This work is supported by Grants from the National Natural Science Foundation of China (No. 81802525) and Department of Surgery, Longhua Hospital, Shanghai University of Traditional Chinese Medicine (YW002.017)
References
- 1. Siegel RL, Miller KD, Jemal A. Cancer statistics, 2019. CA Cancer J Clin. 2019; 69:7–34. https://doi.org/10.3322/caac.21551 [PubMed]
- 2. Chen W, Zheng R, Baade PD, Zhang S, Zeng H, Bray F, Jemal A, Yu XQ, He J. Cancer statistics in China, 2015. CA Cancer J Clin. 2016; 66:115–32. https://doi.org/10.3322/caac.21338 [PubMed]
- 3. Baldewijns MM, van Vlodrop IJ, Schouten LJ, Soetekouw PM, de Bruïne AP, van Engeland M. Genetics and epigenetics of renal cell cancer. Biochim Biophys Acta. 2008; 1785:133–55. https://doi.org/10.1016/j.bbcan.2007.12.002 [PubMed]
- 4. Linehan WM, Ricketts CJ. The metabolic basis of kidney cancer. Semin Cancer Biol. 2013; 23:46–55. https://doi.org/10.1016/j.semcancer.2012.06.002 [PubMed]
- 5. Li QK, Pavlovich CP, Zhang H, Kinsinger CR, Chan DW. Challenges and opportunities in the proteomic characterization of clear cell renal cell carcinoma (ccRCC): A critical step towards the personalized care of renal cancers. Semin Cancer Biol. 2019; 55:8–15. https://doi.org/10.1016/j.semcancer.2018.06.004 [PubMed]
- 6. Maekawa S, Suzuki A, Sugano S, Suzuki Y. RNA sequencing: from sample preparation to analysis. Methods Mol Biol. 2014; 1164:51–65. https://doi.org/10.1007/978-1-4939-0805-9_6 [PubMed]
- 7. Lai C, Teng X. [Molecular biological foundation of targeted therapy for metastatic renal cell carcinoma]. Zhejiang Da Xue Xue Bao Yi Xue Ban. 2016; 45:91–97. [PubMed]
- 8. Smyth GK, Michaud J, Scott HS. Use of within-array replicate spots for assessing differential expression in microarray experiments. Bioinformatics. 2005; 21:2067–75. https://doi.org/10.1093/bioinformatics/bti270 [PubMed]
- 9. Subramanian A, Tamayo P, Mootha VK, Mukherjee S, Ebert BL, Gillette MA, Paulovich A, Pomeroy SL, Golub TR, Lander ES, Mesirov JP. Gene set enrichment analysis: a knowledge-based approach for interpreting genome-wide expression profiles. Proc Natl Acad Sci USA. 2005; 102:15545–50. https://doi.org/10.1073/pnas.0506580102 [PubMed]
- 10. Zhao H, Ljungberg B, Grankvist K, Rasmuson T, Tibshirani R, Brooks JD. Gene expression profiling predicts survival in conventional renal cell carcinoma. PLoS Med. 2006; 3:e13. https://doi.org/10.1371/journal.pmed.0030013 [PubMed]
- 11. Moch H, Cubilla AL, Humphrey PA, Reuter VE, Ulbright TM. The 2016 WHO Classification of Tumours of the Urinary System and Male Genital Organs-Part A: Renal, Penile, and Testicular Tumours. Eur Urol. 2016; 70:93–105. https://doi.org/10.1016/j.eururo.2016.02.029 [PubMed]
- 12. Delahunt B, Srigley JR. The evolving classification of renal cell neoplasia. Semin Diagn Pathol. 2015; 32:90–102. https://doi.org/10.1053/j.semdp.2015.02.002 [PubMed]
- 13. Cancer Genome Atlas Research Network. Comprehensive molecular characterization of clear cell renal cell carcinoma. Nature. 2013; 499:43–49. https://doi.org/10.1038/nature12222 [PubMed]
- 14. Davis CF, Ricketts CJ, Wang M, Yang L, Cherniack AD, Shen H, Buhay C, Kang H, Kim SC, Fahey CC, Hacker KE, Bhanot G, Gordenin DA, et al, and The Cancer Genome Atlas Research Network. The somatic genomic landscape of chromophobe renal cell carcinoma. Cancer Cell. 2014; 26:319–30. https://doi.org/10.1016/j.ccr.2014.07.014 [PubMed]
- 15. Witzel II, Koh LF, Perkins ND. Regulation of cyclin D1 gene expression. Biochem Soc Trans. 2010; 38:217–22. https://doi.org/10.1042/BST0380217 [PubMed]
- 16. Lundberg A, Lindström LS, Li J, Harrell JC, Darai-Ramqvist E, Sifakis EG, Foukakis T, Perou CM, Czene K, Bergh J, Tobin NP. The long-term prognostic and predictive capacity of cyclin D1 gene amplification in 2305 breast tumours. Breast Cancer Res. 2019; 21:34. https://doi.org/10.1186/s13058-019-1121-4 [PubMed]
- 17. Wang J, Wang N, Li ZJ, Yang LJ, Jing YG, Cheng JM, Li J. Identification of key genes and construction of microRNA-mRNA regulatory networks in non-small cell lung cancer. Cancer Genet. 2018; 228-229:47–54. https://doi.org/10.1016/j.cancergen.2018.08.003 [PubMed]
- 18. Seiler R, Thalmann GN, Rotzer D, Perren A, Fleischmann A. CCND1/CyclinD1 status in metastasizing bladder cancer: a prognosticator and predictor of chemotherapeutic response. Mod Pathol. 2014; 27:87–95. https://doi.org/10.1038/modpathol.2013.125 [PubMed]
- 19. Li Y, Wei J, Xu C, Zhao Z, You T. Prognostic significance of cyclin D1 expression in colorectal cancer: a meta-analysis of observational studies. PLoS One. 2014; 9:e94508. https://doi.org/10.1371/journal.pone.0094508 [PubMed]
- 20. He Y, Liu Z, Qiao C, Xu M, Yu J, Li G. Expression and significance of Wnt signaling components and their target genes in breast carcinoma. Mol Med Rep. 2014; 9:137–43. https://doi.org/10.3892/mmr.2013.1774 [PubMed]
- 21. Piali L, Hammel P, Uherek C, Bachmann F, Gisler RH, Dunon D, Imhof BA. CD31/PECAM-1 is a ligand for alpha v beta 3 integrin involved in adhesion of leukocytes to endothelium. J Cell Biol. 1995; 130:451–60. https://doi.org/10.1083/jcb.130.2.451 [PubMed]
- 22. Ilhan-Mutlu A, Siehs C, Berghoff AS, Ricken G, Widhalm G, Wagner L, Preusser M. Expression profiling of angiogenesis-related genes in brain metastases of lung cancer and melanoma. Tumour Biol. 2016; 37:1173–82. https://doi.org/10.1007/s13277-015-3790-7 [PubMed]
- 23. Avtanski D, Garcia A, Caraballo B, Thangeswaran P, Marin S, Bianco J, Lavi A, Poretsky L. Resistin induces breast cancer cells epithelial to mesenchymal transition (EMT) and stemness through both adenylyl cyclase-associated protein 1 (CAP1)-dependent and CAP1-independent mechanisms. Cytokine. 2019; 120:155–64. https://doi.org/10.1016/j.cyto.2019.04.016 [PubMed]
- 24. Xie F, Ling L, van Dam H, Zhou F, Zhang L. TGF-β signaling in cancer metastasis. Acta Biochim Biophys Sin (Shanghai). 2018; 50:121–32. https://doi.org/10.1093/abbs/gmx123 [PubMed]
- 25. Massagué J. TGFβ signalling in context. Nat Rev Mol Cell Biol. 2012; 13:616–30. https://doi.org/10.1038/nrm3434 [PubMed]
- 26. Katsuno Y, Lamouille S, Derynck R. TGF-β signaling and epithelial-mesenchymal transition in cancer progression. Curr Opin Oncol. 2013; 25:76–84. https://doi.org/10.1097/CCO.0b013e32835b6371 [PubMed]
- 27. Heldin CH, Vanlandewijck M, Moustakas A. Regulation of EMT by TGFβ in cancer. FEBS Lett. 2012; 586:1959–70. https://doi.org/10.1016/j.febslet.2012.02.037 [PubMed]
- 28. Moustakas A, Heldin CH. Signaling networks guiding epithelial-mesenchymal transitions during embryogenesis and cancer progression. Cancer Sci. 2007; 98:1512–20. https://doi.org/10.1111/j.1349-7006.2007.00550.x [PubMed]
- 29. Xu J, Lamouille S, Derynck R. TGF-beta-induced epithelial to mesenchymal transition. Cell Res. 2009; 19:156–72. https://doi.org/10.1038/cr.2009.5 [PubMed]
- 30. Hu Z, Gupta J, Zhang Z, Gerseny H, Berg A, Chen YJ, Zhang Z, Du H, Brendler CB, Xiao X, Pienta KJ, Guise T, Lee C, et al. Systemic delivery of oncolytic adenoviruses targeting transforming growth factor-β inhibits established bone metastasis in a prostate cancer mouse model. Hum Gene Ther. 2012; 23:871–82. https://doi.org/10.1089/hum.2012.040 [PubMed]
- 31. Kang Y, He W, Tulley S, Gupta GP, Serganova I, Chen CR, Manova-Todorova K, Blasberg R, Gerald WL, Massagué J. Breast cancer bone metastasis mediated by the Smad tumor suppressor pathway. Proc Natl Acad Sci USA. 2005; 102:13909–14. https://doi.org/10.1073/pnas.0506517102 [PubMed]
- 32. Ferrario A. Time to Entry for New Cancer Medicines: From European Union-Wide Marketing Authorization to Patient Access in Belgium, Estonia, Scotland, and Sweden. Value Health. 2018; 21:809–21. https://doi.org/10.1016/j.jval.2018.01.003 [PubMed]
- 33. Bartscht T, Rosien B, Rades D, Kaufmann R, Biersack H, Lehnerta H, Ungefroren H. Inhibition of TGF-β Signaling in Tumor Cells by Small Molecule Src Family Kinase Inhibitors. Anticancer Agents Med Chem. 2017; 17:1351–56. https://doi.org/10.2174/1871520617666170103094946 [PubMed]
- 34. Logan CY, Nusse R. The Wnt signaling pathway in development and disease. Annu Rev Cell Dev Biol. 2004; 20:781–810. https://doi.org/10.1146/annurev.cellbio.20.010403.113126 [PubMed]
- 35. Rosenbluh J, Wang X, Hahn WC. Genomic insights into WNT/β-catenin signaling. Trends Pharmacol Sci. 2014; 35:103–09. https://doi.org/10.1016/j.tips.2013.11.007 [PubMed]
- 36. MacDonald BT, Tamai K, He X. Wnt/beta-catenin signaling: components, mechanisms, and diseases. Dev Cell. 2009; 17:9–26. https://doi.org/10.1016/j.devcel.2009.06.016 [PubMed]
- 37. Niehrs C. The complex world of WNT receptor signalling. Nat Rev Mol Cell Biol. 2012; 13:767–79. https://doi.org/10.1038/nrm3470 [PubMed]
- 38. Wang JM, Huang FC, Kuo MH, Wang ZF, Tseng TY, Chang LC, Yen SJ, Chang TC, Lin JJ. Inhibition of cancer cell migration and invasion through suppressing the Wnt1-mediating signal pathway by G-quadruplex structure stabilizers. J Biol Chem. 2014; 289:14612–23. https://doi.org/10.1074/jbc.M114.548230 [PubMed]
- 39. Lee MA, Park JH, Rhyu SY, Oh ST, Kang WK, Kim HN. Wnt3a expression is associated with MMP-9 expression in primary tumor and metastatic site in recurrent or stage IV colorectal cancer. BMC Cancer. 2014; 14:125. https://doi.org/10.1186/1471-2407-14-125 [PubMed]
- 40. Asad M, Wong MK, Tan TZ, Choolani M, Low J, Mori S, Virshup D, Thiery JP, Huang RY. FZD7 drives in vitro aggressiveness in Stem-A subtype of ovarian cancer via regulation of non-canonical Wnt/PCP pathway. Cell Death Dis. 2014; 5:e1346. https://doi.org/10.1038/cddis.2014.302 [PubMed]
- 41. Bernemann C, Hülsewig C, Ruckert C, Schäfer S, Blümel L, Hempel G, Götte M, Greve B, Barth PJ, Kiesel L, Liedtke C. Influence of secreted frizzled receptor protein 1 (SFRP1) on neoadjuvant chemotherapy in triple negative breast cancer does not rely on WNT signaling. Mol Cancer. 2014; 13:174. https://doi.org/10.1186/1476-4598-13-174 [PubMed]
- 42. Xi Y, Chen Y. Wnt signaling pathway: implications for therapy in lung cancer and bone metastasis. Cancer Lett. 2014; 353:8–16. https://doi.org/10.1016/j.canlet.2014.07.010 [PubMed]
- 43. Okkenhaug K, Graupera M, Vanhaesebroeck B. Targeting PI3K in Cancer: Impact on Tumor Cells, Their Protective Stroma, Angiogenesis, and Immunotherapy. Cancer Discov. 2016; 6:1090–105. https://doi.org/10.1158/2159-8290.CD-16-0716 [PubMed]
- 44. Hanahan D, Weinberg RA. Hallmarks of cancer: the next generation. Cell. 2011; 144:646–74. https://doi.org/10.1016/j.cell.2011.02.013 [PubMed]
- 45. Irizarry RA, Hobbs B, Collin F, Beazer-Barclay YD, Antonellis KJ, Scherf U, Speed TP. Exploration, normalization, and summaries of high density oligonucleotide array probe level data. Biostatistics. 2003; 4:249–64. https://doi.org/10.1093/biostatistics/4.2.249 [PubMed]
- 46. Gautier L, Cope L, Bolstad BM, Irizarry RA. affy—analysis of Affymetrix GeneChip data at the probe level. Bioinformatics. 2004; 20:307–15. https://doi.org/10.1093/bioinformatics/btg405 [PubMed]
- 47. Huang DW, Sherman BT, Tan Q, Collins JR, Alvord WG, Roayaei J, Stephens R, Baseler MW, Lane HC, Lempicki RA. The DAVID Gene Functional Classification Tool: a novel biological module-centric algorithm to functionally analyze large gene lists. Genome Biol. 2007; 8:R183. https://doi.org/10.1186/gb-2007-8-9-r183 [PubMed]
- 48. Kanehisa M. The KEGG database. Novartis Found Symp. 2002; 247:91–101. [PubMed]
- 49. Ashburner M, Ball CA, Blake JA, Botstein D, Butler H, Cherry JM, Davis AP, Dolinski K, Dwight SS, Eppig JT, Harris MA, Hill DP, Issel-Tarver L, et al, and The Gene Ontology Consortium. Gene ontology: tool for the unification of biology. Nat Genet. 2000; 25:25–29. https://doi.org/10.1038/75556 [PubMed]
- 50. Asplund A, Edqvist PH, Schwenk JM, Pontén F. Antibodies for profiling the human proteome-The Human Protein Atlas as a resource for cancer research. Proteomics. 2012; 12:2067–77. https://doi.org/10.1002/pmic.201100504 [PubMed]
- 51. Szklarczyk D, Gable AL, Lyon D, Junge A, Wyder S, Huerta-Cepas J, Simonovic M, Doncheva NT, Morris JH, Bork P, Jensen LJ, Mering CV. STRING v11: protein-protein association networks with increased coverage, supporting functional discovery in genome-wide experimental datasets. Nucleic Acids Res. 2019; 47:D607–13. https://doi.org/10.1093/nar/gky1131 [PubMed]
- 52. Smoot ME, Ono K, Ruscheinski J, Wang PL, Ideker T. Cytoscape 2.8: new features for data integration and network visualization. Bioinformatics. 2011; 27:431–32. https://doi.org/10.1093/bioinformatics/btq675 [PubMed]
- 53. Bandettini WP, Kellman P, Mancini C, Booker OJ, Vasu S, Leung SW, Wilson JR, Shanbhag SM, Chen MY, Arai AE. MultiContrast Delayed Enhancement (MCODE) improves detection of subendocardial myocardial infarction by late gadolinium enhancement cardiovascular magnetic resonance: a clinical validation study. J Cardiovasc Magn Reson. 2012; 14:83. https://doi.org/10.1186/1532-429X-14-83 [PubMed]
- 54. Cerami E, Gao J, Dogrusoz U, Gross BE, Sumer SO, Aksoy BA, Jacobsen A, Byrne CJ, Heuer ML, Larsson E, Antipin Y, Reva B, Goldberg AP, et al. The cBio cancer genomics portal: an open platform for exploring multidimensional cancer genomics data. Cancer Discov. 2012; 2:401–04. https://doi.org/10.1158/2159-8290.CD-12-0095 [PubMed]
- 55. Bindea G, Mlecnik B, Hackl H, Charoentong P, Tosolini M, Kirilovsky A, Fridman WH, Pagès F, Trajanoski Z, Galon J. ClueGO: a Cytoscape plug-in to decipher functionally grouped gene ontology and pathway annotation networks. Bioinformatics. 2009; 25:1091–93. https://doi.org/10.1093/bioinformatics/btp101 [PubMed]
- 56. Bindea G, Galon J, Mlecnik B. CluePedia Cytoscape plugin: pathway insights using integrated experimental and in silico data. Bioinformatics. 2013; 29:661–63. https://doi.org/10.1093/bioinformatics/btt019 [PubMed]
- 57. Rhodes DR, Yu J, Shanker K, Deshpande N, Varambally R, Ghosh D, Barrette T, Pandey A, Chinnaiyan AM. ONCOMINE: a cancer microarray database and integrated data-mining platform. Neoplasia. 2004; 6:1–6. https://doi.org/10.1016/S1476-5586(04)80047-2 [PubMed]
- 58. Xu WH, Xu Y, Wang J, Wan FN, Wang HK, Cao DL, Shi GH, Qu YY, Zhang HL, Ye DW. Prognostic value and immune infiltration of novel signatures in clear cell renal cell carcinoma microenvironment. Aging (Albany NY). 2019; 11:6999–7020. https://doi.org/10.18632/aging.102233 [PubMed]