


Introduction
Alzheimer’s disease (AD) is the most common type of dementia with an incidence of 60% to 80% [1]. In addition to the recognized risk factors of AD, including age, sex, apolipoprotein E4 (APOE Ɛ4) phenotype, and low education level, the influence of metabolic syndrome (Mets) related factors such as hypertension, type 2 diabetes mellitus (T2DM), dyslipidemia on AD has also begun to be emphasized. Studies have shown that unhealthy metabolic status has a significant impact on brain health and also increases the risk of AD [2–5]. At the same time, several studies showed that obesity at midlife independently increases the risk of AD, while in later life it reduces the risk [6–9].
As overweight/obesity and Mets often coexist, both are used to define the risk of poor health outcomes for overweight/obese individuals and divide subjects into four body mass index-metabolic status phenotype groups: metabolically healthy normal weight (MHNW), metabolically healthy overweight/obese (MHO), metabolically unhealthy normal weight (MUNW), metabolically unhealthy overweight/obesity (MUO) [10]. A subgroup of overweight/obese individuals, who had favorable metabolic profiles such as normal glucose and blood pressure and were free of dyslipidemia, were termed as MHO. Several studies suggested that MHO individuals are overweight/obese but they meet none of the Mets criteria except for body mass index (BMI) or waist circumference [11]. Meanwhile, it has been suggested that MHO individuals were at different risk of AD compared to the MUO group which already has metabolic and obesity problems, although obesity is associated with higher cardiac metabolic risk [12]. Several studies suggested that MHO individuals were not at increased risk of cardiovascular disease and all-course mortality [13, 14]. And MHO individuals showed high insulin sensitivity as well as favorable lipid, inflammation, hormones, liver enzymes and immune status [15]. At present, the study of BMI-metabolic status phenotypes has rarely involved AD. A large-scale population-based cohort study in South Korea has found that MHO subjects had a protective tendency [16]. However, whether MHO is associated with excess risk of AD in the European elderly remains unclear.
In our research, we explored the impact of the MHO phenotype on the development of AD in the elderly. Apart from that, we wonder if the effects of overweight/obesity on elders with different metabolic states are consistent since MUO subjects did not show a protective tendency in previous studies [16]. Furthermore, we make the assumption that BMI-metabolic status phenotypes have differences in their AD-related biomarkers to explore possible mechanisms whereby MHO affects the occurrence of AD.
Results
Baseline characteristics of the study population
Table 1 shows the baseline characteristics of the participants included in the analysis, results of post hoc multiple comparisons are shown in Supplementary Table 1. The mean age was 73.5 ± 7.1 years and the mean BMI was 27.0 ± 4.7 kg/m2. Among the 1199 participants, 495 (41.3%) were classified as metabolically unhealthy. The MHO group was the youngest (72.8 ± 7.3 years). The metabolically unhealthy groups have higher blood pressure, fasting glucose, triglyceride (TG), and low-density lipoprotein cholesterol (LDL-C) levels, while high-density lipoprotein cholesterol (HDL-C) was higher in the metabolically healthy groups. In terms of medical history, the MUO group showed the highest proportion of hypertension, T2DM, and previous myocardial infarction.
Table 1. Baseline characteristics of study participants according to body mass index-metabolic status phenotypes.
| Characteristic | Metabolically healthy(n=704) | Metabolically unhealthy(n=495) | P Value | ||||||||||||||||||||||||||||||||||||||||||||||||||||||||||||||||||||||||||||||||||||||||||||||||
| MHNW (n=289) | MHO(n=415) | MUNW (n=132) | MUO (n=363) | ||||||||||||||||||||||||||||||||||||||||||||||||||||||||||||||||||||||||||||||||||||||||||||||||
| Age, y | 73.5±7.4 | 72.8±7.3 | 76.5±6.3 | 73.2±6.7 | <0.001 | ||||||||||||||||||||||||||||||||||||||||||||||||||||||||||||||||||||||||||||||||||||||||||||||
| M/F, n | 146/143 | 242/173 | 57/75 | 227/136 | <0.001 | ||||||||||||||||||||||||||||||||||||||||||||||||||||||||||||||||||||||||||||||||||||||||||||||
| Formal education, y | 16.6±2.7 | 16.0±2.8 | 16.0±2.8 | 15.7±2.8 | 0.002 | ||||||||||||||||||||||||||||||||||||||||||||||||||||||||||||||||||||||||||||||||||||||||||||||
| Cognitive diagnosis | |||||||||||||||||||||||||||||||||||||||||||||||||||||||||||||||||||||||||||||||||||||||||||||||||||
| Normal control | 89(30.8) | 138(33.3) | 55(41.7) | 120(33.1) | |||||||||||||||||||||||||||||||||||||||||||||||||||||||||||||||||||||||||||||||||||||||||||||||
| Mild cognitive impairment | 200(69.2) | 277(66.7) | 77(58.3) | 243(66.9) | 0.176 | ||||||||||||||||||||||||||||||||||||||||||||||||||||||||||||||||||||||||||||||||||||||||||||||
| APOEε4 Carriers | 142 (49) | 157 (36) | 54 (41) | 157 (43) | 0.028 | ||||||||||||||||||||||||||||||||||||||||||||||||||||||||||||||||||||||||||||||||||||||||||||||
| Weight, kg | 65.9±9.9 | 82.1±12.0 | 65.3±9.7 | 86.2±15.1 | <0.001 | ||||||||||||||||||||||||||||||||||||||||||||||||||||||||||||||||||||||||||||||||||||||||||||||
| Height, cm | 169.9±10.2 | 168.9±10.3 | 168.9±11.3 | 169.5±10.5 | 0.590 | ||||||||||||||||||||||||||||||||||||||||||||||||||||||||||||||||||||||||||||||||||||||||||||||
| BMI, kg/m2 | 22.7±1.6 | 28.8±3.7 | 22.8±1.7 | 30.0±4.4 | <0.001 | ||||||||||||||||||||||||||||||||||||||||||||||||||||||||||||||||||||||||||||||||||||||||||||||
| Systolic BP, mmHg | 130.7±18.0 | 132.9±15.8 | 142.0±17.2 | 139.5±15.4 | <0.001 | ||||||||||||||||||||||||||||||||||||||||||||||||||||||||||||||||||||||||||||||||||||||||||||||
| Diastolic BP, mmHg | 73.3±9.9 | 75.6±9.8 | 74.2±10.0 | 76.3±9.1 | <0.001 | ||||||||||||||||||||||||||||||||||||||||||||||||||||||||||||||||||||||||||||||||||||||||||||||
| Fasting glucose, mg/dl | 93.0±13.9 | 93.6±13.8 | 110.8±28.2 | 113.4±32.4 | <0.001 | ||||||||||||||||||||||||||||||||||||||||||||||||||||||||||||||||||||||||||||||||||||||||||||||
| Triglyceride, mmol/L | 1.0±0.3 | 1.1±0.4 | 1.2±0.5 | 1.3±0.5 | <0.001 | ||||||||||||||||||||||||||||||||||||||||||||||||||||||||||||||||||||||||||||||||||||||||||||||
| HDL-C, mmol/L | 1.6±0.3 | 1.5±0.3 | 1.5±0.4 | 1.3±0.3 | <0.001 | ||||||||||||||||||||||||||||||||||||||||||||||||||||||||||||||||||||||||||||||||||||||||||||||
| LDL-C, mmol/L | 1.4±0.4 | 1.3±0.4 | 1.4±0.4 | 1.3±0.4 | <0.001 | ||||||||||||||||||||||||||||||||||||||||||||||||||||||||||||||||||||||||||||||||||||||||||||||
| Smoker | 84(29.1) | 135(32.5) | 35(26.5) | 100(27.5) | 0.380 | ||||||||||||||||||||||||||||||||||||||||||||||||||||||||||||||||||||||||||||||||||||||||||||||
| Drinker | 10(3.5) | 13(3.1) | 3(2.3) | 10(2.8) | 0.910 | ||||||||||||||||||||||||||||||||||||||||||||||||||||||||||||||||||||||||||||||||||||||||||||||
| Medical history | |||||||||||||||||||||||||||||||||||||||||||||||||||||||||||||||||||||||||||||||||||||||||||||||||||
| Hypertension | 85(29.4) | 159(38.3) | 81(61.4) | 241(66.4) | <0.001 | ||||||||||||||||||||||||||||||||||||||||||||||||||||||||||||||||||||||||||||||||||||||||||||||
| T2DM | 5(1.7) | 8(1.9) | 23(17.4) | 84(23.1) | <0.001 | ||||||||||||||||||||||||||||||||||||||||||||||||||||||||||||||||||||||||||||||||||||||||||||||
| Previous myocardial infarction | 13(4.5) | 28(6.7) | 3(2.3) | 32(8.8) | 0.190 | ||||||||||||||||||||||||||||||||||||||||||||||||||||||||||||||||||||||||||||||||||||||||||||||
| Values are mean±standard deviation(SD), or n (% of the group). | |||||||||||||||||||||||||||||||||||||||||||||||||||||||||||||||||||||||||||||||||||||||||||||||||||
| Abbreviations: MHNW, metabolically healthy normal weight; MHO, metabolically healthy overweight/obese; MUNW, metabolically unhealthy normal weight; MUO, metabolically unhealthy overweight/obese; M, male; F, female; APOEε4, apolipoprotein E4; BMI, body mass index; BP, blood pressure; HDL-C, high-density lipoprotein cholesterol; LDL-C, low- density lipoprotein cholesterol; T2DM, type 2 diabetes mellitus. | |||||||||||||||||||||||||||||||||||||||||||||||||||||||||||||||||||||||||||||||||||||||||||||||||||
Risk of incident AD according to different BMI-metabolic status phenotypes
A total of 321 (26.8%) participants developed AD during the follow-up. It is worth noting that the MHO group showed significantly lower AD incidence (21.7%) compared with the MHNW reference group (30.8%). As expected, compared with the normal weight group, the overweight/obese group were at a reduced risk of incident AD (HR=0.70, 95% CI: 0.56-0.89), after adjustment for age, sex, APOE Ɛ4 status, cognitive diagnosis, education, tobacco and alcohol use, LDL-C and metabolic status. Risk in the metabolically unhealthy group (HR=1.28, 95% CI: 1.02-1.60) was 1.28 times higher than that in the metabolically healthy group after further adjustment for BMI status.
The Kaplan-Meier curves for cumulative survival free from, incident AD as a function of BMI-metabolic status phenotypes showed that these survival curves differ significantly from each other over the follow-up (log-rank, P = 0.02). Unadjusted and adjusted HRs and 95% CIs of AD compared with MHNW group, according to BMI-metabolic status phenotypes are listed in Table 2.
Table 2. HRs of Alzheimer’s disease according to body mass index-metabolic status phenotypes.
| MHNW | MUNW | MHO | MUO | ||||||||||||||||||||||||||||||||||||||||||||||||||||||||||||||||||||||||||||||||||||||||||||||||
| Model1* | 1(ref) | 1.09(0.75-1.57) | 0.67(0.50-0.90) | 0.89(0.65-1.15) | |||||||||||||||||||||||||||||||||||||||||||||||||||||||||||||||||||||||||||||||||||||||||||||||
| Model2† | 1(ref) | 1.22(0.84-1.78) | 0.73(0.54-0.97) | 0.93(0.70-1.24) | |||||||||||||||||||||||||||||||||||||||||||||||||||||||||||||||||||||||||||||||||||||||||||||||
| Model3‡ | 1(ref) | 1.22(0.84-1.78) | 0.73(0.54-0.97) | 0.93(0.70-1.24) | |||||||||||||||||||||||||||||||||||||||||||||||||||||||||||||||||||||||||||||||||||||||||||||||
| Abbreviations: MHNW, metabolically healthy normal weight; MUNW, metabolically unhealthy normal weight; MHO, metabolically healthy overweight/obese; MUO, metabolically unhealthy overweight/obese. | |||||||||||||||||||||||||||||||||||||||||||||||||||||||||||||||||||||||||||||||||||||||||||||||||||
| *Unadjusted | |||||||||||||||||||||||||||||||||||||||||||||||||||||||||||||||||||||||||||||||||||||||||||||||||||
| †Adjusted for age, sex, APOEε4 status and cognitive diagnosis. | |||||||||||||||||||||||||||||||||||||||||||||||||||||||||||||||||||||||||||||||||||||||||||||||||||
| ‡Further adjusted for education, tobacco and alcohol use and low-density lipoprotein. | |||||||||||||||||||||||||||||||||||||||||||||||||||||||||||||||||||||||||||||||||||||||||||||||||||
We present the association between BMI and incident AD in analysis stratified by metabolic status category; the metabolically healthy group was the reference within each strata of BMI. Figure 1 shows the Kaplan-Meier curves for the cumulative proportion of individuals free of AD, in which MHO group had a lower probability of developing AD compared to MHNW group (log rank P=0.006), while the metabolically unhealthy group did not show this trend (log rank P=0.22). There was still a significant difference in AD risk between metabolically healthy groups after multivariable adjustment: compared with the MHNW group, the MHO group had a lower risk for AD (adjusted HR=0.73, 95% CI: 0.54-0.97, Model3). However, there was no significant difference between metabolically unhealthy groups after multivariable adjustment: compared with the MUNW group, the MUO group did not show a different risk (unadjusted HR=0.80, 95% CI: 0.56-1.16, Model1; adjusted HR= 0.75, 95% CI: 0.52-1.09, Model2; adjusted HR=0.75, 95% CI: 0.52-1.09, Model3). In addition, compared with MHO group, MHNW (adjusted HR=1.36, 95% CI: 1.02-1.83), MUNW (adjusted HR=1.72, 95% CI: 1.19-2.50), and MUO (adjusted HR=1.34, 95% CI: 1.01-1.78) groups all showed significant higher AD risks after adjustment for same factors as previous studies (Figure 2).
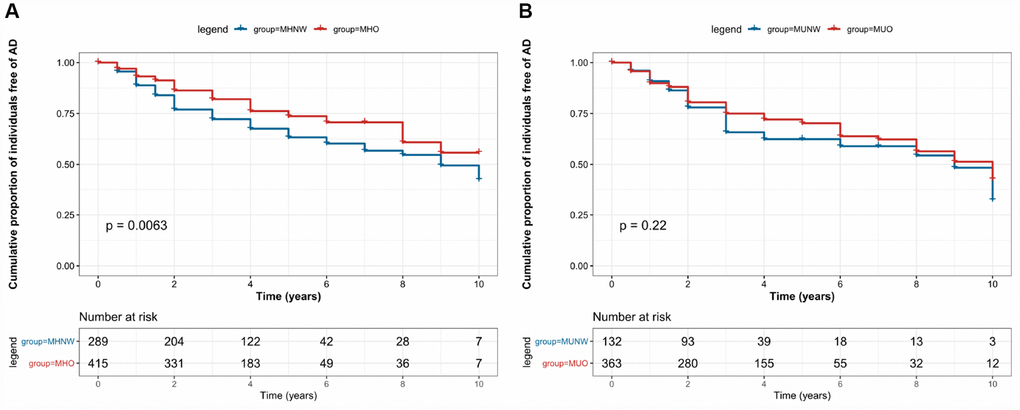
Figure 1. Kaplan–Meier survival curves showing the associations between body mass index-metabolic status phenotypes and the risk of Alzheimer’s disease.
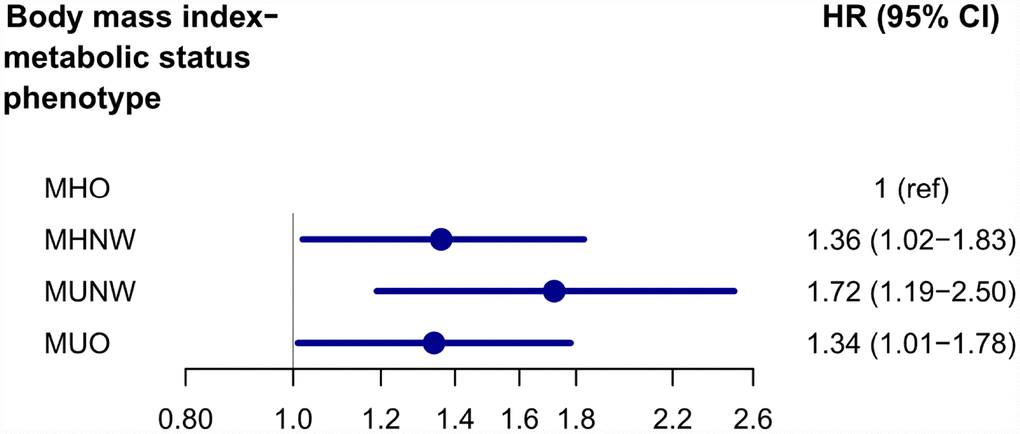
Figure 2. Adjusted* HRs and 95% Confidence Intervals of MHNW, MUNW and MUO groups with MHO group as reference. *Adjusted for age, sex, APOE Ɛ4 status, cognitive diagnosis, education, tobacco and alcohol use, and low-density lipoprotein cholesterol. Abbreviations: MHNW, metabolically healthy normal weight; MUNW, metabolically unhealthy normal weight; MHO, metabolically healthy overweight/obese; MUO, metabolically unhealthy overweight/obese.
BMI-metabolic status phenotypes and AD-related biomarkers
As for metabolically healthy groups, our results indicated that the MHO group was associated with higher cerebrospinal fluid (CSF)-Amyloid β (Aβ) (β=0.746, P=0.015) (Figure 3A) compared with the MHNW group. No statistical differences were observed in CSF total tau (t-tau) and phosphorylated tau (p-tau) between the two groups. There were differences in several brain regions of interest (ROIs) (whole brain, hippocampus, entorhinal, and middle temporal) between MHO and MHNW group in the unadjusted model. It is worth noting that the correlations of MHO with larger volume of whole brain (β=0.133, P=0.004) (Figure 3B) and hippocampus (β=0.181, P=0.011) (Figure 3C) remained significant in multiple linear regression analyses adjusting for age, sex, APOE status, cognitive diagnosis, education, tobacco and alcohol use, LDL and intracranial volume. All these associations still achieved significance after false discovery rate (FDR) correction. No difference was detected between MUO and MUNW groups in cortical thickness and florbetapir cortical standardized uptake values ratios (SUVRs).
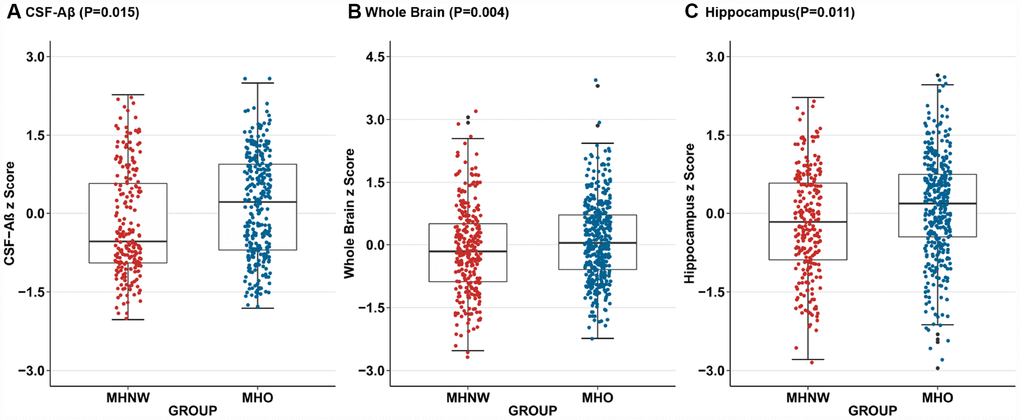
Figure 3. Adjusted for age, sex, APOE Ɛ4 status, cognitive diagnosis, education, tobacco and alcohol use, and low-density lipoprotein cholesterol, compared to MHNW group, MHO group had higher CSF-Aβ concentrations(P=0.015) (A) on the baseline as well as larger whole brain volumes(P=0.004) (B) and hippocampal volumes (P=0.011) (C) after additional correction for the intracranial volume. Abbreviations: MHNW, metabolically healthy normal weight; MHO, metabolically healthy overweight/obese; CSF, cerebrospinal fluid; Aβ, Amyloid β.
As for metabolically unhealthy groups, we did not observe any difference in CSF biomarkers between MUNW and MUO groups. However, in the unadjusted linear regression model, MUO group presented a correlation with higher volumes of whole brain (β =0.000, p = 0.002), hippocampus (β = 0.038, p = 0.001), and entorhinal (β = 0.019, p = 0.012) compared with MUNW group, which failed to reduplicate in further analysis adjusted for age, sex, APOE Ɛ4 status, cognitive diagnosis, education, tobacco and alcohol use, LDL and intracranial volume (whole brain: β =0.028, p=0.028 and hippocampus: β =0.144, p =0.117 and entorhinal: β =0.209, p=0.041). Similarly, no difference was detected between MUO and MUNW groups in cortical thickness and SUVRs. Detailed unadjusted and adjusted β coefficients and p-values in four subgroups were listed in Supplementary Table 2.
Discussion
In this longitudinal study of 1199 individuals initially free of AD, 321 developed AD during an average follow-up. Previous studies investigating the associations of AD with obesity and unhealthy metabolic profiles reported that late-life obesity reduced the risk and metabolically unhealthy individuals had an increased risk. Our results showed that after correcting for the metabolic state, the risk of AD in elderly obese individuals was significantly reduced (HR=0.70, 95% CI: 0.56-0.89), and the risk of metabolic abnormalities increased after correcting for the obese status (HR=1.28, 95% CI: 1.02-1.60), which is in line with the results of previous studies [17]. In addition, we analyzed the risk of incident AD according to late-life BMI-metabolic status phenotypes. The results showed that MHO individuals had a lower risk for AD compared with the MHNW group. This protective tendency was not observed in MUO individuals compared with the MUNW group. A large-scale population-based cohort study previously reported the association between BMI-metabolic status phenotypes and the risk of AD. It showed an increased risk of AD in the MUO group, which was inconsistent with our results [16]. However, the effect of APOE Ɛ4 status has not been corrected for in this study. We had carefully adjusted for most confounding variables, especially APOE Ɛ4 status which had a significant impact on the risk of AD. Therefore, we believed that the risk of AD in MUO group cannot be fully determined and deserves further population studies.
Most previous studies on obesity did not separate metabolically healthy individuals from metabolically unhealthy individuals [18]. However, the effects of metabolic status cannot be ignored, because obesity and unhealthy metabolic states can exist independently, which means that it is necessary to study the effects of obesity on AD in different metabolic states [10]. Our results broke the “obesity paradox” to some extent, in which overweight and obese individuals are pretending to have lower mortality in various established studies [19–21]. Therefore, the emphases on the influence of metabolic status and early management of high BMI elder individuals with metabolic abnormalities may be beneficial in the prevention of AD events.
In this study, we further examined the relationship between BMI-metabolic status phenotypes and AD-related biomarkers in this non-dementia sample. We now found MHO was positively associated with CSF-Aβ pathology and this association remained significant after controlling for several possible confounders. We did not find evidence for a significant relationship between MHO and tau pathology in the CSF. Our study also demonstrated that MHO showed suggestive associations with hippocampal and whole brain volumes. We did not find associations between MUO individuals and any AD-related biomarkers. The results of our study also suggested a likely mechanism of overweight/obesity in preventing the onset of AD dementia when metabolism is normal. Although Aβ plays an upstream role in the pathogenesis of AD, Aβ alone is insufficient to cause the onset of clinically detected dementia directly. However, this may be sufficient to cause downstream pathophysiologic changes such as brain atrophy that ultimately led to AD dementia [22]. We speculated that in metabolically healthy individuals, overweight/obesity influenced Aβ pathology first, and subsequently reduced downstream brain atrophy rate and the risk of AD dementia.
There are many possible mechanisms that explain the beneficial effects of MHO on the development of AD dementia. A decline in the levels of plasma insulin-like growth factor I (IGF-1), which has been shown to be an independent risk factor for AD [23], was observed in the underweight group [24]. IGF-1 exerted neurotrophic effects on the hippocampus, and high levels of IGF-1 were associated with better cognitive performance [25]. In addition, certain adipokines secreted by adipose tissue, such as leptin, may play a key role [26]. A higher circulating leptin level is associated with better cognitive performance, a lower incidence of AD dementia and larger volumes of brain regions, such as the hippocampus [18, 27]. The results of previous studies also indicated that MHO individuals have fewer years of obesity than their MUO counterparts [28]. Evidence showed that MHO individuals had certain advantages in metabolism and other aspects compared with the MUO population, which may affect the occurrence of AD. Results from previous studies suggested that MUO individuals have been overweight/obese for longer years compared to MHO individuals [28]. Despite having a high accumulation of body fat, MHO individuals display lower levels of C-reactive protein [29], higher adiponectin concentrations [30], higher insulin sensitivity [31], and a lower risk of type 2 diabetes. Therefore, the estimation of AD risk in elderly obese people cannot ignore the impact of different metabolic statuses.
It is worth noting that this study has some limitations. First, BMI or metabolic status in a certain proportion of participants will change over time, but our study did not reflect longitudinal changes in body weight or laboratory results. Second, current research on AD-related biomarkers is based on cross-sectional data, which do not represent individual longitudinal changes. Third, the study is limited to the ADNI cohort, which is not a population-based cohort. Nevertheless, studies including larger samples are needed to further examine the effects of MHO.
In conclusion, we showed different risks of AD in elderly overweight/obese individuals with different metabolism statuses. The MHO phenotype conferred a lower risk of AD when compared with MHNW or MUO. The protective effect of overweight/obesity in the presence of metabolic abnormalities was not apparent compared with MUNW. Metabolic abnormalities in the elderly should not be neglected. Further studies in other populations are warranted, to better understand the effects of metabolic status and obesity on AD.
Materials and Methods
Participants
Data used in this study was obtained from the ADNI database (adni.loni.usc.edu), which was launched in 2003 as a public-private partnership led by Principal Investigator Michael W. Weiner, MD. The primary goal of ADNI has been to test whether serial MRI, PET, other biological markers, and clinical and neuropsychological assessments can be combined to measure the progression of MCI and early AD [32]. Regional ethical committees of all participating institutions approved the ADNI. Individuals were excluded if they had Hachinski ischemic score > 4 (a high risk of cerebrovascular disease contributing to cognitive impairment), were unable to undergo MRI, had other neurologic disorders, active depression, history of psychiatric diagnosis, alcohol or substance dependence in the last 2 years, had less than 6 years of education, or were not fluent in English or Spanish [33]. All study participants provided written informed consent. For up-to-date information, see www.adni-info.org.
A total of 1199 individuals (normal controls [CN]=402, mild cognitive impairment [MCI]=797 at baseline) with an average age of 73.5 years, and at least 6 years of education were included in this study. Those with severe cerebrovascular disease have been excluded before being enrolled in the ADNI. We excluded participants whose data on baseline BMI, metabolic status phenotypes were missing. For the current analysis, underweight (BMI < 18.5 kg/m2) participants (n=9) were excluded.
Measurement of laboratory and anthropometric parameters
All data on laboratory and anthropometric parameters, as well as medical history are downloaded from the ADNI database. Calibrated mercury sphygmo-manometer and blood pressure cuff are used to measure arterial blood pressure. During the blood pressure measurement, participants were seated with their forearms placed horizontally in the four rib spaces of the sternum (i.e. the level of the heart) [34]. TG, HDL-C, and LDL-C, and fasting venous blood glucose were measured. BMI was calculated by dividing body weight (in kg) by height squared (in m2). In the APOE Ɛ4 genotyping performed at the ADNI Biomarker Core Laboratory (University of Pennsylvania), participants carrying at least one allele were identified as APOE Ɛ4 positive status [35]. We identified the baseline comorbidities, including hypertension, T2DM, and previous myocardial infarction, by screening the medical information database. Self-reported health behaviors included smoking status (categorized as yes or no, both previous and current smokers are identified as yes) and alcohol consumption which is grouped in the same way.
Definitions of BMI-metabolic status phenotypes
We used standard operating protocols to measure ATP-III components to define metabolic status [36]. Participants who met ≥2 of the following four parameters were defined as metabolically unhealthy : 1) elevated systolic blood pressure (≥130 mmHg) or diastolic blood pressure (≥85 mmHg) or anti-hypertensive treatment; 2) elevated fasting plasma glucose (≥ 100 mg/dL) or anti-diabetic treatment; 3) elevated TG (≥1.7 mmol/L); 4) reduced HDL-C (<1.0 mmol/L for men and <1.3 mmol/L for women). BMI was used to determine obese phenotypes according to world health organization criteria: overweight/obese ≥25 kg/m2, normal weight <25 kg/m2 [37]. The waist circumference criterion was not used because of its collinearity with BMI.
Participants were categorized into the following groups: 1) MHNW: BMI < 25 kg/m2 and <2 metabolic risk factors; 2) MHO: BMI ≥ 25kg/m2 and <2 metabolic risk factors; 3) MUNW: BMI < 25 kg/m2 and ≥2 metabolic risk factors; 4) MUO: BMI ≥ 25 kg/m2 and ≥2 metabolic risk factors.
Definition of incident AD
The primary endpoint was newly diagnosed AD during the follow-up period. AD patients were required to meet the criteria for probable AD defined by the National Institute of Neurological and Communicative Disorders and Stroke–Alzheimer’s Disease and Related Disorders Association [38]. In brief, AD group had a Mini-Mental State Examination (MMSE) score of 20-26 where lower scores suggest severe cognitive impairment (range, 0–30), and a Clinical Dementia Rating (CDR) score of 0.5 to 1.0 where lower scores indicate mild cognitive impairment (range, 0–3) [33]. Participants without AD during the follow-up period were classified as missing or not having observed outcomes, depending on the circumstances.
CSF data
A multiplex xMAP Luminex platform (Luminex Corp, Austin, TX) with Innogenetics (INNO-BIA AlzBio3, Ghent, immunoassay kit-based reagents Belgium; for research use only reagents) was used to collect and analyze samples, including CSF Aβ42, CSF t-tau, and CSF p-tau (pg/mL). Details have been described previously [39].
Neuroimaging data
The neuroimaging data, such as regional volume, cortical thickness on MRI and SUVRs via F18-PET-AV45 were all downloaded from the ADNI dataset. Preprocessed data are available online (adni.loni.ucla.edu/about-data samples/image-data/). Details on neuroimaging methods utilized by ADNI have been described previously [40]. In brief, FreeSurfer (version 5.1) was used to extract volumetric and cortical thickness data after correcting the scans. After removing the non-brain tissue using a hybrid watershed/surface deformation, automated Talairach transformation was used for segmentation of subcortical white matter and deep gray matter volume structures [41]. For F18-PET-AV45, preprocessed florbetapir image data and co-registered structural magnetic resonance images were analyzed using Freesurfer software, version 4.5.0 (surfer.nmr.mgh.harvard.edu/) as described online (adni.loni.ucla.edu/research/ pet-post-processing/). The SUVRs, measured by the florbetapir AV45 standardized uptake value ratio, was normalized to the whole cerebellum as a summary measure of florbetapir retention for each participant [42]. In our study, we used differences in baseline data (ROIs, cortical thickness and SUVRs) in interesting regions such as the hippocampus, and entorhinal cortex, which had established roles in predicting AD risk and progression, to calculate differences in BMI-metabolic status phenotypes across the AD spectrum.
Statistical analysis
We used the Chi-Square test to explore the differences between baseline characteristics of categorized variables and used variance (ANOVA) to explore those for continuous variables. And performed post hoc multiple comparisons among four groups. The cumulative AD incidence for each group was plotted with Kaplan-Meier curves and the effects of obesity in normal and abnormal metabolic groups were compared by the log-rank test. Multivariable Cox proportional hazards regression analysis was performed to assess the risk of new-onset AD with different BMI-metabolic status phenotypes in 3 models: unadjusted model 1, model 2 adjusted for age, sex, APOE Ɛ4 status and cognitive diagnosis, and model 3 further adjusted for education, tobacco and alcohol use, and LDL-C. For each individual, the baseline time was defined by the ADNI database, and two endpoints were chosen: the time of AD diagnosis or the last follow-up time of participants. AD risk was expressed as the HR with 95% CI. In the first set of analyses, we used the MHNW group as the reference. We then ran a second set of analyses, stratified by metabolic category to compare the risk of AD as a function of BMI status in each category, the normal weight group, within each metabolic category, was the reference in these analyses.
To examine the effects of BMI-metabolic status phenotypes on the chosen AD-related biomarkers, we evaluated the association between BMI-metabolic status phenotypes and these various biomarkers using multiple linear regression models at baseline. These models assumed a random subject-specific intercept and a random subject-specific slope. Since all outcome variables were converted to normalized Z-scores, β coefficients refer to standardized effects. All tests were 2-sided and the criterion for statistical significance was p < 0.05 according to FDR correction. All regression analyses were adjusted for age, sex, APOE Ɛ4 status, cognitive diagnosis, education, tobacco and alcohol use, LDL-C, and intracranial volume or reference region. All statistical analyses were performed using a software program (R 3.5.1).
Supplementary Materials
Acknowledgments
This study was supported by grants from the National Natural Science Foundation of China (91849126, 81571245, and 81771148), the National Key R&D Program of China (2018YFC1314700), Qingdao Applied Basic Research Project (18-2-2-43-jch), Shanghai Municipal Science and Technology Major Project (No.2018SHZDZX01) and ZHANGJIANG LAB, Tianqiao and Chrissy Chen Institute, and the State Key Laboratory of Neurobiology and Frontiers Center for Brain Science of Ministry of Education, Fudan University. Data collection and sharing for this project was funded by the Alzheimer's Disease Neuroimaging Initiative (ADNI) (National Institutes of Health Grant U01 AG024904) and DOD ADNI (Department of Defense award number W81XWH-12-2-0012). ADNI is funded by the National Institute on Aging, the National Institute of Biomedical Imaging and Bioengineering, and through generous contributions from the following: AbbVie, Alzheimer’s Association; Alzheimer’s Drug Discovery Foundation; Araclon Biotech; BioClinica, Inc.; Biogen; Bristol-Myers Squibb Company; CereSpir, Inc.; Cogstate; Eisai Inc.; Elan Pharmaceuticals, Inc.; Eli Lilly and Company; EuroImmun; F. Hoffmann-La Roche Ltd and its affiliated company Genentech, Inc.; Fujirebio; GE Healthcare; IXICO Ltd.; Janssen Alzheimer Immunotherapy Research and Development, LLC.; Johnson and Johnson Pharmaceutical Research and Development LLC.; Lumosity; Lundbeck; Merck and Co., Inc.; Meso Scale Diagnostics, LLC.; NeuroRx Research; Neurotrack Technologies; Novartis Pharmaceuticals Corporation; Pfizer Inc.; Piramal Imaging; Servier; Takeda Pharmaceutical Company; and Transition Therapeutics. The Canadian Institutes of Health Research is providing funds to support ADNI clinical sites in Canada. Private sector contributions are facilitated by the Foundation for the National Institutes of Health (www.fnih.org). The grantee organization is the Northern California Institute for Research and Education, and the study is coordinated by the Alzheimer’s Therapeutic Research Institute at the University of Southern California. ADNI data are disseminated by the Laboratory for Neuro Imaging at the University of Southern California.
Conflicts of Interest
The authors declared no potential conflicts of interest with respect to the research, authorship, and/or publication of this article.
References
- 1. Winblad B, Amouyel P, Andrieu S, Ballard C, Brayne C, Brodaty H, Cedazo-Minguez A, Dubois B, Edvardsson D, Feldman H, Fratiglioni L, Frisoni GB, Gauthier S, et al. Defeating Alzheimer’s disease and other dementias: a priority for European science and society. Lancet Neurol. 2016; 15:455–532. https://doi.org/10.1016/S1474-4422(16)00062-4 [PubMed]
- 2. Chui HC, Zheng L, Reed BR, Vinters HV, Mack WJ. Vascular risk factors and Alzheimer’s disease: are these risk factors for plaques and tangles or for concomitant vascular pathology that increases the likelihood of dementia? An evidence-based review. Alzheimers Res Ther. 2012; 4:1. https://doi.org/10.1186/alzrt98 [PubMed]
- 3. Knopman DS, Griswold ME, Lirette ST, Gottesman RF, Kantarci K, Sharrett AR, Jack CR
Jr , Graff-Radford J, Schneider AL, Windham BG, Coker LH, Albert MS, Mosley THJr , and ARIC Neurocognitive Investigators. Vascular imaging abnormalities and cognition: mediation by cortical volume in nondemented individuals: atherosclerosis risk in communities-neurocognitive study. Stroke. 2015; 46:433–40. https://doi.org/10.1161/STROKEAHA.114.007847 [PubMed] - 4. Vemuri P, Lesnick TG, Przybelski SA, Knopman DS, Lowe VJ, Graff-Radford J, Roberts RO, Mielke MM, Machulda MM, Petersen RC, Jack CR
Jr . Age, vascular health, and Alzheimer disease biomarkers in an elderly sample. Ann Neurol. 2017; 82:706–18. https://doi.org/10.1002/ana.25071 [PubMed] - 5. Viswanathan A, Rocca WA, Tzourio C. Vascular risk factors and dementia: how to move forward? Neurology. 2009; 72:368–74. https://doi.org/10.1212/01.wnl.0000341271.90478.8e [PubMed]
- 6. Buchman AS, Wilson RS, Bienias JL, Shah RC, Evans DA, Bennett DA. Change in body mass index and risk of incident Alzheimer disease. Neurology. 2005; 65:892–97. https://doi.org/10.1212/01.wnl.0000176061.33817.90 [PubMed]
- 7. Hughes TF, Borenstein AR, Schofield E, Wu Y, Larson EB. Association between late-life body mass index and dementia: The Kame Project. Neurology. 2009; 72:1741–46. https://doi.org/10.1212/WNL.0b013e3181a60a58 [PubMed]
- 8. Pedditzi E, Peters R, Beckett N. The risk of overweight/obesity in mid-life and late life for the development of dementia: a systematic review and meta-analysis of longitudinal studies. Age Ageing. 2016; 45:14–21. https://doi.org/10.1093/ageing/afv151 [PubMed]
- 9. Xu WL, Atti AR, Gatz M, Pedersen NL, Johansson B, Fratiglioni L. Midlife overweight and obesity increase late-life dementia risk: a population-based twin study. Neurology. 2011; 76:1568–74. https://doi.org/10.1212/WNL.0b013e3182190d09 [PubMed]
- 10. Eckel N, Meidtner K, Kalle-Uhlmann T, Stefan N, Schulze MB. Metabolically healthy obesity and cardiovascular events: A systematic review and meta-analysis. Eur J Prev Cardiol. 2016; 23:956–66. https://doi.org/10.1177/2047487315623884 [PubMed]
- 11. Ortega FB, Lavie CJ, Blair SN. Obesity and Cardiovascular Disease. Circ Res. 2016; 118:1752–70. https://doi.org/10.1161/CIRCRESAHA.115.306883 [PubMed]
- 12. Wildman RP, Muntner P, Reynolds K, McGinn AP, Rajpathak S, Wylie-Rosett J, Sowers MR. The obese without cardiometabolic risk factor clustering and the normal weight with cardiometabolic risk factor clustering: prevalence and correlates of 2 phenotypes among the US population (NHANES 1999-2004). Arch Intern Med. 2008; 168:1617–24. https://doi.org/10.1001/archinte.168.15.1617 [PubMed]
- 13. Hamer M, Stamatakis E. Metabolically healthy obesity and risk of all-cause and cardiovascular disease mortality. J Clin Endocrinol Metab. 2012; 97:2482–88. https://doi.org/10.1210/jc.2011-3475 [PubMed]
- 14. Stefan N, Kantartzis K, Machann J, Schick F, Thamer C, Rittig K, Balletshofer B, Machicao F, Fritsche A, Häring HU. Identification and characterization of metabolically benign obesity in humans. Arch Intern Med. 2008; 168:1609–16. https://doi.org/10.1001/archinte.168.15.1609 [PubMed]
- 15. Primeau V, Coderre L, Karelis AD, Brochu M, Lavoie ME, Messier V, Sladek R, Rabasa-Lhoret R. Characterizing the profile of obese patients who are metabolically healthy. Int J Obes. 2011; 35:971–81. https://doi.org/10.1038/ijo.2010.216 [PubMed]
- 16. Lee JY, Han K, Han E, Kim G, Cho H, Kim KJ, Lee BW, Kang ES, Cha BS, Brayne C, Lee YH. Risk of Incident Dementia According to Metabolic Health and Obesity Status in Late Life: A Population-Based Cohort Study. J Clin Endocrinol Metab. 2019; 104:2942–2952. https://doi.org/10.1210/jc.2018-01491 [PubMed]
- 17. Vanhanen M, Koivisto K, Moilanen L, Helkala EL, Hänninen T, Soininen H, Kervinen K, Kesäniemi YA, Laakso M, Kuusisto J. Association of metabolic syndrome with Alzheimer disease: a population-based study. Neurology. 2006; 67:843–47. https://doi.org/10.1212/01.wnl.0000234037.91185.99 [PubMed]
- 18. Lee EB. Obesity, leptin, and Alzheimer’s disease. Ann N Y Acad Sci. 2011; 1243:15–29. https://doi.org/10.1111/j.1749-6632.2011.06274.x [PubMed]
- 19. Jang H, Kim JH, Choi SH, Lee Y, Hong CH, Jeong JH, Han HJ, Moon SY, Park KW, Han SH, Park KH, Kim HJ, Na DL, Seo SW. Body Mass Index and Mortality Rate in Korean Patients with Alzheimer’s Disease. J Alzheimers Dis. 2015; 46:399–406. https://doi.org/10.3233/JAD-142790 [PubMed]
- 20. Milajerdi A, Djafarian K, Shab-Bidar S, Speakman JR. Pre- and post-diagnosis body mass index and heart failure mortality: a dose-response meta-analysis of observational studies reveals greater risk of being underweight than being overweight. Obes Rev. 2018; 20:252–61. https://doi.org/10.1111/obr.12777 [PubMed]
- 21. Zhang J, Begley A, Jackson R, Harrison M, Pellicori P, Clark AL, Cleland JG. Body mass index and all-cause mortality in heart failure patients with normal and reduced ventricular ejection fraction: a dose-response meta-analysis. Clin Res Cardiol. 2019; 108:119–32. https://doi.org/10.1007/s00392-018-1302-7 [PubMed]
- 22. Bennett DA, Schneider JA, Wilson RS, Bienias JL, Arnold SE. Neurofibrillary tangles mediate the association of amyloid load with clinical Alzheimer disease and level of cognitive function. Arch Neurol. 2004; 61:378–84. https://doi.org/10.1001/archneur.61.3.378 [PubMed]
- 23. Watanabe T, Miyazaki A, Katagiri T, Yamamoto H, Idei T, Iguchi T. Relationship between serum insulin-like growth factor-1 levels and Alzheimer’s disease and vascular dementia. J Am Geriatr Soc. 2005; 53:1748–53. https://doi.org/10.1111/j.1532-5415.2005.53524.x [PubMed]
- 24. Yamamoto H, Kato Y. Relationship between plasma insulin-like growth factor I (IGF-I) levels and body mass index (BMI) in adults. Endocr J. 1993; 40:41–45. https://doi.org/10.1507/endocrj.40.41 [PubMed]
- 25. Al-Delaimy WK, von Muhlen D, Barrett-Connor E. Insulinlike growth factor-1, insulinlike growth factor binding protein-1, and cognitive function in older men and women. J Am Geriatr Soc. 2009; 57:1441–46. https://doi.org/10.1111/j.1532-5415.2009.02343.x [PubMed]
- 26. Doehner W, Clark A, Anker SD. The obesity paradox: weighing the benefit. Eur Heart J. 2010; 31:146–48. https://doi.org/10.1093/eurheartj/ehp339 [PubMed]
- 27. Beccano-Kelly D, Harvey J. Leptin: a novel therapeutic target in Alzheimer’s disease? Int J Alzheimers Dis. 2012; 2012:594137. https://doi.org/10.1155/2012/594137 [PubMed]
- 28. Janssen I, Katzmarzyk PT, Ross R. Duration of overweight and metabolic health risk in American men and women. Ann Epidemiol. 2004; 14:585–91. https://doi.org/10.1016/j.annepidem.2004.01.007 [PubMed]
- 29. Karelis AD, Faraj M, Bastard JP, St-Pierre DH, Brochu M, Prud’homme D, Rabasa-Lhoret R. The metabolically healthy but obese individual presents a favorable inflammation profile. J Clin Endocrinol Metab. 2005; 90:4145–50. https://doi.org/10.1210/jc.2005-0482 [PubMed]
- 30. Aguilar-Salinas CA, García EG, Robles L, Riaño D, Ruiz-Gomez DG, García-Ulloa AC, Melgarejo MA, Zamora M, Guillen-Pineda LE, Mehta R, Canizales-Quinteros S, Tusie Luna MT, Gómez-Pérez FJ. High adiponectin concentrations are associated with the metabolically healthy obese phenotype. J Clin Endocrinol Metab. 2008; 93:4075–79. https://doi.org/10.1210/jc.2007-2724 [PubMed]
- 31. Brochu M, Tchernof A, Dionne IJ, Sites CK, Eltabbakh GH, Sims EA, Poehlman ET. What are the physical characteristics associated with a normal metabolic profile despite a high level of obesity in postmenopausal women? J Clin Endocrinol Metab. 2001; 86:1020–25. https://doi.org/10.1210/jcem.86.3.7365 [PubMed]
- 32. Hendrix JA, Finger B, Weiner MW, Frisoni GB, Iwatsubo T, Rowe CC, Kim SY, Guinjoan SM, Sevlever G, Carrillo MC. The Worldwide Alzheimer’s Disease Neuroimaging Initiative: an update. Alzheimers Dement. 2015; 11:850–59. https://doi.org/10.1016/j.jalz.2015.05.008 [PubMed]
- 33. Petersen RC, Aisen PS, Beckett LA, Donohue MC, Gamst AC, Harvey DJ, Jack CR
Jr , Jagust WJ, Shaw LM, Toga AW, Trojanowski JQ, Weiner MW. Alzheimer’s Disease Neuroimaging Initiative (ADNI): clinical characterization. Neurology. 2010; 74:201–09. https://doi.org/10.1212/WNL.0b013e3181cb3e25 [PubMed] - 34. Werhane ML, Thomas KR, Edmonds EC, Bangen KJ, Tran M, Clark AL, Nation DA, Gilbert PE, Bondi MW, Delano-Wood L, and Alzheimer’s Disease Neuroimaging Initiative. Differential Effect of APOE ɛ4 Status and Elevated Pulse Pressure on Functional Decline in Cognitively Normal Older Adults. J Alzheimers Dis. 2018; 62:1567–78. https://doi.org/10.3233/JAD-170918 [PubMed]
- 35. Moran C, Beare R, Wang W, Callisaya M, Srikanth V, and Alzheimer’s Disease Neuroimaging Initiative (ADNI). Type 2 diabetes mellitus, brain atrophy, and cognitive decline. Neurology. 2019; 92:e823–30. https://doi.org/10.1212/WNL.0000000000006955 [PubMed]
- 36. Expert Panel on Detection, Evaluation, and Treatment of High Blood Cholesterol in Adults. Executive Summary of The Third Report of The National Cholesterol Education Program (NCEP) Expert Panel on Detection, Evaluation, And Treatment of High Blood Cholesterol In Adults (Adult Treatment Panel III). JAMA. 2001; 285:2486–97. https://doi.org/10.1001/jama.285.19.2486 [PubMed]
- 37. WHO Expert Consultation. Appropriate body-mass index for Asian populations and its implications for policy and intervention strategies. Lancet. 2004; 363:157–63. https://doi.org/10.1016/S0140-6736(03)15268-3 [PubMed]
- 38. McKhann GM, Knopman DS, Chertkow H, Hyman BT, Jack CR
Jr , Kawas CH, Klunk WE, Koroshetz WJ, Manly JJ, Mayeux R, Mohs RC, Morris JC, Rossor MN, et al. The diagnosis of dementia due to Alzheimer’s disease: recommendations from the National Institute on Aging-Alzheimer’s Association workgroups on diagnostic guidelines for Alzheimer’s disease. Alzheimers Dement. 2011; 7:263–69. https://doi.org/10.1016/j.jalz.2011.03.005 [PubMed] - 39. Shaw LM, Vanderstichele H, Knapik-Czajka M, Clark CM, Aisen PS, Petersen RC, Blennow K, Soares H, Simon A, Lewczuk P, Dean R, Siemers E, Potter W, et al, and Alzheimer’s Disease Neuroimaging Initiative. Cerebrospinal fluid biomarker signature in Alzheimer’s disease neuroimaging initiative subjects. Ann Neurol. 2009; 65:403–13. https://doi.org/10.1002/ana.21610 [PubMed]
- 40. Jack CR
Jr , Bernstein MA, Fox NC, Thompson P, Alexander G, Harvey D, Borowski B, Britson PJ, L Whitwell J, Ward C, Dale AM, Felmlee JP, Gunter JL, et al. The Alzheimer’s Disease Neuroimaging Initiative (ADNI): MRI methods. J Magn Reson Imaging. 2008; 27:685–91. https://doi.org/10.1002/jmri.21049 [PubMed] - 41. Zhang D, Wang Y, Zhou L, Yuan H, Shen D, and Alzheimer’s Disease Neuroimaging Initiative. Multimodal classification of Alzheimer’s disease and mild cognitive impairment. Neuroimage. 2011; 55:856–67. https://doi.org/10.1016/j.neuroimage.2011.01.008 [PubMed]
- 42. Bubu OM, Pirraglia E, Andrade AG, Sharma RA, Gimenez-Badia S, Umasabor-Bubu OQ, Hogan MM, Shim AM, Mukhtar F, Sharma N, Mbah AK, Seixas AA, Kam K, et al, and Alzheimer’s Disease Neuroimaging Initiative. Obstructive sleep apnea and longitudinal Alzheimer’s disease biomarker changes. Sleep. 2019; 42:zsz048. https://doi.org/10.1093/sleep/zsz048 [PubMed]