


Introduction
Homozygous mutations in the GBA gene encoding the lysosomal enzyme glucocerebrosidase (GCase) cause Gaucher disease (GD), the most common lysosomal storage disorder (LSD). GBA mutations are also numerically the most important known genetic risk factor for Parkinson disease (PD) [6, 39]. The most frequent GBA mutation associated with PD is N370S (N370SGBA) [6, 39]. Mutations in GBA decrease GCase activity, leading to defects in autophagic-lysosomal function and a-synuclein aggregate accumulation.
Cell models of dermal fibroblasts or transformed lymphocytes (lymphoblasts) have been used to understand the cell biology associated with neurodegenerative diseases, including PD [10, 19, 41] but the utility of non-neural cells to provide insight into the cellular basis of neurodegeneration is limited [22]. The development of stem cell-derived models of disease, such as embryonic stem cells [13, 20] and induced pluripotent stem cells (iPSCs) from patients with PD are considered more appropriate in this respect [33]. Collections of neural stem cells, also known as neurospheres, have been developed from patients with neurodegenerative diseases, including PD [21, 28, 31]. Neurospheres have been used as a tool to model neurodegenerative disorders [21], developmental studies [1, 32], cell differentiation [47] and regenerative medicine [23]. Neural stem cell derived neurospheres have an advantage over embryonic/iPSCs, as they do not require genetic reprogramming. Neurospheres can be obtained by using pluripotent neural crest stem cells (NcSC) from adipose tissue [33, 43] and have been previously used in PD research [14].
Mitochondrial dysfunction has been associated with aging and several neurodegenerative diseases including PD [35, 36], and several lines of investigation are directed towards increasing mitochondrial biogenesis and respiration as neuroprotective strategies [3]. Mitochondrial autophagy (mitophagy) has been shown to contribute to the pathogenesis of genetic forms of PD [15]. Mutations in genes that regulate mitophagy, such as PTEN-induced-putative-protein-kinase 1 (PINK1) and PARK2/Parkin-mutations cause early onset PD [25]. Following a loss of mitochondrial membrane potential (MMP) (↓ΔΨm), PINK1 accumulation in the outer membrane acts as a sensor for mitochondrial damage and induces translocation of cytosolic Parkin, through a mechanism that requires the kinase activity of PINK1 [25]. Parkin ubiquitinates several mitochondrial proteins which aids the recruitment of damaged mitochondria to phagophores by binding to LC3-II directly, or via the adaptor protein p62 [45]. It is not clear whether p62 is required for Parkin mediated mitophagy [8, 24]. An increasing body of evidence implicates defects in quality control pathways in both GD and PD, but the precise role of mitochondrial function and mitophagy in the pathogenesis of these diseases remains to be elucidated [5, 7, 26, 37]. Transcription factor EB (TFEB) regulates autophagy by activating the genes that encode lysosomal hydrolases, lysosomal v-ATPase pumps, lysosomal regulators and autophagy regulators and so it is considered a master regulator of autophagy that has emerged as a potential therapeutic target for PD. TFEB has also been associated with activation of peroxisome proliferator-activated receptor gamma coactivator 1-alpha (PGC1α), a regulator of mitochondrial biogenesis. It has been reported that cells with increased TFEB protein have significantly higher PGC1α mRNA levels, resulting in increased mitochondrial content. These findings suggest that TFEB is activated following mitophagy to maintain the autophagy-lysosome pathway and mitochondrial biogenesis [11].
The characterization of mitochondrial function and autophagy in neurospheres would help to clarify whether a cause-effect relationship between the presence of GBA mutations and mitochondrial dysfunction occurs before neuronal differentiation. We hypothesise that GBA mutations likely impair the clearance of damaged mitochondria, promoting their accumulation, as a result of abnormal autophagy flux processing or biogenesis.
Mitophagy pathways could be altered in N370SGBA carriers due to defective recycling machinery and thereby changes in mitochondrial content. Therefore we have investigated the effect of N370SGBA mutations on macroautophagy and mitochondrial function in a 3D-neurosphere model derived from NcSC, in either basal conditions or following induction of mitophagy by the CCCP uncoupler.
Results
Homozygous, heterozygous and control donor subjects were age and sex matched, (Supplementary Table 1).
Characterization of the neurosphere model
We first followed the morphological changes of NcSC upon induction to neurospheres. Cell aggregates began to form within 24 hours and the spherical structures grew in size as time progressed (48, 72 and 96 hrs). (Supplementary Figure 1).
Next, we measured the protein level of neuronal markers i.e. β-III tubulin and Microtubule-associated protein 2 (MAP2) (Figure 1A and B), and the mRNA level of the stem marker nestin (Figure 1C), as well as GCase, HEX and β-gal enzymatic activities (Figure 2) of the 6 lines over time, to identify the length of time taken for the neurospheres to become biochemically stable, and to compare the influence of N370SGBA zygosity on neurosphere formation. We chose 4 days as the duration for the studies as MAP2 and β-III tubulin were stable at this time and nestin levels were not significantly different between the lines. Quantification of GBA protein levels are shown in Supplementary Figure 4. GCase activity showed a trend to reduction by 33% (p=NS) in wt/N370SGBA and was 98% decreased (p=0.049) in N370SGBA/N370SGBA when compared to controls, when measured at pH 5.4 in the presence of sodium taurocholate. As a confirmation, measurement of GCase at pH 4.5 in the absence of the GCase activator sodium taurocholate yielded similar results, while HEX and β-gal were unaffected.
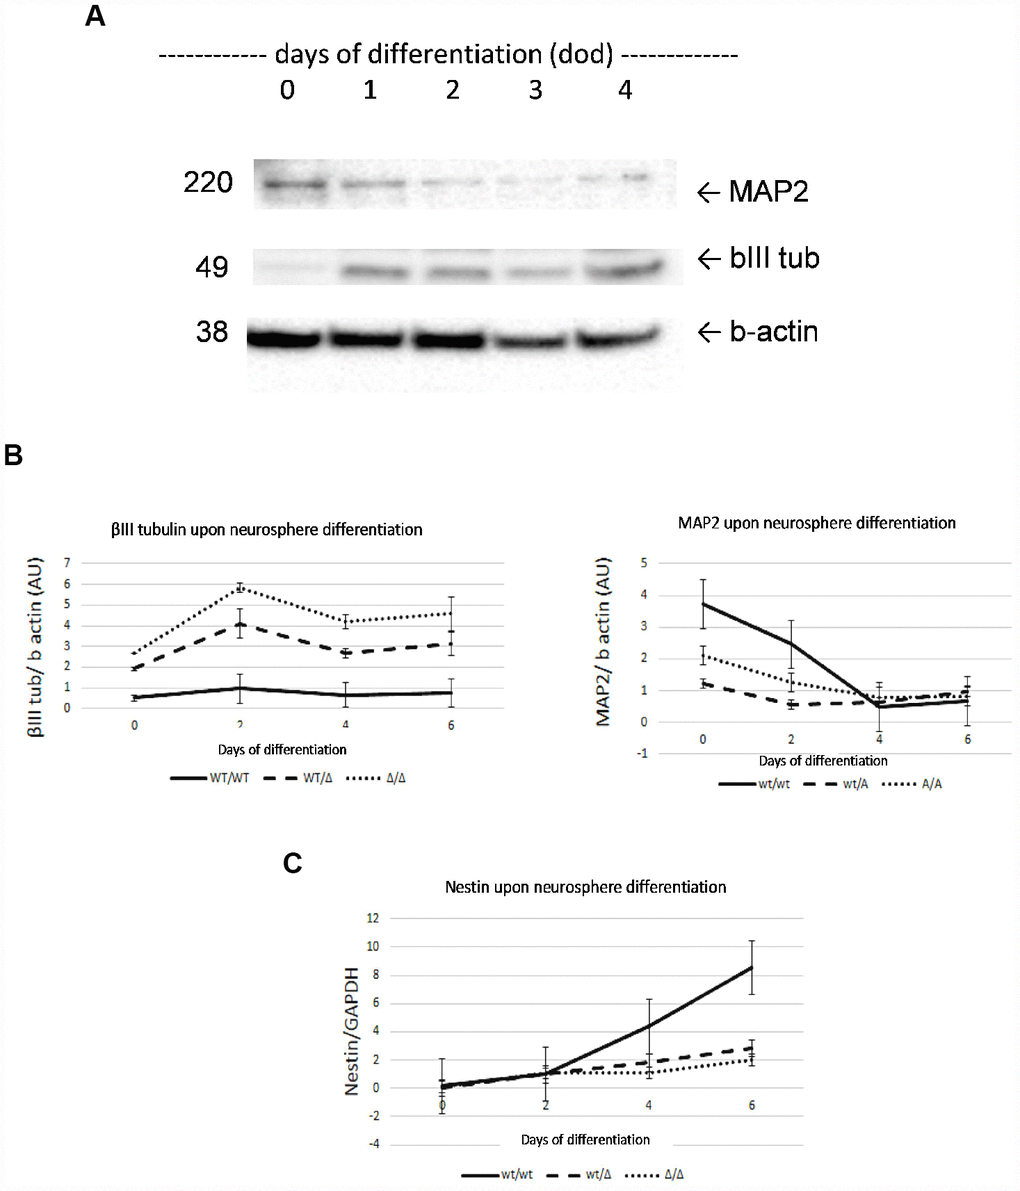
Figure 1. Characterization of neurosphere development by analysis of β-III tubulin, MAP2 and nestin markers. Neuronal markers β-III tubulin and MAP2 were determined by Western Blot (A). Both neural markers showed stabilized expression on day 4 of development. β-III tubulin and MAP2 levels confirmed neural properties of neurospheres (B). Increasing nestin mRNA levels confirmed neural stem cell properties of neurospheres during development (C). No significant differences were found at 4 day of development AU, arbitrary units. Results are expressed by mean± SEM.
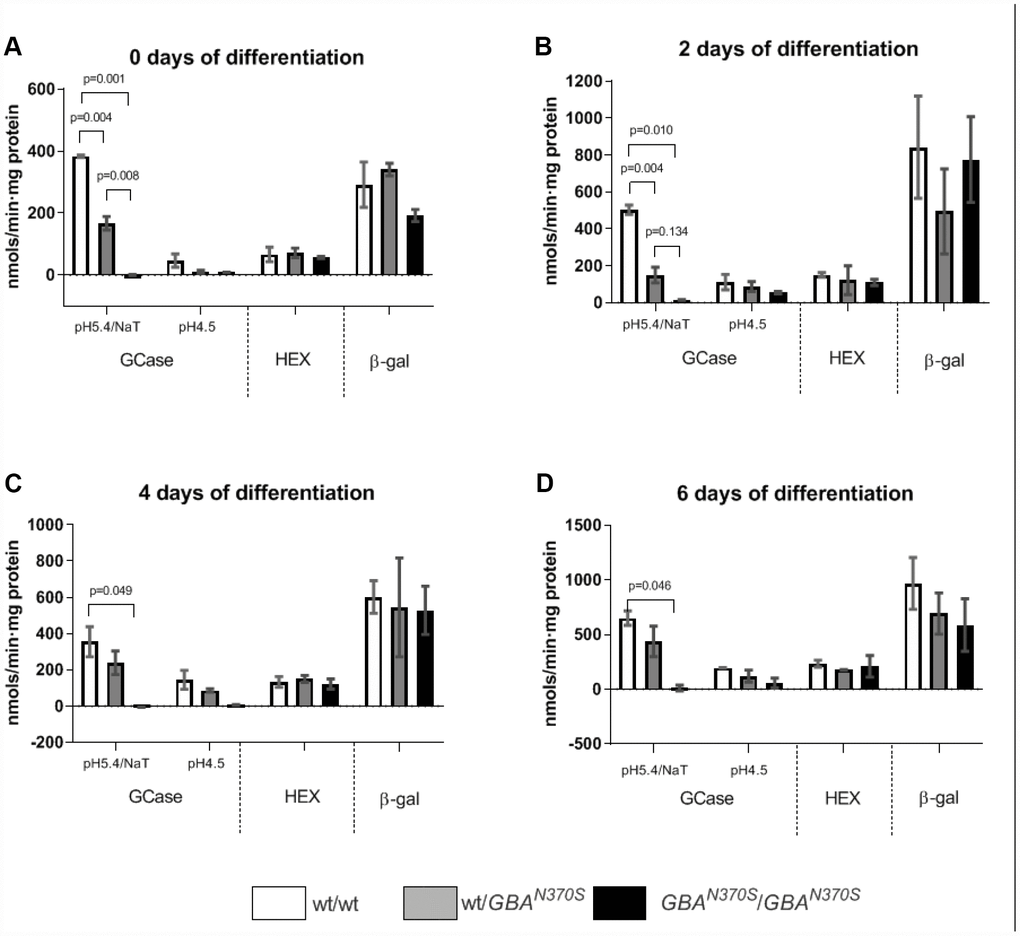
Figure 2. GCase, HEX and β-gal enzymatic activities stabilized from 0 to 6 days of differentiation. GCase activity decreased as expected for the respective genotypes (33% decrease in wt/N370SGBA and 98% decrease in N370SGBA/N370SGBA) when measured at pH 5.4 in the presence of sodium taurocholate. Measurement of GCase at pH 4.5 in the absence of the GCase activator sodium taurocholate yielded similar results, while HEX and β-gal were unaffected. Results are expressed by mean± SEM.
Validation of uncoupler treatment to dissipate ΔΨ and to induce mitophagy in the neurosphere model
Mitochondrial depolarisation following mitochondrial uncoupling was confirmed by loss of the long isoform of optic atrophy protein 1 (OPA1) (L-OPA1; Figure 3A and 3B) as previously described [9, 17, 30, 40] and was similar in all three genotypes. Mitochondrial content as measured by TOM20 protein level was decreased in a control cell line during the 24h CCCP treatment (Figure 3C); the progressive response over the time of treatment confirms the effect of CCCP-induced depolarization.
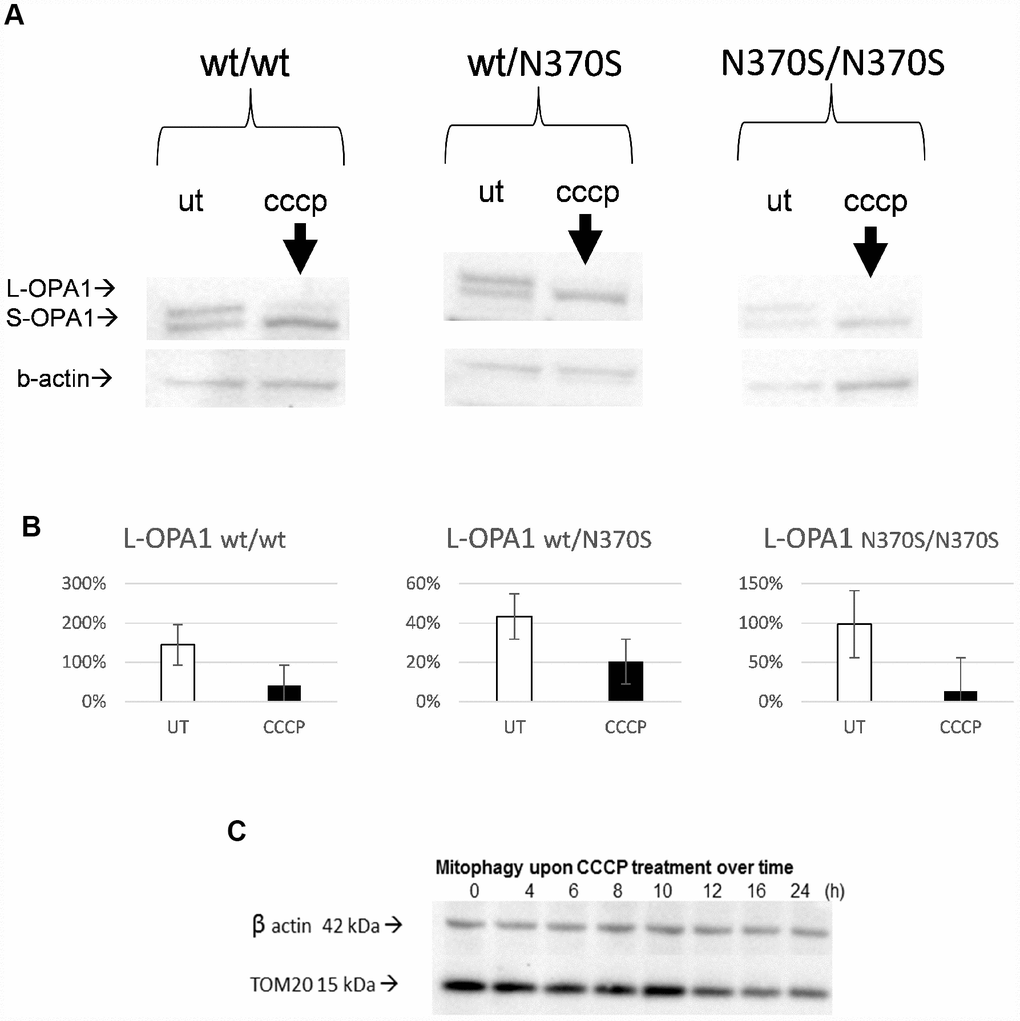
Figure 3. Confirmation of mitochondrial uncoupling with CCCP in the neurosphere model. Representative blots of OPA1 isoforms. Expected changes from long to short OPA1 isoforms were observed upon uncoupler treatment in all the genotypes, as mitochondria undergo depolarisation/fission following mitochondrial uncoupling (24h, 10 μM CCCP) (A and B). TOM20 levels progressively decrease from 0 to 24h in a control line (C). L-OPA1, long isoform of optic atrophy 1 protein OPA1; S-OPA1, short isoform of OPA1; UT, untreated.
Mitochondrial content following mitophagy induction in mutant GBA neurospheres
We compared the steady-state levels of mitochondrial content between different genotypes. As shown in Figure 4A, there was a significant increase in the levels of succinate dehydrogenase complex subunit A (SDHA), and a non-significant increase for voltage- dependent anion-selective channel 1 (VDAC) or mitochondrial transcription factor A (TFAM) in the homozygous lines.
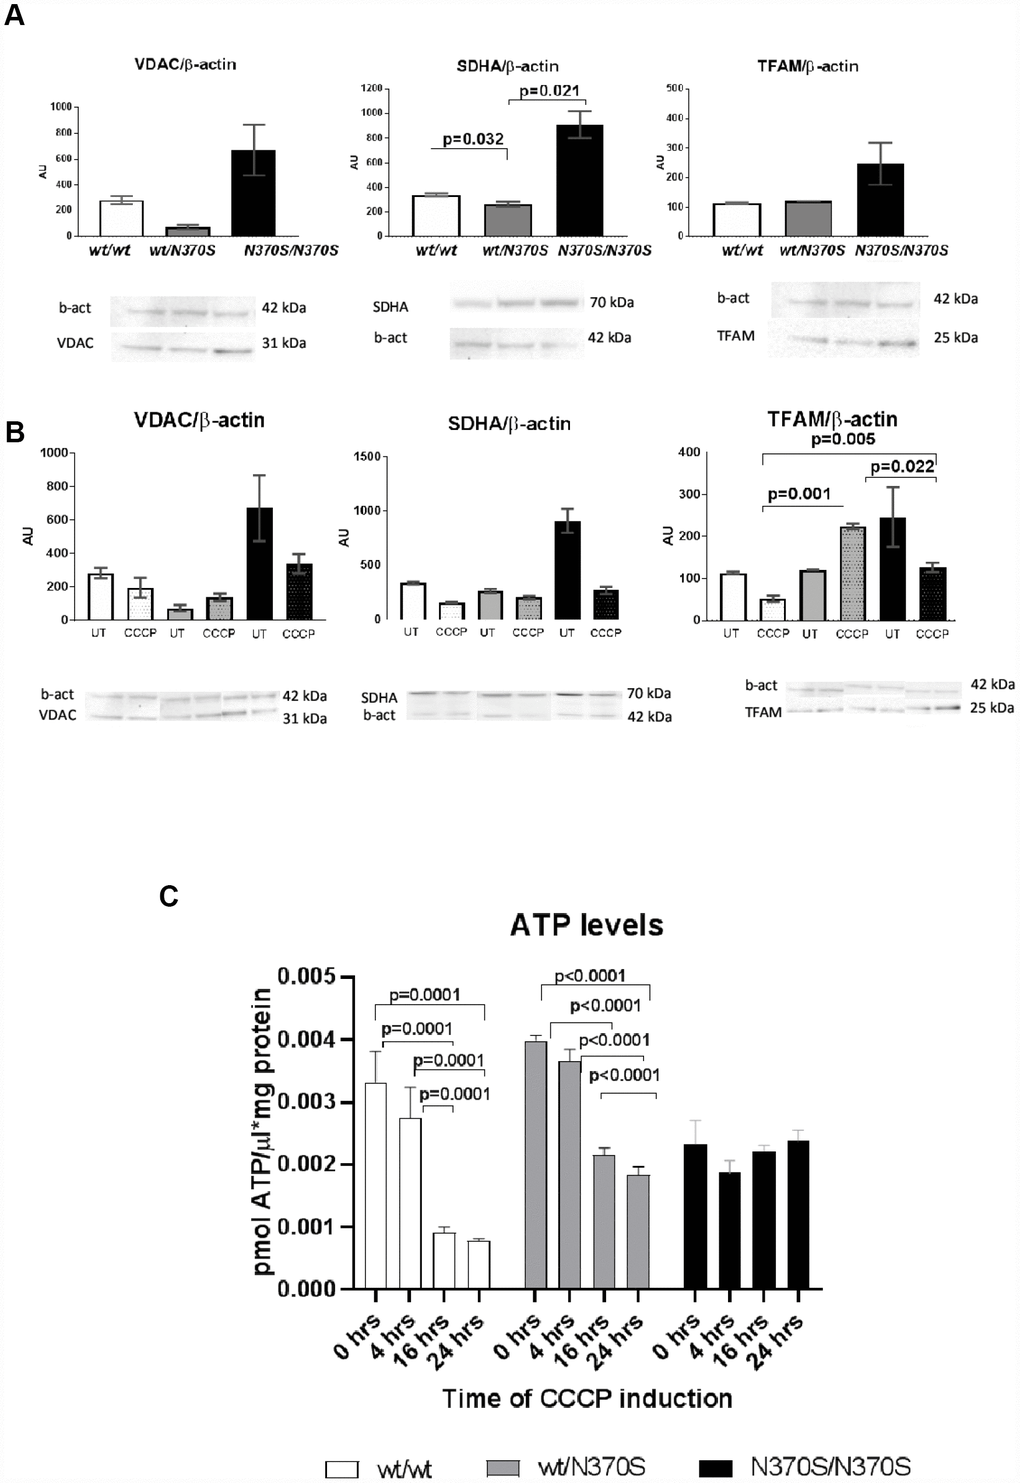
Figure 4. Mitochondrial content under basal conditions in control, wt/ N370SGBA and N370SGBA/N370SGBA neurospheres was assessed by western blotting for the mitochondrial proteins VDAC1 (outer mitochondrial membrane), SDHA (inner mitochondrial membrane), and TFAM (matrix), normalized by β-actin content. All markers tended to increase in N370SGBA/N370SGBA neurospheres in basal conditions, when compared to control lines (A) (SDHA was significant). As expected in control lines, protein levels of VDAC1, SDHA and TFAM and ATP levels decreased following CCCP treatment for 24 hours (B and C). Despite an apparent increase in mitochondrial mass in untreated conditions, ATP levels remained unchanged in wt/N370SGBA and N370SGBA/N370SGBA neurospheres (C). Mitochondrial markers of wt/N370SGBA did not show a marked response to CCCP uncoupling, in fact, TFAM significantly increased in the heterozygous lines and the decrease in ATP levels were not so pronounced (B and C) and ATP levels of homozygous N370SGBA/N370SGBA neurospheres showed a null response to CCCP uncoupling. All of the above data suggest that mitochondrial function may be impaired in GBA mutant neurospheres. AU: arbitrary units. Thin line indicates p value <0.05. Results are expressed by mean± SEM.
As expected, trends to a reduction of protein level in a panel of mitochondrial markers representing the outer, inner membrane or mitochondrial matrix i.e VDAC1, SDHA and TFAM were present upon uncoupler treatment in the control lines (wt/wt) (Figure 4B) and ATP levels also decreased (Figure 4C). Despite the increase of mitochondrial content (SDHA subunit) under basal conditions, steady state levels of ATP in N370SGBA/N370SGBA presented trends to lower levels than control cells suggesting mitochondrial dysfunction (Figure 4C). After uncoupler treatment, ATP levels also decreased in the control lines. However, the decrease of mitochondrial markers were not so evident in wt/N370SGBA heterozygous lines and the response of ATP levels upon induced mitophagy was either partial or not observed in the wt/N370SGBA heterozygous and homozygous N370SGBA neurospheres, respectively. In fact, in the heterozygous line, the mitochondrial marker TFAM was significantly increased (Figure 4B).
Since mitochondrial content is not only maintained by mitochondrial turnover but also mitochondrial biogenesis, we examined the latter by measuring mRNA levels of PGC1α transcript and one of its upstream regulators TFEB [11, 38] in neurospheres untreated and treated with CCCP for 24 hours. As displayed in Figure 5, mitochondrial depolarization led to a substantial and significant increase in PGC1α transcript in the heterozygous line compared to the control and homozygous lines. The steady-state level of TFEB mRNA expression was found inversely proportional to the GCase level, although not significantly (Figures 2 and 5). Treatment of wt/N370GBA or N370SGBA/N370SGBA neurospheres with CCCP resulted in similar TFEB mRNA levels, compared to control. PINK1 mRNA levels were similar in all the cell lines (data not shown) suggesting if there is impaired mitophagy it is probably not due to lower PINK1 levels (wt/wt 0.068±0.006, wt/N370SGBA 0.086±0.010, N370SGBA/N370SGBA 0.058±0.059).
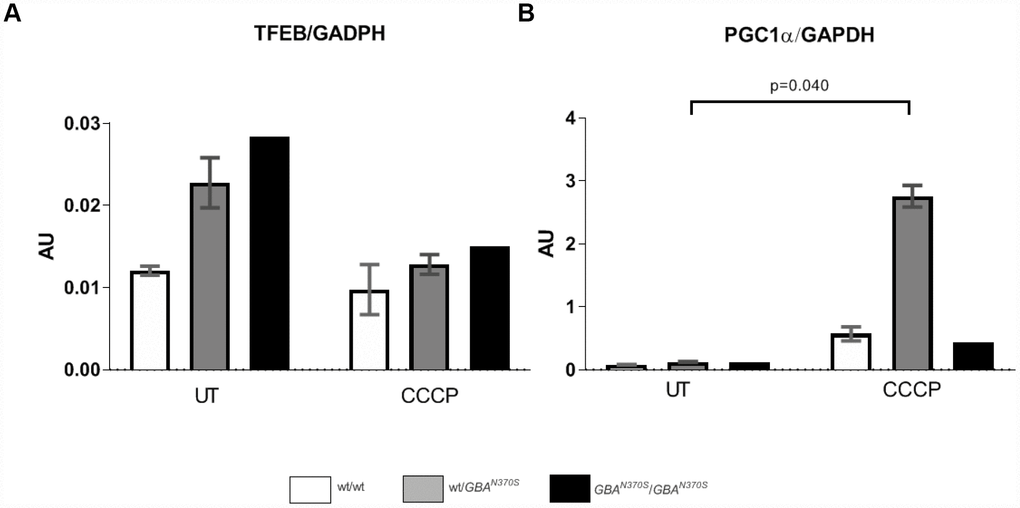
Figure 5. Steady-state mRNA levels of TFEB and PGC1α during uncoupling treatment. TFEB mRNA levels tended to decrease in wt/N370SGBA, and N370SGBA/N370SGBA but PGC1α significantly increased upon CCCP induction in wt/N370SGBA, probably in an attempt to compensate for the underlying mitochondrial defects. UT, untreated. AU: arbitrary units. Thin line indicates p value <0.05. Results are expressed by mean± SEM.
Macroautophagy in neurospheres carrying N370SGBA mutation
To investigate if mitophagy was impaired in neurospheres with GCase deficiency, we measured macroautophagy flux by LC3-II levels, a marker of autophagosome number, and sequestrosome/p62 (p62) levels (which helps bind both cargo and LC3-II in autophagosomes). Under basal conditions, p62 and LC3-II levels were similar in all groups (Figure 6). Following bafilomycin A1 (BAF) treatment, which prevents the fusion of autophagosomes to lysosomes, p62 and LC3-II increased in all groups as expected (Figure 6). However, there was no significant difference between the groups treated with BAF, suggesting that macroautophagy flux is not noticeably affected, which is in line with similar synuclein protein levels observed at day 4 of development (Supplementary Figure 3).
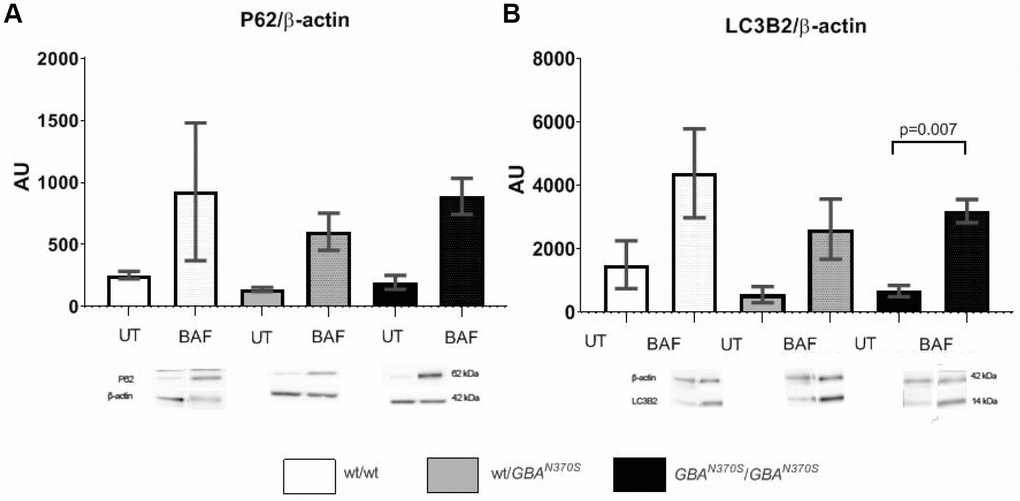
Figure 6. Autophagy flux measurement. Macroautophagy flux showed trends to further increase in the control lines. p62 and LC3-2 levels are similar in the 3 untreated cell lines, however, when autophagy was blocked under bafilomycin treatment, p62 and LC3-2 levels tended to increase the most in controls. The lack of significant differences suggests that preexistent mitochondrial impairment may account for the pathogenesis of GBA mutant neurospheres. AU, arbitrary units; UT, untreated; BAF, bafilomycin. Results are expressed by mean± SEM.
A summary of the raw data obtained from the experimental work is available in Supplementary Table 2.
Discussion
In this study neurospheres have been used to explore mitochondrial content, function and macroautophagy in the context of GBA mutations.
Mitochondrial abnormalities have been associated with GBA mutations [6, 12, 26, 42], and recent data have also shown that mitochondrial dysfunction is present in post-mortem tissues of PD patients, cell and animal models with the L444P GBA mutation [16]. Our study was designed to monitor steady-state levels of mitochondrial content, alterations in content upon mitochondrial depolarization induced mitophagy; the latter validated by loss of Ψm, decreased mitochondrial proteins, a decrease in total ATP and a shift of OPA1 isoforms in control neurospheres.
Our data indicate that heterozygous and homozygous N370SGBA produced different patterns of modified mitochondrial content. Homozygous GBA mutations tended to increase mitochondrial content under basal conditions (significantly increased SDHA levels were observed), while uncoupling resulted in decreased clearance of mitochondrial content. Intriguingly, heterozygous GBA mutations tended to increase mitochondrial content following mitochondrial uncoupling, and this was coincident with a large increase in PGC1α mRNA levels, a master regulator of mitochondrial biogenesis. This could be a compensatory mechanism for heterozygous lines, which homozygous lines under the same insult are not able to perform. Our macroautophagy flux data did not indicate a significant problem with the formation of autophagosomes with lysosomes in mutant neurospheres, suggesting that, if mitophagy is impaired in these cells, it could be due to excessive mitochondrial biogenesis, as observed by the PGC1α increase [2], rather than the autophagic machinery required for the degradation of damaged mitochondria. However, it is possible that we have not been able to detect macroautophagy defects due to the low sample size. Nevertheless, the fact that macroautophagy is not noticeably affected is consistent with the absence of differences in synuclein levels at day 4 of neurosphere development. The association of the loss of GCase activity and an increase in synuclein levels has been consistently observed and, in our model homozygous lines showed trends to higher levels of synuclein, while heterozygous lines showed intermediate levels over the controls, at several points of their development. Mitochondrial fission, as measured by the disappearance of the long isoform of OPA1, was similar between lines, suggesting additional alterations of mitochondrial turnover. PINK1 mRNA levels were also similar, and we were unable to detect either endogenous PINK1 or parkin protein levels (data not shown) suggesting either PINK1/parkin mitophagy occurs at an undetectable rate in our model, or does not occur at all in neurospheres, although we cannot discard technical reasons underlying the lack of the detection of these proteins. Mitochondria in GBA KO mice cortical neurons have been shown to recruit GFP-tagged parkin upon depolarization to a similar level as controls [27]. Other mitophagy initiators [4, 46] might be required for mitophagy in neurospheres. For instance, other proteins related to mitophagy such as BNIP3, FUND1, SMURF1 and BCL2-L-13 could also be affected but are beyond the scope of this study.
GCase deficiency in neuronal models is typically associated with an impairment of macroautophagy flux [5, 18, 37]. The increased mRNA levels of TFEB, a master regulator of lysosomal and autophagy genes [34] is the most likely explanation why we do not see changes in macroautophagy flux. Perhaps neurons are unable to maintain this compensatory mechanism, as they develop, particularly if mitochondrial dysfunction is occurring in these cells, and changes in autophagy flux are observed in more mature neurons.
In summary, as illustrated in Figure 7, dysfunctional mitochondrial accumulation occurs in mutant GBA neurospheres under basal conditions. Our data suggest that the impaired turnover of depolarized mitochondria is not a result of impaired autophagosome formation and degradation, but has its origin at an early stage, when defective mitochondrial function was observed.
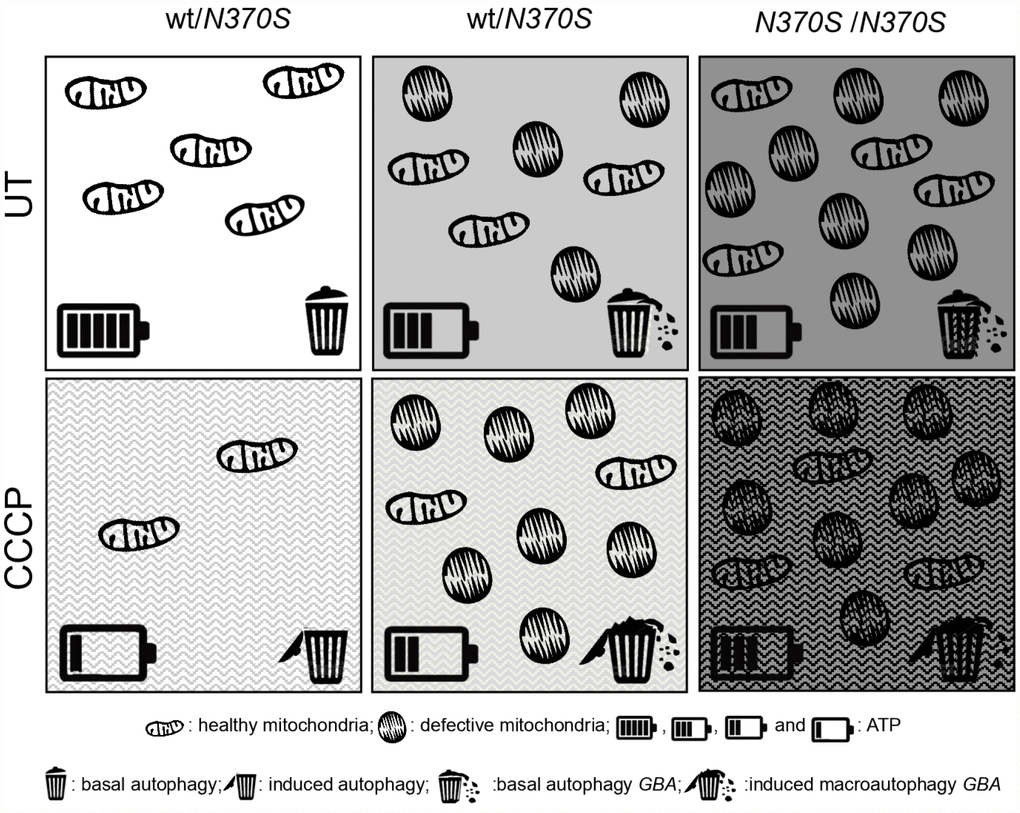
Figure 7. Global summary of the observed molecular parameters in GBA mutant neurospheres. Compared to the controls, dysfunctional mitochondrial accumulation occurs in mutant GBA neurospheres under basal conditions, as shown by the accumulation of healthy and altered mitochondria, represented as elongated and rounded structures, respectively. Mitochondrial elimination is correct under mitophagy induction (CCCP) in the control line, as observed by the decrease of ATP, represented by the battery, and the macroautophagy induction, represented by the garbage bin. There is an impaired turnover of depolarized mitochondria under induced mitophagy in GBA neurospheres. This is not a result of impaired autophagosome formation and degradation, but at an earlier stage, where defective mitochondrial dysfunction was observed.
Conclusions
Neurospheres are a suitable model to study lysosomal storage disorders. We show that mitochondrial dysfunction is an early event preceding macroautophagy flux, at least in this model of neurospheres containing pathogenic GBA mutations.
Neurospheres might also be considered as a potential tool for drug discovery or cell replacement therapy because these cells can proliferate and differentiate into new neurons, astrocytes, and oligodendrocytes [14].
Materials and Methods
Patients
All patients and controls included in the study signed an informed consent. The study has been approved by the institutional ethics committee Royal Free Research Ethics Committee (REC number 10/H0720/21). Methods have been performed in accordance with the appropriate guidelines and regulations of University College of London.
Cell culture and treatment
Neural crest stem cells were obtained as previously described [44]. 6 cell lines corresponding to homozygous (N370SGBA/N370SGBA, n=2), heterozygous (wt/N370SGBA n=2) and control (wt/wt, n=2) subjects were grown in DMEM media supplemented with 10% fetal bovine serum, 1mM pyruvate, 0.5 ml uridine (50mg/ml) and 0.5% penicillin-streptomycin-fungizone. Then, cells were detached with accutase and cultured in DMEM-F12 (1:1) containing the following supplements and growth factors, 1x B27, 20μL leukemia inhibitor (10ng/mL), basic fibroblast growth factor (40ng/mL FGF2), epidermal growth factor (10ng/mL EGF) and 1% penicillin-streptomycin-fungizone.
Mitochondrial depolarization-mediated mitophagy was induced for 24 hours with 10 μM CCCP. Bafilomycin treatment was performed for 4 hours at 0.5 μM. Cells were washed twice with phosphate-buffered saline (PBS) and collected for analysis as described below.
Western blot analysis and densitometry
Neurospheres were lysed and placed on ice for 15 min with RIPA buffer supplemented with 1x Halt protease inhibitor cocktail (Pierce). Cell lysates were centrifuged at 21,000g at 4°C for 5min and soluble material was retained for Western Blot analysis.
Protein levels were determined by using a bicinchoninic acid (BCA) kit (Pierce Thermo Fisher; Basingstoke, UK).
Equal amounts of 20 μg protein from the soluble material were resolved under reducing conditions in either: i) NuPAGE 4–12% polyacrylamide precast gels (Invitrogen, Carlsbad, CA, USA) using the 2 (N morpholino) ethane sulphonic acid (MES) buffer or: ii) NuPAGE 12% (Invitrogen, Carlsbad, CA, USA) using MOPS buffer and transferred onto Immobilon polyvinylidene difluoride membrane (PVDF) (Millipore, Watford, UK). Blocking was made with 10% skimmed milk powder in PBS. Antibodies detecting microtubule associated protein 2 (MAP2) (1:1000 MAP2, Invitrogen), βIII tubulin (1:1000 ab7751 Abcam), p62 (1:1666 ab56416 Abcam), β actin (1:10000, Sigma), TFAM (1:1000 Thermo Fischer Scientific), TOM20 (1:1000 Santa Cruz), VDAC1 (1:1000 ab14734 Abcam), SDHA (1:1000 ab14715 Abcam), OPA1 (1:500 BD/612606) and LC3 (1:1000 Cell Signalling) were used. Horseradish peroxidase conjugated secondary antibodies against mouse and rabbit IgG were used (1:2000) (Dako, Glostrup, Denmark). ECL reagent (GE Healthcare, Bucks, UK) was used to develop the blots and signals detected through the Chemidoc MP System (BioRad) and band densities measured using ImageLab analysis software. Data were normalized to β-actin levels.
Lysosomal enzyme assays
GCase, beta-hexosaminidase (HEX) and beta-galactosidase (β-gal) enzymatic activities were determined at 37 °C. CE-sensitive GCase activity (end-point measurement) was determined as described [29] at pH 5.4 using 4-methylumbelliferyl-β-d-glucopyranoside as substrate in a plate reader and its activity is reported in the presence of the activator sodium taurocholate (Sigma). The increase in fluorescence of released 4-methylumbelliferone at 460 nm following excitation at 360 nm was followed after 1 h (Synergy, LabTech; Brighton, UK). Total HEX and β-gal were assayed with 4-methylumbelliferyl-2-acetoamido-2-deoxy-6-sulpho-b-D-glucopyransoside and 4-methylumbelliferyl-B-D-galactopyranoside as substrates, respectively. Enzymatic activities were normalised to the amount of proteins of the samples. Results were expressed as nmol/hour or minute/mg protein. A full length blot is shown in Supplementary Figure 2.
ATP quantification
ATP Bioluminescence was measured in a microplate by the ATP Bioluminescence Assay Kit CLS II (Roche), following manufacturer’s instructions. Briefly, different dilutions of samples and serial diluted ATP standards were included as an internal curve in a black opaque microplate. Then a volume of 50μl luciferase reagent was added and luminescence was immediately measured in a synergy device (Synergy, LabTech, Brighton, UK). ATP levels were normalised to the amount of total proteins of the samples. Results were expressed as pmol/mg protein.
Levels of mRNA
Following treatment, RNA was extracted from cells using RNeasy kit (Qiagen). RNA was converted to cDNA (Primer Design, Southampton, UK) and relative mRNA levels were measured using SYBERgreen (Applied Biosystems, Paisley, UK). Relative expression of Nestin (forward ACCAAGAGACATTCAGACTCC and reverse CCTCATCCTCATTTTCCACTCC), TFEB (forward CCAGAAGCGAGAGCTCACAGAT and reverse TGTGATTGTCTTTCTTCTGCCG, PGC1α (forward CAGAGAACAGAAACAGCAGCA and reverse TGGGGTCAGAGGAAGAGATAAA) and PINK1 (forward GGACGCTGTTCCTCGTTA and reverse ATCTGCGATCACCAGCCA). mRNA was measured with Power SYBRgreen kit (Applied Biosystems) using a STEP One PCR device (Applied Biosystems). GAPDH (forward GAAGGTGAAGGTCGGAGT and reverse GAAGATGGTGATGGGATTTC) mRNA levels were used to normalise data. Relative expression was calculated using the ΔCT method.
Statistical analysis
Low sample size only allowed us to use replicates for comparisons. One way ANOVA followed by Bonferroni’s post-hoc correction was performed using SPSS Version 20 and GraphPad Version 8 to assess whether differences between groups were present. Results were expressed as mean ± SEM and significance was set at p value < 0.05.
Ethics approval
All patients and controls included in the present study have presented their informed consent and the study has been approved by the institutional ethics committee Royal Free Research Ethics Committee (REC number 10/H0720/21). Methods have been performed in accordance with the appropriate guidelines and regulations of University College of London.
Author Contributions
AS, KYC and ET conceived the study and organized the project in collaboration with MG, DJ and CM. AS and MJ worked in the diagnosis and inclusion of all patients and collected clinical data. CM, DJ and KYC performed the experimental analysis in collaboration with MG, GG and IG. DJ, IG and MG created a database to collect all clinical and experimental parameters and performed the statistical analysis of the data, under the supervision of MG, KYC and FC. The first draft for this manuscript was written by CM, DJ, MG and KYC. MG and KYC profoundly reviewed and commented on the manuscript, adding concepts of high relevance. AS reviewed the drafts and finalised the submitted revised draft. FC and AS obtained funds to support the study, followed up and reviewed the work. All authors participated in the revision of the manuscript, in accordance with the ICMJE criteria.
Acknowledgments
We are indebted to all volunteers (patients and controls) who participated in the present study. We thank to the Spanish Government for a José Castillejo postdoctoral grant as well as UCL for offering facilities and training. Finally we are grateful to Fundació Cellex- Fundació Clínic-IDIBAPS-CIBERER for allowing the postdoctoral motility of Dr. Morén.
Conflicts of Interest
The authors declare no conflicts of interests.
Funding
CIBER de Enfermedades Raras (CIBERER), Fundació Privada Cellex (CP042187). Morén C was granted a José Castillejo (CAS15/00140) postdoctoral grant from Spanish Ministry (Ministerio de Educación, Cultura y Deporte) and Juárez-Flores DL was granted a CONACyT scholarship from the Mexican Government. The work is supported by the Medical Research Council (UK) grants MR/L501499/1 and MR/M006646/1, the National Institute for Health Research University College London Hospitals Biomedical Research Centre, and the Kattan Trust.
References
- 1. Baumann J, Gassmann K, Masjosthusmann S, DeBoer D, Bendt F, Giersiefer S, Fritsche E. Comparative human and rat neurospheres reveal species differences in chemical effects on neurodevelopmental key events. Arch Toxicol. 2016; 90:1415–27. https://doi.org/10.1007/s00204-015-1568-8 [PubMed]
- 2. Ciron C, Lengacher S, Dusonchet J, Aebischer P, Schneider BL. Sustained expression of PGC-1α in the rat nigrostriatal system selectively impairs dopaminergic function. Hum Mol Genet. 2012; 21:1861–76. https://doi.org/10.1093/hmg/ddr618 [PubMed]
- 3. Corona JC, Duchen MR. PPARγ and PGC-1α as therapeutic targets in Parkinson’s. Neurochem Res. 2015; 40:308–16. https://doi.org/10.1007/s11064-014-1377-0 [PubMed]
- 4. Chu CT, Ji J, Dagda RK, Jiang JF, Tyurina YY, Kapralov AA, Tyurin VA, Yanamala N, Shrivastava IH, Mohammadyani D, Wang KZ, Zhu J, Klein-Seetharaman J, et al. Cardiolipin externalization to the outer mitochondrial membrane acts as an elimination signal for mitophagy in neuronal cells. Nat Cell Biol. 2013; 15:1197–205. https://doi.org/10.1038/ncb2837 [PubMed]
- 5. Fernandes HJ, Hartfield EM, Christian HC, Emmanoulidou E, Zheng Y, Booth H, Bogetofte H, Lang C, Ryan BJ, Sardi SP, Badger J, Vowles J, Evetts S, et al. ER Stress and Autophagic Perturbations Lead to Elevated Extracellular α-Synuclein in GBA-N370S Parkinson’s iPSC-Derived Dopamine Neurons. Stem Cell Reports. 2016; 6:342–56. https://doi.org/10.1016/j.stemcr.2016.01.013 [PubMed]
- 6. Gegg ME, Schapira AH. Mitochondrial dysfunction associated with glucocerebrosidase deficiency. Neurobiol Dis. 2016; 90:43–50. https://doi.org/10.1016/j.nbd.2015.09.006 [PubMed]
- 7. Gegg ME, Schapira AH. The role of glucocerebrosidase in Parkinson disease pathogenesis. FEBS J. 2018; 285:3591–603. https://doi.org/10.1111/febs.14393 [PubMed]
- 8. Geisler S, Holmström KM, Skujat D, Fiesel FC, Rothfuss OC, Kahle PJ, Springer W. PINK1/Parkin-mediated mitophagy is dependent on VDAC1 and p62/SQSTM1. Nat Cell Biol. 2010; 12:119–31. https://doi.org/10.1038/ncb2012 [PubMed]
- 9. Head B, Griparic L, Amiri M, Gandre-Babbe S, van der Bliek AM. Inducible proteolytic inactivation of OPA1 mediated by the OMA1 protease in mammalian cells. J Cell Biol. 2009; 187:959–66. https://doi.org/10.1083/jcb.200906083 [PubMed]
- 10. Hoepken HH, Gispert S, Azizov M, Klinkenberg M, Ricciardi F, Kurz A, Morales-Gordo B, Bonin M, Riess O, Gasser T, Kögel D, Steinmetz H, Auburger G. Parkinson patient fibroblasts show increased alpha-synuclein expression. Exp Neurol. 2008; 212:307–13. https://doi.org/10.1016/j.expneurol.2008.04.004 [PubMed]
- 11. Ivankovic D, Chau KY, Schapira AH, Gegg ME. Mitochondrial and lysosomal biogenesis are activated following PINK1/parkin-mediated mitophagy. J Neurochem. 2016; 136:388–402. https://doi.org/10.1111/jnc.13412 [PubMed]
- 12. Keatinge M, Bui H, Menke A, Chen YC, Sokol AM, Bai Q, Ellett F, Da Costa M, Burke D, Gegg M, Trollope L, Payne T, McTighe A, et al. Glucocerebrosidase 1 deficient Danio rerio mirror key pathological aspects of human Gaucher disease and provide evidence of early microglial activation preceding alpha-synuclein-independent neuronal cell death. Hum Mol Genet. 2015; 24:6640–52. https://doi.org/10.1093/hmg/ddv369 [PubMed]
- 13. Kuliev A, Rechitsky S, Tur-Kaspa I, Verlinsky Y. Preimplantation genetics: improving access to stem cell therapy. Ann N Y Acad Sci. 2005; 1054:223–27. https://doi.org/10.1196/annals.1345.028 [PubMed]
- 14. Lépinoux-Chambaud C, Barreau K, Eyer J. The Neurofilament-Derived Peptide NFL-TBS.40-63 Targets Neural Stem Cells and Affects Their Properties. Stem Cells Transl Med. 2016; 5:901–13. https://doi.org/10.5966/sctm.2015-0221 [PubMed]
- 15. Levine B, Kroemer G. Biological Functions of Autophagy Genes: A Disease Perspective. Cell. 2019; 176:11–42. https://doi.org/10.1016/j.cell.2018.09.048 [PubMed]
- 16. Li H, Ham A, Ma TC, Kuo SH, Kanter E, Kim D, Ko HS, Quan Y, Sardi SP, Li A, Arancio O, Kang UJ, Sulzer D, Tang G. Mitochondrial dysfunction and mitophagy defect triggered by heterozygous GBA mutations. Autophagy. 2019; 15:113–30. https://doi.org/10.1080/15548627.2018.1509818 [PubMed]
- 17. MacVicar T, Langer T. OPA1 processing in cell death and disease - the long and short of it. J Cell Sci. 2016; 129:2297–306. https://doi.org/10.1242/jcs.159186 [PubMed]
- 18. Magalhaes J, Gegg ME, Migdalska-Richards A, Doherty MK, Whitfield PD, Schapira AH. Autophagic lysosome reformation dysfunction in glucocerebrosidase deficient cells: relevance to Parkinson disease. Hum Mol Genet. 2016; 25:3432–45. https://doi.org/10.1093/hmg/ddw185 [PubMed]
- 19. Mahadik SP, Mukherjee S. Cultured skin fibroblasts as a cell model for investigating schizophrenia. J Psychiatr Res. 1996; 30:421–39. https://doi.org/10.1016/S0022-3956(96)00025-8 [PubMed]
- 20. Mateizel I, De Temmerman N, Ullmann U, Cauffman G, Sermon K, Van de Velde H, De Rycke M, Degreef E, Devroey P, Liebaers I, Van Steirteghem A. Derivation of human embryonic stem cell lines from embryos obtained after IVF and after PGD for monogenic disorders. Hum Reprod. 2006; 21:503–11. https://doi.org/10.1093/humrep/dei345 [PubMed]
- 21. Matigian N, Abrahamsen G, Sutharsan R, Cook AL, Vitale AM, Nouwens A, Bellette B, An J, Anderson M, Beckhouse AG, Bennebroek M, Cecil R, Chalk AM, et al. Disease-specific, neurosphere-derived cells as models for brain disorders. Dis Model Mech. 2010; 3:785–98. https://doi.org/10.1242/dmm.005447 [PubMed]
- 22. Matigian NA, McCurdy RD, Féron F, Perry C, Smith H, Filippich C, McLean D, McGrath J, Mackay-Sim A, Mowry B, Hayward NK. Fibroblast and lymphoblast gene expression profiles in schizophrenia: are non-neural cells informative? PLoS One. 2008; 3:e2412. https://doi.org/10.1371/journal.pone.0002412 [PubMed]
- 23. Mukai T, Nagamura-Inoue T, Shimazu T, Mori Y, Takahashi A, Tsunoda H, Yamaguchi S, Tojo A. Neurosphere formation enhances the neurogenic differentiation potential and migratory ability of umbilical cord-mesenchymal stromal cells. Cytotherapy. 2016; 18:229–41. https://doi.org/10.1016/j.jcyt.2015.10.012 [PubMed]
- 24. Narendra D, Kane LA, Hauser DN, Fearnley IM, Youle RJ. p62/SQSTM1 is required for Parkin-induced mitochondrial clustering but not mitophagy; VDAC1 is dispensable for both. Autophagy. 2010; 6:1090–106. https://doi.org/10.4161/auto.6.8.13426 [PubMed]
- 25. Narendra DP, Jin SM, Tanaka A, Suen DF, Gautier CA, Shen J, Cookson MR, Youle RJ. PINK1 is selectively stabilized on impaired mitochondria to activate Parkin. PLoS Biol. 2010; 8:e1000298. https://doi.org/10.1371/journal.pbio.1000298 [PubMed]
- 26. Osellame LD, Duchen MR. Defective quality control mechanisms and accumulation of damaged mitochondria link Gaucher and Parkinson diseases. Autophagy. 2013; 9:1633–35. https://doi.org/10.4161/auto.25878 [PubMed]
- 27. Osellame LD, Rahim AA, Hargreaves IP, Gegg ME, Richard-Londt A, Brandner S, Waddington SN, Schapira AH, Duchen MR. Mitochondria and quality control defects in a mouse model of Gaucher disease—links to Parkinson’s disease. Cell Metab. 2013; 17:941–53. https://doi.org/10.1016/j.cmet.2013.04.014 [PubMed]
- 28. Park JS, Koentjoro B, Veivers D, Mackay-Sim A, Sue CM. Parkinson’s disease-associated human ATP13A2 (PARK9) deficiency causes zinc dyshomeostasis and mitochondrial dysfunction. Hum Mol Genet. 2014; 23:2802–15. https://doi.org/10.1093/hmg/ddt623 [PubMed]
- 29. Prence EM, Chaturvedi P, Newburg DS. In vitro accumulation of glucocerebroside in neuroblastoma cells: a model for study of Gaucher disease pathobiology. J Neurosci Res. 1996; 43:365–71. https://doi.org/10.1002/(SICI)1097-4547(19960201)43:3<365::AID-JNR11>3.0.CO;2-4 [PubMed]
- 30. Rainbolt TK, Lebeau J, Puchades C, Wiseman RL. Reciprocal Degradation of YME1L and OMA1 Adapts Mitochondrial Proteolytic Activity during Stress. Cell Rep. 2016; 14:2041–49. https://doi.org/10.1016/j.celrep.2016.02.011 [PubMed]
- 31. Roisen FJ, Klueber KM, Lu CL, Hatcher LM, Dozier A, Shields CB, Maguire S. Adult human olfactory stem cells. Brain Res. 2001; 890:11–22. https://doi.org/10.1016/S0006-8993(00)03016-X [PubMed]
- 32. Salama M, Lotfy A, Fathy K, Makar M, El-Emam M, El-gamal A, El-gamal M, Badawy A, Mohamed WM, Sobh M. Developmental neurotoxic effects of Malathion on 3D neurosphere system. Appl Transl Genom. 2015; 7:13–18. https://doi.org/10.1016/j.atg.2015.07.001 [PubMed]
- 33. Sánchez-Danés A, Richaud-Patin Y, Carballo-Carbajal I, Jiménez-Delgado S, Caig C, Mora S, Di Guglielmo C, Ezquerra M, Patel B, Giralt A, Canals JM, Memo M, Alberch J, et al. Disease-specific phenotypes in dopamine neurons from human iPS-based models of genetic and sporadic Parkinson’s disease. EMBO Mol Med. 2012; 4:380–95. https://doi.org/10.1002/emmm.201200215 [PubMed]
- 34. Sardiello M, Palmieri M, di Ronza A, Medina DL, Valenza M, Gennarino VA, Di Malta C, Donaudy F, Embrione V, Polishchuk RS, Banfi S, Parenti G, Cattaneo E, Ballabio A. A gene network regulating lysosomal biogenesis and function. Science. 2009; 325:473–77. https://doi.org/10.1126/science.1174447 [PubMed]
- 35. Schapira AH. Mitochondria in the aetiology and pathogenesis of Parkinson’s disease. Lancet Neurol. 2008; 7:97–109. https://doi.org/10.1016/S1474-4422(07)70327-7 [PubMed]
- 36. Schapira AH. Mitochondrial pathology in Parkinson’s disease. Mt Sinai J Med. 2011; 78:872–81. https://doi.org/10.1002/msj.20303 [PubMed]
- 37. Schöndorf DC, Aureli M, McAllister FE, Hindley CJ, Mayer F, Schmid B, Sardi SP, Valsecchi M, Hoffmann S, Schwarz LK, Hedrich U, Berg D, Shihabuddin LS, et al. iPSC-derived neurons from GBA1-associated Parkinson’s disease patients show autophagic defects and impaired calcium homeostasis. Nat Commun. 2014; 5:4028. https://doi.org/10.1038/ncomms5028 [PubMed]
- 38. Settembre C, De Cegli R, Mansueto G, Saha PK, Vetrini F, Visvikis O, Huynh T, Carissimo A, Palmer D, Klisch TJ, Wollenberg AC, Di Bernardo D, Chan L, et al. TFEB controls cellular lipid metabolism through a starvation-induced autoregulatory loop. Nat Cell Biol. 2013; 15:647–58. https://doi.org/10.1038/ncb2718 [PubMed]
- 39. Sidransky E, Nalls MA, Aasly JO, Aharon-Peretz J, Annesi G, Barbosa ER, Bar-Shira A, Berg D, Bras J, Brice A, Chen CM, Clark LN, Condroyer C, et al. Multicenter analysis of glucocerebrosidase mutations in Parkinson’s disease. N Engl J Med. 2009; 361:1651–61. https://doi.org/10.1056/NEJMoa0901281 [PubMed]
- 40. Wang X, Li H, Zheng A, Yang L, Liu J, Chen C, Tang Y, Zou X, Li Y, Long J, Liu J, Zhang Y, Feng Z. Mitochondrial dysfunction-associated OPA1 cleavage contributes to muscle degeneration: preventative effect of hydroxytyrosol acetate. Cell Death Dis. 2014; 5:e1521. https://doi.org/10.1038/cddis.2014.473 [PubMed]
- 41. Winkler-Stuck K, Wiedemann FR, Wallesch CW, Kunz WS. Effect of coenzyme Q10 on the mitochondrial function of skin fibroblasts from Parkinson patients. J Neurol Sci. 2004; 220:41–48. https://doi.org/10.1016/j.jns.2004.02.003 [PubMed]
- 42. Xu YH, Xu K, Sun Y, Liou B, Quinn B, Li RH, Xue L, Zhang W, Setchell KD, Witte D, Grabowski GA. Multiple pathogenic proteins implicated in neuronopathic Gaucher disease mice. Hum Mol Genet. 2014; 23:3943–57. https://doi.org/10.1093/hmg/ddu105 [PubMed]
- 43. Yang E, Liu N, Tang Y, Hu Y, Zhang P, Pan C, Dong S, Zhang Y, Tang Z. Generation of neurospheres from human adipose-derived stem cells. Biomed Res Int. 2015; 2015:743714. https://doi.org/10.1155/2015/743714 [PubMed]
- 44. Yang SY, Beavan M, Chau KY, Taanman JW, Schapira AH. A Human Neural Crest Stem Cell-Derived Dopaminergic Neuronal Model Recapitulates Biochemical Abnormalities in GBA1 Mutation Carriers. Stem Cell Reports. 2017; 8:728–42. https://doi.org/10.1016/j.stemcr.2017.01.011 [PubMed]
- 45. Youle RJ, Narendra DP. Mechanisms of mitophagy. Nat Rev Mol Cell Biol. 2011; 12:9–14. https://doi.org/10.1038/nrm3028 [PubMed]
- 46. Yuan Y, Zheng Y, Zhang X, Chen Y, Wu X, Wu J, Shen Z, Jiang L, Wang L, Yang W, Luo J, Qin Z, Hu W, Chen Z. BNIP3L/NIX-mediated mitophagy protects against ischemic brain injury independent of PARK2. Autophagy. 2017; 13:1754–66. https://doi.org/10.1080/15548627.2017.1357792 [PubMed]
- 47. Zhou S, Szczesna K, Ochalek A, Kobolák J, Varga E, Nemes C, Chandrasekaran A, Rasmussen M, Cirera S, Hyttel P, Dinnyés A, Freude KK, Avci HX. Neurosphere Based Differentiation of Human iPSC Improves Astrocyte Differentiation. Stem Cells Int. 2016; 2016:4937689. https://doi.org/10.1155/2016/4937689 [PubMed]