


Introduction
Gastric cancer (GC) is one of the most common malignant tumors of the digestive tract worldwide, and its morbidity and mortality are ranked 4th and 2nd, respectively, among all malignant tumors [1, 2]. Approximately two-thirds of patients present with advanced GC (AGC) at initial diagnosis, and their 5-year survival rate is only 20%–30%. Therefore, screening novel biomarkers to identify reliable therapeutic targets has become an urgent issue for the prevention and treatment of GC.
Long non-coding RNAs (lncRNAs) are a class of RNA molecules greater than 200 nucleotides in length that do not encode proteins [3, 4]. LncRNAs are abundantly present in the human transcriptome and may exert oncogenic or tumor suppressor effects [5–7] by affecting expression of target genes at the epigenetic, transcriptional, and post-transcriptional levels, and by participating in such processes as chromatin modification, genomic imprinting, and intranuclear transport [8–10]. Moreover, several studies have reported an association between aberrantly expressed lncRNAs and the development and progression of AGC [11–14]. However, the specific molecular mechanisms remain unclear.
High-throughput RNA sequencing is widely used to investigate lncRNA expression and regulation in cancer and has provided new insights into oncogenic mechanisms and potential therapeutic targets [15]. However, most studies have mainly addressed individual lncRNAs, rarely focusing on genome-wide correlations between differentially expressed lncRNAs and clinical traits [16–18]. In recent years, weighted gene co-expression network analysis (WGCNA) has been used to study the association between gene sets and clinical features to identify novel prognostic biomarkers and potential therapeutic targets [19, 20]. WGCNA quantitatively assesses the degree of association between lncRNAs and captures the complex relationship between lncRNAs and phenotypes, thereby providing an effective way to explore the mechanisms behind certain clinical features.
We applied an innovative genomic analysis method that combined differential lncRNAs expression analysis with WGCNA, and evaluated RNA sequencing data from The Cancer Genome Atlas (TCGA) to identify key lncRNAs associated with the development and progression of AGC. In addition, gene set enrichment analysis (GSEA) was conducted to explore signaling pathways related to key lncRNAs. Our results demonstrate the relevance of the hub lncRNA CASC19 as predictor of tumor stage and overall survival, and suggest CASC19 is a novel biomarker of AGC and a potential therapeutic target.
Results
Patient characteristics
The study’s workflow is presented in Figure 1. Three hundred and fifty-one AGC patients with complete clinical information were eventually included in the study. The median age at which the patients were diagnosed with gastric cancer was 67 years old, and median follow-up time was 13.1 months (range 0–124 months). Detailed demographics and clinicopathologic parameters of AGC patients are provided in Table 1.
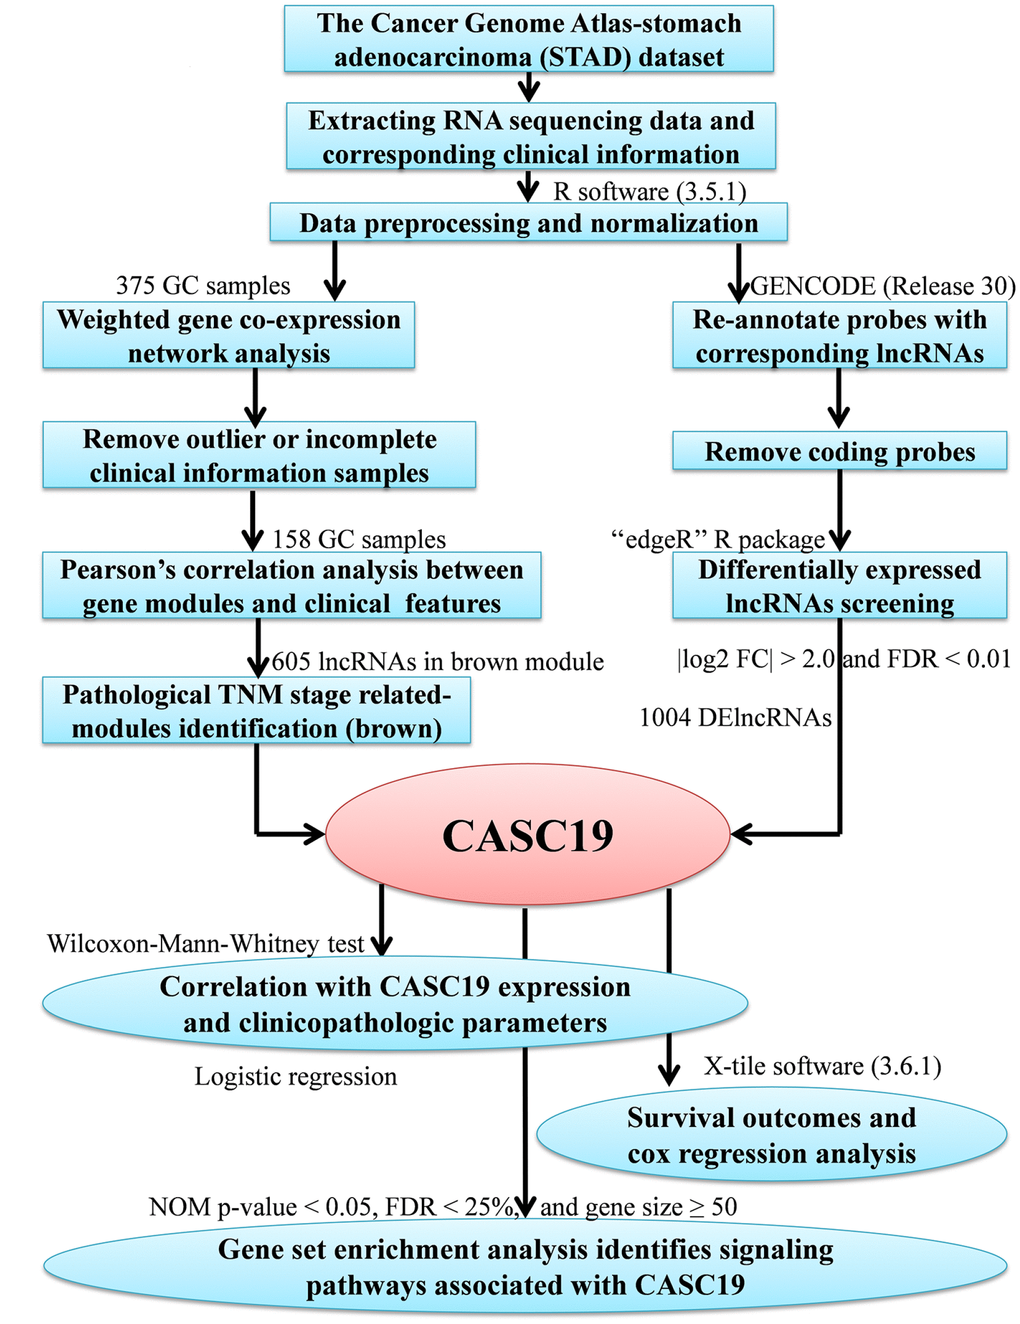
Figure 1. Study analysis flowchart.
Table 1. Demographics and clinicopathologic characteristics of AGC patients.
| Variables | Total (N) | % |
| Age (years) | ||
| <65 years | 149 | 42.5 |
| ≥65 years | 202 | 57.5 |
| Gender | ||
| Male | 224 | 63.8 |
| Female | 127 | 36.2 |
| Histologic type | ||
| Well | 9 | 2.6 |
| Moderate | 117 | 33.3 |
| Poor | 216 | 61.5 |
| Pathologic TNM stage | ||
| I | 34 | 9.7 |
| II | 109 | 31.1 |
| III | 149 | 42.5 |
| IV | 37 | 10.5 |
| Pathologic T stage | ||
| T2 | 75 | 21.4 |
| T3 | 167 | 47.6 |
| T4 | 100 | 28.5 |
| Metastatic lymph nodes | ||
| Negative | 95 | 27.1 |
| Positive | 238 | 67.8 |
| Distant metastasis | ||
| Negative | 309 | 88.0 |
| Positive | 25 | 7.1 |
| Status | ||
| Alive | 212 | 60.4 |
| Dead | 139 | 39.6 |
Identification of differentially expressed lncRNAs
A total of 1004 differentially expressed lncRNAs (DElncRNAs) were screened out between GC tissues and non-tumor tissues using “edgeR” R package with |log2 (fold change [FC])| > 2.0 and false discovery rate (FDR) < 0.01 as thresholds. Among those, 790 (78.7%) were upregulated and 214 (21.3%) were downregulated in GC tissues. All these DElncRNAs were chosen for subsequent analysis (Supplementary Table 1).
Co-expression network construction and identification of significant modules
To characterize lncRNAs profiles in AGC, a co-expression network was constructed by WGCNA. After removing outlier samples and those with incomplete clinical information, 158 samples were used to construct an adjacency matrix (Figure 2A). We selected β = 2 as the soft thresholding power to ensure a correlation coefficient close to 0.9 (Figure 2B). Then, a total of 26 different color-coded co-expression modules were identified by the dynamic Tree Cut method, and minimum lncRNA number in each cluster tree was set to 60 (Figure 2C). After combining highly similar modules (MEDissThres = 0.5, Figure 2D), 24 modules were generated, each containing 60 to 6391 lncRNAs (Figure 2E).
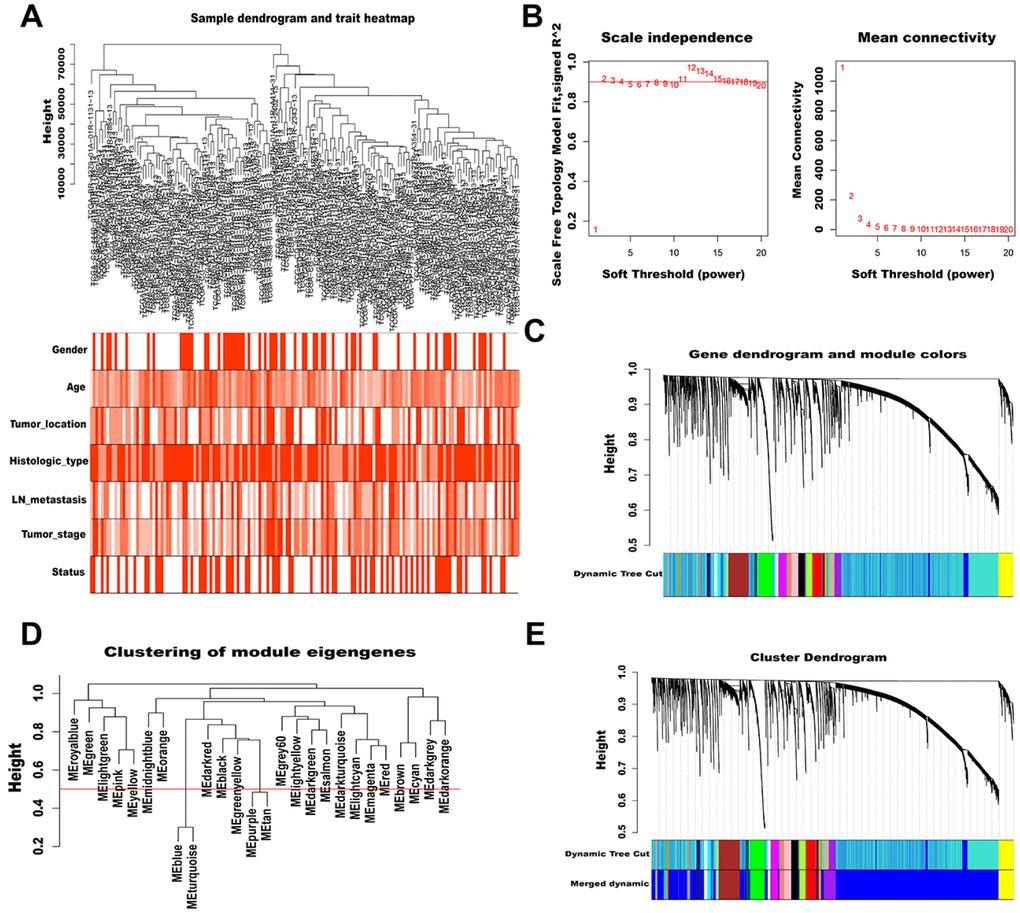
Figure 2. WGCNA of lncRNAs in AGC. (A) Sample dendrogram and trait heatmap (outliers and samples with incomplete clinical information were removed). Color depth is proportional to the strength of the correlation with clinical traits in each sample, with red and white representing highest and lowest correlation, respectively. (B) Soft-thresholding power analysis of scale independence and mean connectivity. The left graph shows the correlation coefficients that correspond to different soft-thresholding powers. The higher the coefficient, the more the network conforms to the distribution of scale-free networks. The right graph displays the mean coefficient of contiguous genes in the gene network corresponding to different soft-thresholding powers, which reflects the average connection level of the network. (C) The dynamic Tree Cut method classifies gene clustering trees. Different colors represent different gene modules, and gray indicates genes that do not belong to any known module. (D) Cluster dendrogram of module eigengenes. The value corresponding to the red line in the figure indicates the merge threshold. (E) Clustering dendrogram of genes by hierarchical clustering based on the dissimilarity TOM. Dynamic tree cut corresponds to the originally obtained module, and merged dynamic corresponds to the merged module finally obtained.
Subsequently, we analyzed the association between the generated modules and AGC clinical features (Figure 3A). The brown module (contained 605 lncRNAs) was significantly correlated with lymph node (LN) metastasis and pathological TNM stage and was selected as a significant module for further analyses. A topological overlap matrix (TOM) plot showed that each module in the network was independent of each other, further indicating that gene expression in each module was also relatively independent (Figure 3B). Therefore, we explored the co-expression similarity of all modules using eigengenes and detected three main sub-clusters (Figure 3C). Besides, we generated scatter plots of module membership (MM) versus gene significance (GS) for LN metastasis and pathological TNM stage in the brown module, and a high correlation was obtained in all cases (LN metastasis: cor = 0.21, P = 1.9e-07; pathological TNM stage: cor = 0.42, P = 3e-27; Figure 3D and 3E).
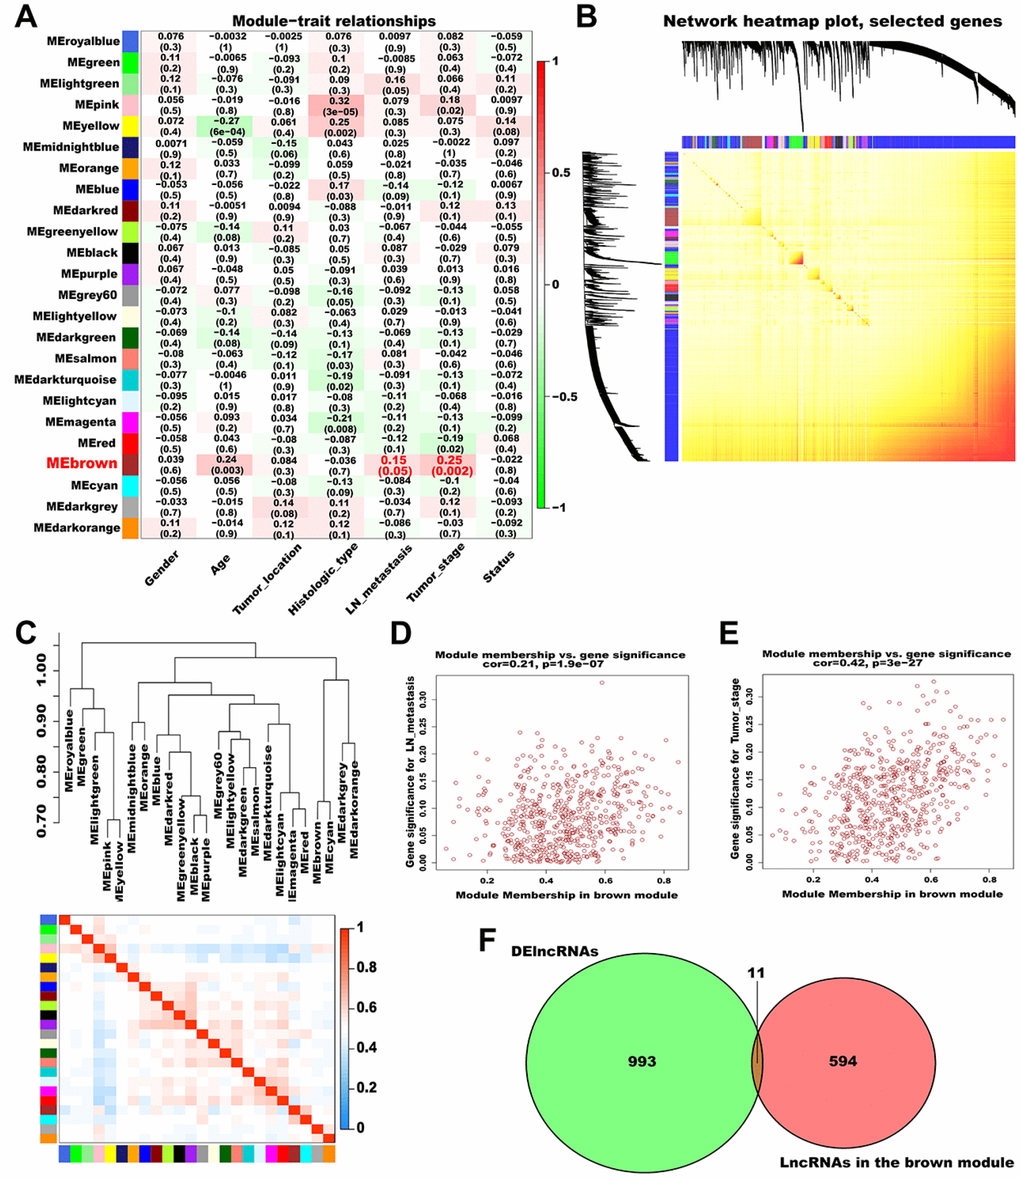
Figure 3. Identification of significant modules associated with clinical traits. (A) Relationships between module eigengenes and clinical traits of AGC. Each row in the figure corresponds to a module eigengene, and each column corresponds to a clinical trait. The correlation coefficient in each grid represents the correlation between the gene module and the clinical traits; red indicates positive correlation and green represents negative correlation. (B) TOM depicting the correlation of pairs of genes within each module. The heat map depicts the TOM from 1000 randomly selected genes from a weighted co-expression network. In the heat map, each row and column correspond to a gene; light colors indicate low topological overlap, and progressively darker yellow and red represent higher topological overlap. (C) Dendrogram heatmap of the association between modules and clinical traits. The dendrogram above shows the modules generated in the cluster analysis. Branches of the dendrogram combine positively correlated eigengenes. The heat map below shows the adjacencies in the eigengene network. Each row and column in the heat map corresponds to a module eigengene. Red indicates a positive correlation with high adjacency and blue indicates a negative correlation with low adjacency. The red square along the diagonal is the meta-module. (D) Scatter plot of MM versus GS for LN metastasis (cor = 0.21, P = 1.9e-07) in the brown module. (E) Scatter plot of MM versus GS for pathological TNM stage (cor = 0.42, P = 3e-27) in the brown module. (F) Venn plot of DElncRNAs and the lncRNAs in the brown module. Green represents the DElncRNAs and red represents the lncRNAs in the brown module.
Hub lncRNAs screening
To screen hub lncRNAs, we matched the DElncRNAs with the lncRNAs in the brown module using the “VennDiagram” R package. In total, 11 overlapping lncRNAs (AC108463.3, AL135924.2, AC008114.1, AL512413.1, MYB-AS1, AC012467.1, AP005233.2, KRT7-AS, CASC19, AC010998.1, and AC012668.3) were identified and considered as hub lncRNAs (Figure 3F, Supplementary Table 2). Among these, CASC19 had the highest MM and GS and was thus selected for deeper analysis and validation.
Table 2. CASC19 overexpression associated with clinical pathological characteristics of GC patients.
| Variables | Total (N) | OR (95% CI) | P | ||||||||||||||||||||||||||||||||||||||||||||||||||||||||||||||||||||||||||||||||||||||||||||||||
| Age (years) | |||||||||||||||||||||||||||||||||||||||||||||||||||||||||||||||||||||||||||||||||||||||||||||||||||
| <65 years | 149 | Ref. | |||||||||||||||||||||||||||||||||||||||||||||||||||||||||||||||||||||||||||||||||||||||||||||||||
| ≥65 years | 202 | 1.104 (0.684-1.773) | 0.684 | ||||||||||||||||||||||||||||||||||||||||||||||||||||||||||||||||||||||||||||||||||||||||||||||||
| Gender | |||||||||||||||||||||||||||||||||||||||||||||||||||||||||||||||||||||||||||||||||||||||||||||||||||
| Male | 224 | Ref. | |||||||||||||||||||||||||||||||||||||||||||||||||||||||||||||||||||||||||||||||||||||||||||||||||
| Female | 127 | 1.024 (0.629-1.683) | 0.926 | ||||||||||||||||||||||||||||||||||||||||||||||||||||||||||||||||||||||||||||||||||||||||||||||||
| Histology | |||||||||||||||||||||||||||||||||||||||||||||||||||||||||||||||||||||||||||||||||||||||||||||||||||
| Well | 9 | Ref. | |||||||||||||||||||||||||||||||||||||||||||||||||||||||||||||||||||||||||||||||||||||||||||||||||
| Moderate or poor | 333 | 0.338 (0.018-1.877) | 0.309 | ||||||||||||||||||||||||||||||||||||||||||||||||||||||||||||||||||||||||||||||||||||||||||||||||
| Pathologic TNM stage | |||||||||||||||||||||||||||||||||||||||||||||||||||||||||||||||||||||||||||||||||||||||||||||||||||
| I-II | 143 | Ref. | |||||||||||||||||||||||||||||||||||||||||||||||||||||||||||||||||||||||||||||||||||||||||||||||||
| III-IV | 186 | 1.942 (1.251-3.032) | 0.003 | ||||||||||||||||||||||||||||||||||||||||||||||||||||||||||||||||||||||||||||||||||||||||||||||||
| Pathologic T stage | |||||||||||||||||||||||||||||||||||||||||||||||||||||||||||||||||||||||||||||||||||||||||||||||||||
| T2 | 76 | Ref. | |||||||||||||||||||||||||||||||||||||||||||||||||||||||||||||||||||||||||||||||||||||||||||||||||
| T3-T4 | 267 | 1.813 (1.045-3.110) | 0.032 | ||||||||||||||||||||||||||||||||||||||||||||||||||||||||||||||||||||||||||||||||||||||||||||||||
| Metastatic lymph nodes | |||||||||||||||||||||||||||||||||||||||||||||||||||||||||||||||||||||||||||||||||||||||||||||||||||
| Negative | 95 | Ref. | |||||||||||||||||||||||||||||||||||||||||||||||||||||||||||||||||||||||||||||||||||||||||||||||||
| Positive | 238 | 2.706 (1.653-4.503) | <0.001 | ||||||||||||||||||||||||||||||||||||||||||||||||||||||||||||||||||||||||||||||||||||||||||||||||
| Distant metastasis | |||||||||||||||||||||||||||||||||||||||||||||||||||||||||||||||||||||||||||||||||||||||||||||||||||
| Negative | 309 | Ref. | |||||||||||||||||||||||||||||||||||||||||||||||||||||||||||||||||||||||||||||||||||||||||||||||||
| Positive | 25 | 2.090 (0.769-7.319) | 0.188 | ||||||||||||||||||||||||||||||||||||||||||||||||||||||||||||||||||||||||||||||||||||||||||||||||
| Bold values indicate P < 0.05. | |||||||||||||||||||||||||||||||||||||||||||||||||||||||||||||||||||||||||||||||||||||||||||||||||||
Correlation between CASC19 expression and clinicopathologic parameters
The upregulation of CASC19 in AGC samples (Figure 4A and 4B) was significantly associated with pathologic T stage (P = 0.034), pathologic TNM stage (P = 0.022), and LN metastasis (P < 0.001), but not with other clinicopathologic parameters (Figure 4C–4K). The optimal cutoff value for CASC19 was confirmed as 0.57 by using X-tile software. Next, AGC patients were divided into high (n = 256 cases) and low (n = 95 cases) CASC19 expression groups based on the optimal cutoff value. Univariate logistic regression using R software indicated that CASC19 overexpression significantly correlated with higher pathologic TNM stage (I-II vs. III-IV; Odds ratio [OR] = 1.942, 95% confidence interval [CI] = 1.251-3.032, P = 0.003), higher pathologic T stage (T2 vs. T3-T4; OR = 1.813, 95% CI = 1.045-3.110, P = 0.032), and LN metastasis (negative vs. positive; OR = 2.706, 95% CI = 1.653-4.503, P < 0.001) (Table 2). These results revealed that AGC patients with CASC19 overexpression are more susceptible to carcinogenesis and progression.
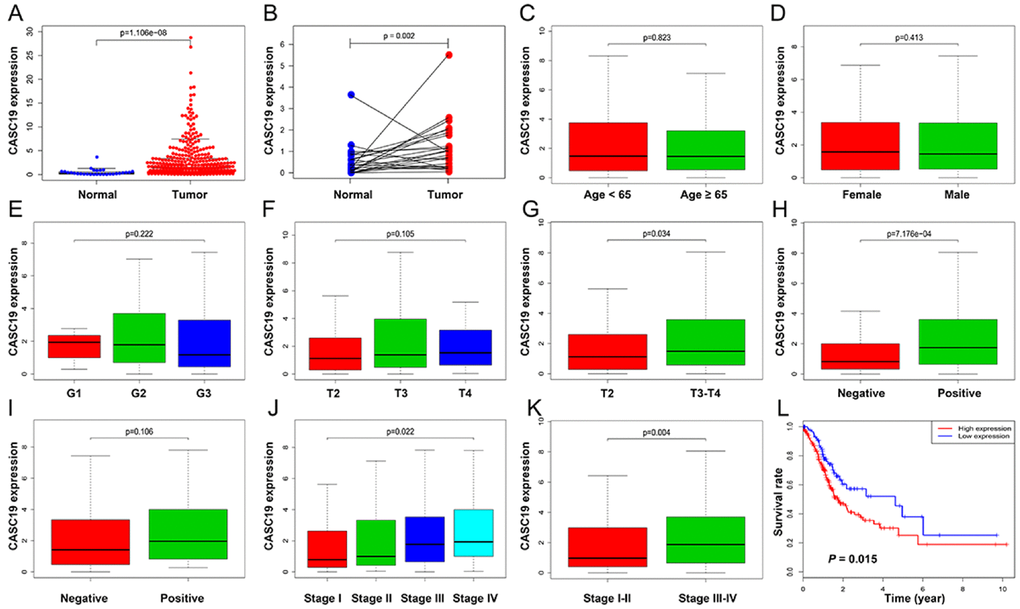
Figure 4. Correlation between CASC19 expression and clinicopathologic parameters. (A) CASC19 expression comparison between AGC tissues and non-tumor tissues. (B) CASC19 expression comparison between AGC tissues and paired non-tumor tissues. (C) CASC19 expression comparison between different age groups. (D) CASC19 expression comparison between genders. (E) CASC19 expression comparison based on tumor histology. (F) and (G) CASC19 expression comparison between different pathologic T stages. (H) CASC19 expression based on metastatic LN status. (I) CASC19 expression based on distant metastasis status. (J) and (K) CASC19 expression comparison between different pathologic TNM stages. (L) Kaplan–Meier survival curves. AGC patients with high CASC19 expression (≥ 0.57) had significantly worse prognosis than those with low CASC19 expression (< 0.57) for overall survival.
CASC19 overexpression predicts poor prognosis in AGC
AGC patients with high CASC19 expression (≥ 0.57) had significantly worse prognosis than those with low CASC19 expression (< 0.57) for overall survival (Figure 4L, P = 0.015). Univariate Cox analysis showed that CASC19 expression was associated with shorter overall survival (low vs. high; Hazard Ratio [HR] = 1.637, 95% CI = 1.096-2.447, P = 0.016), and so were age (P = 0.016), pathologic TNM stage (P = 0.005), and LN metastasis (P = 0.036). Multivariable Cox analysis confirmed that CASC19 overexpression was an independent prognostic factor for overall survival (low vs. high; HR = 1.524, 95% CI = 1.003-2.316, P = 0.049; Table 3).
Table 3. Univariate and multivariate analysis of the correlation of CASC19 expression with OS among GC patients.
| Variables | Univariate analysis | Multivariate analysis | |||||||||||||||||||||||||||||||||||||||||||||||||||||||||||||||||||||||||||||||||||||||||||||||||
| HR | 95% CI | P | HR | 95% CI | P | ||||||||||||||||||||||||||||||||||||||||||||||||||||||||||||||||||||||||||||||||||||||||||||||
| Age (years) | |||||||||||||||||||||||||||||||||||||||||||||||||||||||||||||||||||||||||||||||||||||||||||||||||||
| <65 years | Ref. | Ref. | |||||||||||||||||||||||||||||||||||||||||||||||||||||||||||||||||||||||||||||||||||||||||||||||||
| ≥65 years | 1.542 | 1.085-2.192 | 0.016 | 1.585 | 1.096-2.291 | 0.014 | |||||||||||||||||||||||||||||||||||||||||||||||||||||||||||||||||||||||||||||||||||||||||||||
| Gender | |||||||||||||||||||||||||||||||||||||||||||||||||||||||||||||||||||||||||||||||||||||||||||||||||||
| Male | Ref. | ||||||||||||||||||||||||||||||||||||||||||||||||||||||||||||||||||||||||||||||||||||||||||||||||||
| Female | 0.857 | 0.599-1.226 | 0.399 | ||||||||||||||||||||||||||||||||||||||||||||||||||||||||||||||||||||||||||||||||||||||||||||||||
| Histology | |||||||||||||||||||||||||||||||||||||||||||||||||||||||||||||||||||||||||||||||||||||||||||||||||||
| Well | Ref. | ||||||||||||||||||||||||||||||||||||||||||||||||||||||||||||||||||||||||||||||||||||||||||||||||||
| Moderate or poor | 1.931 | 0.477-7.814 | 0.356 | ||||||||||||||||||||||||||||||||||||||||||||||||||||||||||||||||||||||||||||||||||||||||||||||||
| Pathologic TNM stage | |||||||||||||||||||||||||||||||||||||||||||||||||||||||||||||||||||||||||||||||||||||||||||||||||||
| I-II | Ref. | Ref. | |||||||||||||||||||||||||||||||||||||||||||||||||||||||||||||||||||||||||||||||||||||||||||||||||
| III-IV | 1.699 | 1.175-2.456 | 0.005 | 1.501 | 0.902-2.499 | 0.118 | |||||||||||||||||||||||||||||||||||||||||||||||||||||||||||||||||||||||||||||||||||||||||||||
| Pathologic T stage | |||||||||||||||||||||||||||||||||||||||||||||||||||||||||||||||||||||||||||||||||||||||||||||||||||
| T2 | Ref. | ||||||||||||||||||||||||||||||||||||||||||||||||||||||||||||||||||||||||||||||||||||||||||||||||||
| T3-T4 | 1.470 | 0.955-2.262 | 0.080 | ||||||||||||||||||||||||||||||||||||||||||||||||||||||||||||||||||||||||||||||||||||||||||||||||
| Metastatic lymph nodes | |||||||||||||||||||||||||||||||||||||||||||||||||||||||||||||||||||||||||||||||||||||||||||||||||||
| Negative | Ref. | ||||||||||||||||||||||||||||||||||||||||||||||||||||||||||||||||||||||||||||||||||||||||||||||||||
| Positive | 1.573 | 1.031-2.400 | 0.036 | 1.123 | 0.623-2.024 | 0.700 | |||||||||||||||||||||||||||||||||||||||||||||||||||||||||||||||||||||||||||||||||||||||||||||
| Distant metastasis | |||||||||||||||||||||||||||||||||||||||||||||||||||||||||||||||||||||||||||||||||||||||||||||||||||
| Negative | Ref. | ||||||||||||||||||||||||||||||||||||||||||||||||||||||||||||||||||||||||||||||||||||||||||||||||||
| Positive | 1.760 | 0.945-3.279 | 0.074 | ||||||||||||||||||||||||||||||||||||||||||||||||||||||||||||||||||||||||||||||||||||||||||||||||
| CASC19 expression | |||||||||||||||||||||||||||||||||||||||||||||||||||||||||||||||||||||||||||||||||||||||||||||||||||
| Low | Ref. | Ref. | |||||||||||||||||||||||||||||||||||||||||||||||||||||||||||||||||||||||||||||||||||||||||||||||||
| High | 1.637 | 1.096-2.447 | 0.016 | 1.524 | 1.003-2.316 | 0.049 | |||||||||||||||||||||||||||||||||||||||||||||||||||||||||||||||||||||||||||||||||||||||||||||
| Bold values indicate P < 0.05. | |||||||||||||||||||||||||||||||||||||||||||||||||||||||||||||||||||||||||||||||||||||||||||||||||||
GSEA identifies signaling pathways associated with CASC19
To explore potential signaling pathways relating CASC19 to AGC, GSEA was empolyed to identify Kyoto Encyclopedia of Genes and Genomes (KEGG) pathways enriched in AGC samples with high CASC19 expression. Results highlighted 30 enriched gene sets with Nominal (NOM) p < 0.05, FDR < 25%, and gene size ≥ 50. Interestingly, most of the gene sets are concentrated on ‘cancer-related’ and ‘classical signaling’ pathways. The top eight representative pathways were “pathways in cancer”, “neuroactive ligand receptor interaction”, “MAPK signaling pathway”, “regulation of actin cytoskeleton”, “focal adhesion”, “calcium signaling pathway”, “wnt signaling pathway” and “insulin signaling pathway” (Figure 5 and Supplementary Table 3).
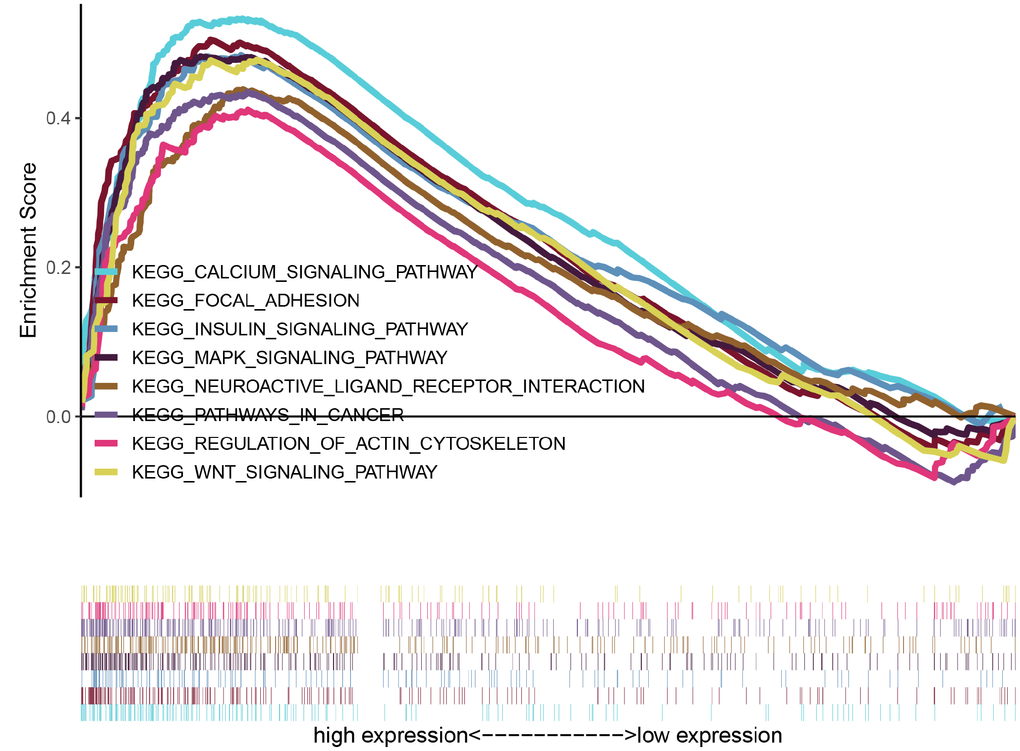
Figure 5. GSEA identifies eight representative pathways enriched in AGC samples with high CASC19 expression.
CASC19 knockdown inhibits GC cell proliferation and metastasis
To further investigate the role of CASC19 in GC progression, we firstly determined CASC19 expression in four human GC cell lines (AGS, BGC-823, MGC-803, and HGC-27) and in a normal gastric mucosal epithelial cell line (GES-1) by quantitative real-time PCR (qRT-PCR). CASC19 expression was upregulated in all four GC cell lines, and especially in BGC-823 cells, compared to GES-1 cells (P < 0.001; Figure 6A). Thus, we selected the BGC-823 cell line to further explore the pathogenic mechanism of CASC19 in GC. To this end, CASC19 expression was downregulated in BGC-823 cells using three specific siRNAs targeting CASC19 (siCASC19). Based on the interference efficiency of these specific siRNAs, si-CASC19-2 was used in the following experiments (Figure 6B). The Cell Counting Kit-8 (CCK-8) assay showed that CASC19 knockdown significantly inhibited cell proliferation in BGC-823 cells (Figure 6C). Furthermore, the colony formation assay showed that the number and size of all colonies in the CASC19 knockdown group were significantly reduced compared with the control group (Figure 6D), indicating that CASC19 also promotes anchorage-independent growth of GC cells. Additionally, CASC19 knockdown markedly suppressed migration and invasion of BGC-823 cells (Figure 6E and 6F). These findings demonstrate that knockdown of CASC19 inhibits proliferation and metastasis in GC cells.
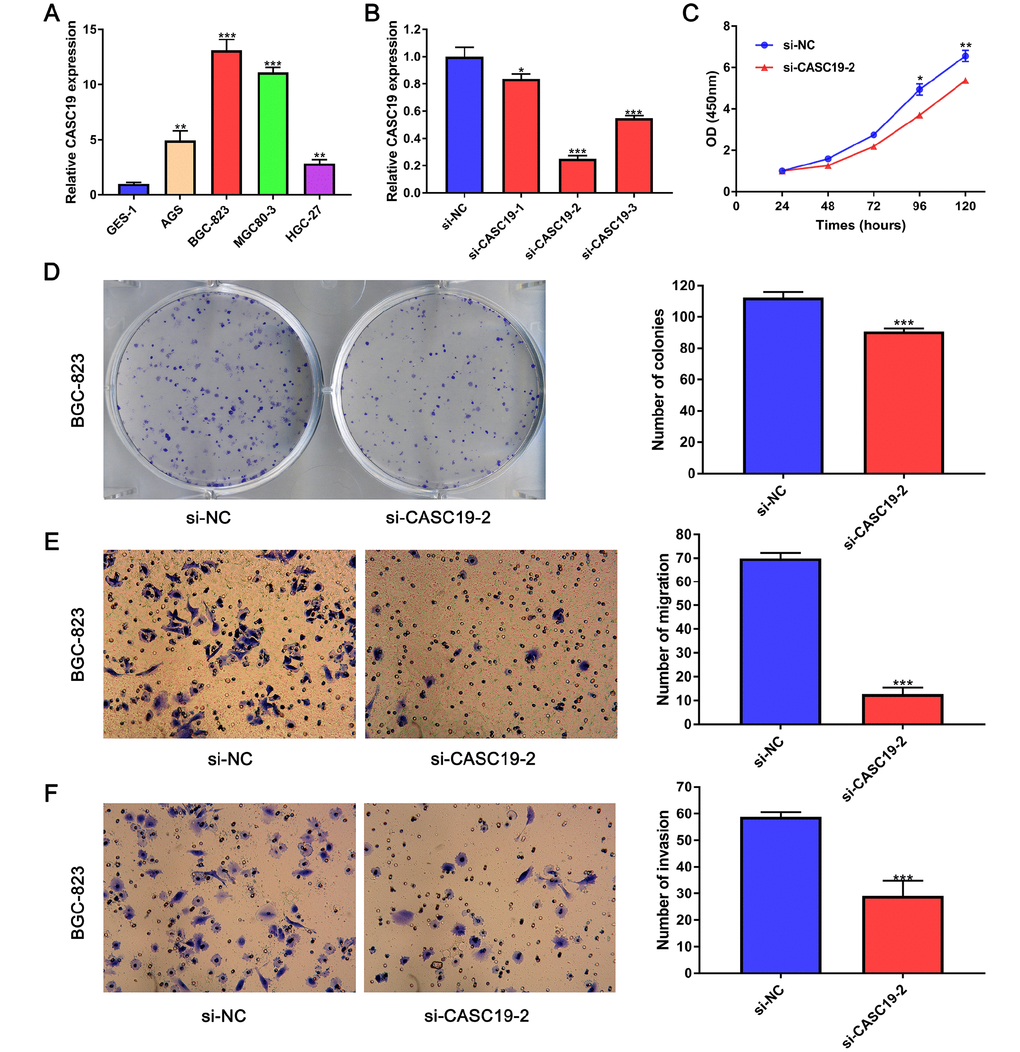
Figure 6. CASC19 knockdown inhibits GC cell proliferation and metastasis. (A) qRT-PCR analysis of CASC19 expression in four GC cell lines (AGS, BGC-823, MGC-803, and HGC-27) and a normal gastric mucosal epithelial cell line (GES-1). (B) qRT-PCR showing successful CASC19 knockdown in BGC-823 cells using si-CASC19-2. (C) CASC19 knockdown inhibits proliferation in BGC-823 cells. (D) Colony formation is increased after CASC19 knockdown. (E) and (F) CASC19 silencing decreases cell migration in Transwell assays. All data are presented as mean ± standard deviation of three independent experiments. *P < 0.05;**P < 0.01; ***P < 0.001.
Discussion
Accumulating evidence has revealed that aberrantly expressed lncRNAs contribute to the development and progression of AGC [12–14]. Multiple studies also confirmed that several lncRNAs such as HOTAIR, H19 and MALAT1 have a pivotal function in the carcinogenesis of AGC and are expected to become therapeutic targets for its treatment [21–27]. Here, we successfully performed an innovative genomic analysis method that combined differential lncRNA expression profiling with WGCNA to identify key lncRNAs associated with development and progression of AGC. Remarkably, we found that CASC19 was upregulated in AGC tissues and this phenomenon was highly correlated with higher clinicopathologic parameters and worse prognosis in AGC patients.
CASC19, also known as CARLo-6 and LINC01245, is a long intergenic non-coding RNA of 324 bp in length encoded on chromosome 8q24.21 [28]. This region lacks protein-coding genes, so it has been called a 'gene desert' or 'ncRNA oasis' [29]. Previous genome-wide association studies (GWAS) have demonstrated multiple genetic variants in the 8q24.21 region that significantly increase the susceptibility of some cancers, such as colorectal, prostate, and breast cancer [28, 30–33]. Sotelo et al. [30] reported that cancer-associated single nucleotide polymorphism (SNP) rs6983267, which regulates enhancer activity in this region, can regulate the transcription of the nearest annotated gene, the proto-oncogene MYC. Kim et al. [28] found that the SNP rs6983267 regulates the expression of CCAT1 in this region through long-range interaction with its promoter in colorectal cancer (CRC), while Wasserman et al. [29] showed that rs6983267 correlates with MYC expression in prostate cancer. Based on these findings, we hypothesis that CASC19, along with other lncRNAs in this chromosomal region, may also be critically involved in the progression of cancer.
CASC19 has been reported to enhance proliferation of CRC cells, and to promote cell migration by acting as a competitive endogenous RNA that induces hyaluronidase 1 expression by sponging miR-140-5p [34]. GWAS studies have showed that upregulation of the CASC19 gene containing the SNP rs138042437 greatly increases prostate cancer susceptibility [35–37]. Meanwhile, Ozawa et al. [31] described that CASC19 was significantly upregulated in CRC specimens compared with normal colonic tissue. However, few studies have investigated the role of CASC19 in AGC. In this work, we demonstrated that CASC19 expression is upregulated in AGC and is positively associated with pathologic T stage, TNM stage, and LN metastasis. These findings suggest that CASC19 overexpression may be related to carcinogenesis and progression of AGC. Additionally, CASC19 overexpression correlated with poor overall survival in AGC patients and was an independent prognostic factor for overall survival in AGC. Altogether, our data suggest that CASC19 can be considered an oncogene and might be a novel candidate biomarker for the prognosis and therapy of AGC.
This hypothesis was substantiated by in vitro experiments that showed that CASC19 was upregulated in human GC cell lines, and that si-RNA-mediated knockdown inhibited proliferation, anchorage-independent growth, migration, and invasion in the BGC-823 cell line. Interestingly, CASC19 seems to affect more on migration and invasion than proliferation in BGC-823 cell line. This may be due to the fact that the downstream genes affected by CASC19 knockdown are preferentially associated to cell migration and invasion. However, further RNA-seq and pathway analyses are required to validate the changes in their expression caused by CASC19 knockdown. Therefore, we will verify this in the next mechanism study.
We performed GSEA analysis to elucidate potential functions of CASC19. Interestingly, for the CASC19 high-expression phenotype most gene sets were significantly enriched in the ‘cancer-related’ and ‘classical signaling’ pathways. Within these categories, CASC19 high-expression samples were significantly enriched in ‘focal adhesion’, ‘neuroactive ligand receptor interaction’, and ‘regulation of actin cytoskeleton’ pathways. Focal adhesion are macromolecular assemblies associated to the plasma membrane that mediate strong adhesion to the extracellular matrix and influence signaling pathways closely related to cell differentiation, proliferation, and invasion [38–40]. Xu et al. [41] found that GSEA’s ‘neuroactive ligand receptor interaction’ pathway was highly upregulated and contributed to the oncogenesis of endometrial carcinoma, and the influence of this pathway has been recently reported also for AGC [42–44]. Many studies have also proved that changes in the actin cytoskeleton contribute to cancer cell migration and invasion [45–47]. Meanwhile, GSEA identified that CASC19 may participate in the carcinogenesis of AGC by regulating the MAPK, calcium, wnt and insulin signaling pathways. Indeed, previous studies demonstrated that the MAPK and wnt signaling pathway are critical for GC cell proliferation, apoptosis, and metastasis [48–51]. Huang et al. [52] indicated that a positive feedback loop between the calcium signaling pathway and mitochondrial fission promotes autophagy in hepatocellular carcinoma cells. Regarding GC, several calcium signaling alterations have been reported to contribute to its progression [53–55]. Meanwhile, the insulin signaling pathway is primarily involved in the pathogenesis of human obesity and type 2 diabetes [56], conditions that are known to facilitate the development of several cancers [57, 58], including GC [59].
The major limitation of this study is that the specific mechanisms by which CASC19 overexpression may contribute to AGC have not been fully explored. In future studies we will use clinical data and in vivo experiments to verify and further explore upstream and downstream interactions of CASC19 in GC.
Conclusions
Our study suggested that CASC19 is involved in the progression of AGC, probably by regulating the MAPK, calcium, wnt, and insulin signaling pathways, and therefore arises as a novel prognostic indicator and potential therapeutic target. Further experiments are needed to elucidate the molecular mechanisms affected by CASC19 in the carcinogenesis of AGC, which may lead to more effective treatment strategies.
Materials and Methods
Study design and data collection
GC patient RNA sequencing data and clinical information were downloaded from TCGA (https://portal.gdc.cancer.gov/) database on April 30, 2019 using the Data Transfer Tool. We obtained 407 samples in total (375 tumor and 32 normal tissue samples; data type: FPKM; platform: IlluminaHiseq; project ID: TCGA-STAD) to identify differentially expressed lncRNAs. Afterwards, GC tissue samples with complete clinical data were selected to acquire hub lncRNAs. Next, patients with pT2-4aN0-3M0-1 and complete survival information were further collected for subsequent analysis, and 351 eligible patients were finally retained (Table 1).
Data pre-processing and DElncRNAs screening
In this step, we applied the GENCODE gene annotation file (Release 30/GRCh38.p12) (https://www.gencodegenes.org/human/) to re-annotate probes with corresponding lncRNAs [60]. For multiple probes corresponding to an identical lncRNA, the average was calculated as its final expression value. The “edgeR” R package (version 3.24.0) was employed to identify DElncRNAs between GC tissues and non-tumor tissues [61]. A |log2 FC| > 2.0 and a FDR < 0.01 were set as thresholds.
Weighted gene co-expression network construction
To evaluate potential contributions of lncRNAs to the molecular mechanism of AGC, WGCNA was carried out to construct an lncRNA co-expression network using the “WGCNA” R package (version 1.66) [62]. First, the goodSamplesGenes function was used to remove lncRNAs and samples with missing values, and the sample hierarchical clustering-pruning method was applied to remove outlier samples before building a network [63]. Second, the adjacency matrix was constructed by calculating the connection strength of each pair of genes according to the following formula: aij = power (Sij, β) = |Si, j|β, where aij represents the adjacency function between gene i and gene j, and β is the soft thresholding power [64]. Third, the adjacency matrix was converted to a TOM by calculating the degree of association between lncRNAs [65]. The TOMi, j between lncRNA i and lncRNA j was calculated by the following formula: TOMi, j = ∑uaiuauj + aij / [min (ki, kj) + 1− aij], where ∑uaiuauj denotes the sum of the products of the adjacent coefficients of the nodes in which the lncRNA i and the lncRNA j are connected in common, and ki = ∑uaiu signifies the sum of the adjacency coefficients of all nodes to which lncRNA i is individually connected. Next, TOM was converted into a dissimilarity TOM (dissTOMi, j = 1− TOMi, j), and the dynamic Tree Cut method was used to establish a hierarchical clustering tree according to the similarity and dissimilarity matrices (TOMi, j and dissTOMi, j) [66]. The minimum number of lncRNAs in each clustering tree was set as 60, and the threshold for similar modules to be merged was set to 0.5 [67].
Identification of clinical significant modules
In order to find lncRNAs significantly related to AGC, two approaches were performed in this study. First, module eigengenes (MEs) were calculated according to the overall level of expression of all lncRNAs in the module. In our study, the relationship between MEs and pathologic TNM stage was applied to screen the most significant module. Second, GS was defined as the value of the correlation coefficient between each lncRNA gene’s expression profile and every clinical trait, and MS was defined as the average GS for all lncRNAs contained in the module. In general, a higher MS indicated a higher correlation between this module and the phenotype. Third, MM of each lncRNA in the module was defined as the correlation coefficient between each lncRNA and the ME. The module with the highest correlation to pathologic TNM stage was chosen for further analysis. LncRNA with the highest MM and GS in the selected module was considered as a hub lncRNA and further analyzed.
Hub lncRNAs screening
We selected the module with the highest correlation with pathologic TNM staging for further analysis. “VennDiagram” R package (version 1.6.20) was used to to screen out relevant lncRNAs among those in the selected module and the previously obtained DElncRNAs [68]. We considered overlapping lncRNA with the highest MM and GS as a hub lncRNAs, and those was selected for deeper analysis and validation.
Correlation with hub lncRNAs expression and clinicopathologic parameters
To investigate the relationship between hub lncRNA expression and clinicopathologic parameters, we comprehensively analyzed the differential expression of hub lncRNAs in relation to various clinicopathologic parameters including age, gender, histology, pathological TNM stage, pathological T stage, LN metastasis, and distant metastasis. Wilcoxon-Mann-Whitney test and logistic regression were conducted using R software (version 3.5.1). ORs and the corresponding 95% CIs were assessed and a two tailed P < 0.05 was considered statistically significant.
Survival outcomes and cox regression analysis
X-tile software (version 3.6.1) was used to calculate the optimal cutoff value for hub lncRNA expression according to the maximum χ2 test and the minimum P-value [69]. Next, AGC patients were divided into high- and low- expression groups based on the optimal cutoff value for hub lncRNA. Survival analysis was performed by the Kaplan–Meier method with log-rank test. Univariate and multivariate analyses used the Cox proportional hazards regression model to estimate risk factors for overall survival, and results were presented as HRs with 95% CIs. Statistical analyses were performed through SPSS 23.0 (SPSS INC., Chicago, IL, USA). All statistical tests were two-sided, and P < 0.05 was considered statistically significant.
GSEA
GSEA (http://software.broadinstitute.org/gsea/index.jsp) was performed to elucidate potential functions of hub lncRNA [70, 71]. AGC samples were divided into a high-expression group and a low-expression group depending on the expression level of hub lncRNA. We chose the annotated gene set of c2.cp.kegg.v6.2.symbols.gmt as a reference and selected the expression level of hub lncRNA as a phenotype label. The number of permutations of GSEA was set as 1000 times for each analysis. NOM P < 0.05, FDR less than 25%, and gene size more than 50 were chosen as the thresholds.
Cell culture and transfection
Human GC cell lines (AGS, BGC-823, MGC-803, and HGC-27) and a normal gastric mucosal epithelial cell line (GES-1) were purchased from the Chinese Academy of Sciences (Shanghai, China). Cells were cultured in Dulbecco’s modified Eagle’s medium (DMEM) supplemented with 10% fetal bovine serum (FBS) (Gibco) at 37 °C with 5% CO2. Three CASC19 small interfering RNAs (siRNAs, si-CASC19) and a scrambled negative control siRNA (si-NC) were designed and synthesized by GenePharma (Shanghai, China). The siRNA sequences are shown in Supplementary Table 4. Transfections were conducted using Lipofectamine 2000 (Invitrogen) according to the manufacturer's instructions. Cells were harvested 48 hours after transfection for subsequent experiments.
qRT-PCR
Total RNA was extracted using Trizol (SuperfecTRI, Shanghai, China) in accordance with the manufacturer’s instructions. qRT-PCR was performed with SYBR Green Master Mixture (Takara, Dalian, China). Primer sequences are available in Supplementary Table 4. GAPDH was used as the endogenous control. Relative CASC19 expression levels were calculated using the 2−ΔΔct method.
Cell proliferation assay
The CCK-8 kit (Dojindo, Japan) was used to detect the effect of CASC19 knockdown on GC cell proliferation. BGC-823 cells were seeded into 96-well plates at a concentration of 2,000 cells/well. At 1, 2, 3, 4, and 5 days post-seeding CCK-8 was added to wells for 2 hours and its absorbance measured at 450 nm to estimate cell numbers.
Colony formation assay
BGC-823 cells were seeded into 6-well plates at a concentration of 1,000 cells/well 3 days posttransfection. Cells were cultured for 10 days, and then fixed with 4% paraformaldehyde for 30 minutes, washed once with PBS, and stained with 0.1% crystal violet for 10 minutes. Colony formation was quantified using Image J software (National Institutes of Health, Bethesda, MD, USA).
Cell migration and invasion assays
Cell migration and invasion assays were carried out using Transwell chamber inserts (8-μm pores; Corning, NY, USA) in a 24-well plate. BGC-823 cells (1 × 10⁵) were suspended in serum-free medium and seeded in Matrigel-coated chambers and in non-coated chambers for invasion and migration assays, respectively. DMEM containing 30% FBS was added to the lower chamber and plates were maintained in a 37 °C incubator for 24 hours. Next, migrating/invading cells were fixed with methanol and stained with 0.1% crystal violet, and counted in three randomly selected fields using Image J software.
Statistical analysis
All data were analyzed with GraphPad Prism 7 software (San Diego, CA, USA). Differences between two groups were assessed by Student’s t-test. All experiments were repeated three times and average results were calculated. A two-sided P < 0.05 was considered statistically significant.
Ethical approval
This study was approved by the Institute’s Research Ethics Committee of The 940th Hospital of Joint Logistics Support Force of Chinese People’s Liberation Army (2019KYLL010).
Author Contributions
WJW and HBL conceived and designed the study. CAG, JPY, YY, and ZPX extracted and collected the data. JZ, JW, and WAW analyzed the data. WJW, CAG, and ZPX performed experiments. CAG, AZ, and HTL prepared figures and tables. WJW, RL, CW, and HBL wrote and revised the draft manuscript. All authors reviewed and approved the final manuscript.
Acknowledgments
The authors would like to thank the TCGA research network and the GSEA team (Broad institute, MIT) for their efforts to make genomic data and analysis tools publicly available and free to use.
Conflicts of Interest
No potential conflicts of interests were reported by the authors.
Funding
This study was supported by Cuiying Graduate Supervisor Applicant Training Program of Lanzhou University Second Hospital, Huimin plan of Ministry of Science and Technology of China (2012GS620101), and Major Projects of Science and Technology of Gansu Province (2011GS04390).
References
- 1. Siegel RL, Miller KD, Jemal A. Cancer statistics, 2019. CA Cancer J Clin. 2019; 69:7–34. https://doi.org/10.3322/caac.21551 [PubMed]
- 2. Bray F, Ferlay J, Soerjomataram I, Siegel RL, Torre LA, Jemal A. Global cancer statistics 2018: GLOBOCAN estimates of incidence and mortality worldwide for 36 cancers in 185 countries. CA Cancer J Clin. 2018; 68:394–424. https://doi.org/10.3322/caac.21492 [PubMed]
- 3. Kopp F, Mendell JT. Functional Classification and Experimental Dissection of Long Noncoding RNAs. Cell. 2018; 172:393–407. https://doi.org/10.1016/j.cell.2018.01.011 [PubMed]
- 4. Uszczynska-Ratajczak B, Lagarde J, Frankish A, Guigó R, Johnson R. Towards a complete map of the human long non-coding RNA transcriptome. Nat Rev Genet. 2018; 19:535–48. https://doi.org/10.1038/s41576-018-0017-y [PubMed]
- 5. Berger AC, Korkut A, Kanchi RS, Hegde AM, Lenoir W, Liu W, Liu Y, Fan H, Shen H, Ravikumar V, Rao A, Schultz A, Li X, et al. A Comprehensive Pan-Cancer Molecular Study of Gynecologic and Breast Cancers. Cancer Cell. 2018; 33:690–705.e9. https://doi.org/10.1016/j.ccell.2018.03.014 [PubMed]
- 6. Chen F, Chen J, Yang L, Liu J, Zhang X, Zhang Y, Tu Q, Yin D, Lin D, Wong PP, Huang D, Xing Y, Zhao J, et al. Extracellular vesicle-packaged HIF-1α-stabilizing lncRNA from tumour-associated macrophages regulates aerobic glycolysis of breast cancer cells. Nat Cell Biol. 2019; 21:498–510. https://doi.org/10.1038/s41556-019-0299-0 [PubMed]
- 7. Wang Z, Yang B, Zhang M, Guo W, Wu Z, Wang Y, Jia L, Li S; Cancer Genome Atlas Research N, Xie W, Yang D. lncRNA Epigenetic Landscape Analysis Identifies EPIC1 as an Oncogenic lncRNA that Interacts with MYC and Promotes Cell-Cycle Progression in Cancer. Cancer Cell. 2018; 33:706–20.e9. https://doi.org/10.1016/j.ccell.2018.03.006 [PubMed]
- 8. Fanucchi S, Fok ET, Dalla E, Shibayama Y, Börner K, Chang EY, Stoychev S, Imakaev M, Grimm D, Wang KC, Li G, Sung WK, Mhlanga MM. Immune genes are primed for robust transcription by proximal long noncoding RNAs located in nuclear compartments. Nat Genet. 2019; 51:138–50. https://doi.org/10.1038/s41588-018-0298-2 [PubMed]
- 9. Yao RW, Wang Y, Chen LL. Cellular functions of long noncoding RNAs. Nat Cell Biol. 2019; 21:542–51. https://doi.org/10.1038/s41556-019-0311-8 [PubMed]
- 10. Kirk JM, Kim SO, Inoue K, Smola MJ, Lee DM, Schertzer MD, Wooten JS, Baker AR, Sprague D, Collins DW, Horning CR, Wang S, Chen Q, et al. Functional classification of long non-coding RNAs by k-mer content. Nat Genet. 2018; 50:1474–82. https://doi.org/10.1038/s41588-018-0207-8 [PubMed]
- 11. Song YX, Sun JX, Zhao JH, Yang YC, Shi JX, Wu ZH, Chen XW, Gao P, Miao ZF, Wang ZN. Non-coding RNAs participate in the regulatory network of CLDN4 via ceRNA mediated miRNA evasion. Nat Commun. 2017; 8:289. https://doi.org/10.1038/s41467-017-00304-1 [PubMed]
- 12. Sun TT, He J, Liang Q, Ren LL, Yan TT, Yu TC, Tang JY, Bao YJ, Hu Y, Lin Y, Sun D, Chen YX, Hong J, et al. LncRNA GClnc1 Promotes Gastric Carcinogenesis and May Act as a Modular Scaffold of WDR5 and KAT2A Complexes to Specify the Histone Modification Pattern. Cancer Discov. 2016; 6:784–801. https://doi.org/10.1158/2159-8290.CD-15-0921 [PubMed]
- 13. Zhang E, He X, Zhang C, Su J, Lu X, Si X, Chen J, Yin D, Han L, De W. A novel long noncoding RNA HOXC-AS3 mediates tumorigenesis of gastric cancer by binding to YBX1. Genome Biol. 2018; 19:154. https://doi.org/10.1186/s13059-018-1523-0 [PubMed]
- 14. Zhuo W, Liu Y, Li S, Guo D, Sun Q, Jin J, Rao X, Li M, Sun M, Jiang M, Xu Y, Teng L, Jin Y, et al. Long Noncoding RNA GMAN, Up-regulated in Gastric Cancer Tissues, Is Associated With Metastasis in Patients and Promotes Translation of Ephrin A1 by Competitively Binding GMAN-AS. Gastroenterology. 2019; 156:676–91.e11. https://doi.org/10.1053/j.gastro.2018.10.054 [PubMed]
- 15. Lagarde J, Uszczynska-Ratajczak B, Carbonell S, Pérez-Lluch S, Abad A, Davis C, Gingeras TR, Frankish A, Harrow J, Guigo R, Johnson R. High-throughput annotation of full-length long noncoding RNAs with capture long-read sequencing. Nat Genet. 2017; 49:1731–40. https://doi.org/10.1038/ng.3988 [PubMed]
- 16. Chu A, Liu J, Yuan Y, Gong Y. Comprehensive Analysis of Aberrantly Expressed ceRNA network in gastric cancer with and without H.pylori infection. J Cancer. 2019; 10:853–63. https://doi.org/10.7150/jca.27803 [PubMed]
- 17. Jing JJ, Wang ZY, Li H, Sun LP, Yuan Y. Key elements involved in Epstein-Barr virus-associated gastric cancer and their network regulation. Cancer Cell Int. 2018; 18:146. https://doi.org/10.1186/s12935-018-0637-5 [PubMed]
- 18. Liu Y, Zhu J, Ma X, Han S, Xiao D, Jia Y, Wang Y. ceRNA network construction and comparison of gastric cancer with or without Helicobacter pylori infection. J Cell Physiol. 2019; 234:7128–40. https://doi.org/10.1002/jcp.27467 [PubMed]
- 19. Luo Y, Coskun V, Liang A, Yu J, Cheng L, Ge W, Shi Z, Zhang K, Li C, Cui Y, Lin H, Luo D, Wang J, et al. Single-cell transcriptome analyses reveal signals to activate dormant neural stem cells. Cell. 2015; 161:1175–86. https://doi.org/10.1016/j.cell.2015.04.001 [PubMed]
- 20. Radulescu E, Jaffe AE, Straub RE, Chen Q, Shin JH, Hyde TM, Kleinman JE, Weinberger DR. Identification and prioritization of gene sets associated with schizophrenia risk by co-expression network analysis in human brain. Mol Psychiatry. 2018. [Epub ahead of print]. https://doi.org/10.1038/s41380-018-0304-1 [PubMed]
- 21. Abdeahad H, Avan A, Pashirzad M, Khazaei M, Soleimanpour S, Ferns GA, Fiuji H, Ryzhikov M, Bahrami A, Hassanian SM. The prognostic potential of long noncoding RNA HOTAIR expression in human digestive system carcinomas: A meta-analysis. J Cell Physiol. 2019; 234:10926–33. https://doi.org/10.1002/jcp.27918 [PubMed]
- 22. Song Y, Wang R, Li LW, Liu X, Wang YF, Wang QX, Zhang Q. Long non-coding RNA HOTAIR mediates the switching of histone H3 lysine 27 acetylation to methylation to promote epithelial-to-mesenchymal transition in gastric cancer. Int J Oncol. 2019; 54:77–86. https://doi.org/10.3892/ijo.2018.4625 [PubMed]
- 23. Gan L, Lv L, Liao S. Long non-coding RNA H19 regulates cell growth and metastasis via the miR-22-3p/Snail1 axis in gastric cancer. Int J Oncol. 2019; 54:2157–68. https://doi.org/10.3892/ijo.2019.4773 [PubMed]
- 24. Yörüker EE, Keskin M, Kulle CB, Holdenrieder S, Gezer U. Diagnostic and prognostic value of circulating lncRNA H19 in gastric cancer. Biomed Rep. 2018; 9:181–86. https://doi.org/10.3892/br.2018.1116 [PubMed]
- 25. Li Y, Wu Z, Yuan J, Sun L, Lin L, Huang N, Bin J, Liao Y, Liao W. Long non-coding RNA MALAT1 promotes gastric cancer tumorigenicity and metastasis by regulating vasculogenic mimicry and angiogenesis. Cancer Lett. 2017; 395:31–44. https://doi.org/10.1016/j.canlet.2017.02.035 [PubMed]
- 26. YiRen H, YingCong Y, Sunwu Y, Keqin L, Xiaochun T, Senrui C, Ende C, XiZhou L, Yanfan C. Long noncoding RNA MALAT1 regulates autophagy associated chemoresistance via miR-23b-3p sequestration in gastric cancer. Mol Cancer. 2017; 16:174. https://doi.org/10.1186/s12943-017-0743-3 [PubMed]
- 27. Gao S, Zhao ZY, Wu R, Zhang Y, Zhang ZY. Prognostic value of long noncoding RNAs in gastric cancer: a meta-analysis. Onco Targets Ther. 2018; 11:4877–91. https://doi.org/10.2147/OTT.S169823 [PubMed]
- 28. Kim T, Cui R, Jeon YJ, Lee JH, Lee JH, Sim H, Park JK, Fadda P, Tili E, Nakanishi H, Huh MI, Kim SH, Cho JH, et al. Long-range interaction and correlation between MYC enhancer and oncogenic long noncoding RNA CARLo-5. Proc Natl Acad Sci USA. 2014; 111:4173–78. https://doi.org/10.1073/pnas.1400350111 [PubMed]
- 29. Wasserman NF, Aneas I, Nobrega MA. An 8q24 gene desert variant associated with prostate cancer risk confers differential in vivo activity to a MYC enhancer. Genome Res. 2010; 20:1191–97. https://doi.org/10.1101/gr.105361.110 [PubMed]
- 30. Sotelo J, Esposito D, Duhagon MA, Banfield K, Mehalko J, Liao H, Stephens RM, Harris TJ, Munroe DJ, Wu X. Long-range enhancers on 8q24 regulate c-Myc. Proc Natl Acad Sci USA. 2010; 107:3001–05. https://doi.org/10.1073/pnas.0906067107 [PubMed]
- 31. Ozawa T, Matsuyama T, Toiyama Y, Takahashi N, Ishikawa T, Uetake H, Yamada Y, Kusunoki M, Calin G, Goel A. CCAT1 and CCAT2 long noncoding RNAs, located within the 8q.24.21 ‘gene desert’, serve as important prognostic biomarkers in colorectal cancer. Ann Oncol. 2017; 28:1882–88. https://doi.org/10.1093/annonc/mdx248 [PubMed]
- 32. Tuupanen S, Turunen M, Lehtonen R, Hallikas O, Vanharanta S, Kivioja T, Björklund M, Wei G, Yan J, Niittymäki I, Mecklin JP, Järvinen H, Ristimäki A, et al. The common colorectal cancer predisposition SNP rs6983267 at chromosome 8q24 confers potential to enhanced Wnt signaling. Nat Genet. 2009; 41:885–90. https://doi.org/10.1038/ng.406 [PubMed]
- 33. Ahmadiyeh N, Pomerantz MM, Grisanzio C, Herman P, Jia L, Almendro V, He HH, Brown M, Liu XS, Davis M, Caswell JL, Beckwith CA, Hills A, et al. 8q24 prostate, breast, and colon cancer risk loci show tissue-specific long-range interaction with MYC. Proc Natl Acad Sci USA. 2010; 107:9742–46. https://doi.org/10.1073/pnas.0910668107 [PubMed]
- 34. Wang XD, Lu J, Lin YS, Gao C, Qi F. Functional role of long non-coding RNA CASC19/miR-140-5p/CEMIP axis in colorectal cancer progression in vitro. World J Gastroenterol. 2019; 25:1697–714. https://doi.org/10.3748/wjg.v25.i14.1697 [PubMed]
- 35. Teerlink CC, Leongamornlert D, Dadaev T, Thomas A, Farnham J, Stephenson RA, Riska S, McDonnell SK, Schaid DJ, Catalona WJ, Zheng SL, Cooney KA, Ray AM, et al, and PRACTICAL consortium, and International Consortium for Prostate Cancer Genetics. Genome-wide association of familial prostate cancer cases identifies evidence for a rare segregating haplotype at 8q24.21. Hum Genet. 2016; 135:923–38. https://doi.org/10.1007/s00439-016-1690-6 [PubMed]
- 36. Gudmundsson J, Sulem P, Gudbjartsson DF, Masson G, Agnarsson BA, Benediktsdottir KR, Sigurdsson A, Magnusson OT, Gudjonsson SA, Magnusdottir DN, Johannsdottir H, Helgadottir HT, Stacey SN, et al. A study based on whole-genome sequencing yields a rare variant at 8q24 associated with prostate cancer. Nat Genet. 2012; 44:1326–29. https://doi.org/10.1038/ng.2437 [PubMed]
- 37. Al Olama AA, Kote-Jarai Z, Giles GG, Guy M, Morrison J, Severi G, Leongamornlert DA, Tymrakiewicz M, Jhavar S, Saunders E, Hopper JL, Southey MC, Muir KR, et al, and UK Genetic Prostate Cancer Study Collaborators/British Association of Urological Surgeons’ Section of Oncology, and UK Prostate testing for cancer and Treatment study (ProtecT Study) Collaborators. Multiple loci on 8q24 associated with prostate cancer susceptibility. Nat Genet. 2009; 41:1058–60. https://doi.org/10.1038/ng.452 [PubMed]
- 38. Burridge K. Focal adhesions: a personal perspective on a half century of progress. FEBS J. 2017; 284:3355–61. https://doi.org/10.1111/febs.14195 [PubMed]
- 39. Faure LM, Fiche JB, Espinosa L, Ducret A, Anantharaman V, Luciano J, Lhospice S, Islam ST, Tréguier J, Sotes M, Kuru E, Van Nieuwenhze MS, Brun YV, et al. The mechanism of force transmission at bacterial focal adhesion complexes. Nature. 2016; 539:530–35. https://doi.org/10.1038/nature20121 [PubMed]
- 40. Grashoff C, Hoffman BD, Brenner MD, Zhou R, Parsons M, Yang MT, McLean MA, Sligar SG, Chen CS, Ha T, Schwartz MA. Measuring mechanical tension across vinculin reveals regulation of focal adhesion dynamics. Nature. 2010; 466:263–66. https://doi.org/10.1038/nature09198 [PubMed]
- 41. Xu H, Sun Y, Ma Z, Xu X, Qin L, Luo B. LOC134466 methylation promotes oncogenesis of endometrial carcinoma through LOC134466/hsa-miR-196a-5p/TAC1 axis. Aging (Albany NY). 2018; 10:3353–70. https://doi.org/10.18632/aging.101644 [PubMed]
- 42. Hu BL, Xie MZ, Li KZ, Li JL, Gui YC, Xu JW. Genome-wide analysis to identify a novel distant metastasis-related gene signature predicting survival in patients with gastric cancer. Biomed Pharmacother. 2019; 117:109159. https://doi.org/10.1016/j.biopha.2019.109159 [PubMed]
- 43. Gong B, Li Y, Cheng Z, Wang P, Luo L, Huang H, Duan S, Liu F. GRIK3: A novel oncogenic protein related to tumor TNM stage, lymph node metastasis, and poor prognosis of GC. Tumour Biol. 2017; 39:1010428317704364. https://doi.org/10.1177/1010428317704364 [PubMed]
- 44. Li H, Liu JW, Liu S, Yuan Y, Sun LP. Bioinformatics-Based Identification of Methylated-Differentially Expressed Genes and Related Pathways in Gastric Cancer. Dig Dis Sci. 2017; 62:3029–39. https://doi.org/10.1007/s10620-017-4740-6 [PubMed]
- 45. Mouneimne G, Hansen SD, Selfors LM, Petrak L, Hickey MM, Gallegos LL, Simpson KJ, Lim J, Gertler FB, Hartwig JH, Mullins RD, Brugge JS. Differential remodeling of actin cytoskeleton architecture by profilin isoforms leads to distinct effects on cell migration and invasion. Cancer Cell. 2012; 22:615–30. https://doi.org/10.1016/j.ccr.2012.09.027 [PubMed]
- 46. Urra H, Henriquez DR, Cánovas J, Villarroel-Campos D, Carreras-Sureda A, Pulgar E, Molina E, Hazari YM, Limia CM, Alvarez-Rojas S, Figueroa R, Vidal RL, Rodriguez DA, et al. IRE1α governs cytoskeleton remodelling and cell migration through a direct interaction with filamin A. Nat Cell Biol. 2018; 20:942–53. https://doi.org/10.1038/s41556-018-0141-0 [PubMed]
- 47. Du Y, Jiang B, Song S, Pei G, Ni X, Wu J, Wang S, Wang Z, Yu J. Metadherin regulates actin cytoskeletal remodeling and enhances human gastric cancer metastasis via epithelial-mesenchymal transition. Int J Oncol. 2017; 51:63–74. https://doi.org/10.3892/ijo.2017.4002 [PubMed]
- 48. Chang HR, Nam S, Kook MC, Kim KT, Liu X, Yao H, Jung HR, Lemos R
Jr , Seo HH, Park HS, Gim Y, Hong D, Huh I, et al. HNF4α is a therapeutic target that links AMPK to WNT signalling in early-stage gastric cancer. Gut. 2016; 65:19–32. https://doi.org/10.1136/gutjnl-2014-307918 [PubMed] - 49. Flanagan DJ, Barker N, Costanzo NS, Mason EA, Gurney A, Meniel VS, Koushyar S, Austin CR, Ernst M, Pearson HB, Boussioutas A, Clevers H, Phesse TJ, Vincan E. Frizzled-7 Is Required for Wnt Signaling in Gastric Tumors with and Without Apc Mutations. Cancer Res. 2019; 79:970–81. https://doi.org/10.1158/0008-5472.CAN-18-2095 [PubMed]
- 50. Fu R, Wang X, Hu Y, Du H, Dong B, Ao S, Zhang L, Sun Z, Zhang L, Lv G, Ji J. Solamargine inhibits gastric cancer progression by regulating the expression of lncNEAT1_2 via the MAPK signaling pathway. Int J Oncol. 2019; 54:1545–54. https://doi.org/10.3892/ijo.2019.4744 [PubMed]
- 51. Wang H, Deng G, Ai M, Xu Z, Mou T, Yu J, Liu H, Wang S, Li G. Hsp90ab1 stabilizes LRP5 to promote epithelial-mesenchymal transition via activating of AKT and Wnt/β-catenin signaling pathways in gastric cancer progression. Oncogene. 2019; 38:1489–507. https://doi.org/10.1038/s41388-018-0532-5 [PubMed]
- 52. Huang Q, Cao H, Zhan L, Sun X, Wang G, Li J, Guo X, Ren T, Wang Z, Lyu Y, Liu B, An J, Xing J. Mitochondrial fission forms a positive feedback loop with cytosolic calcium signaling pathway to promote autophagy in hepatocellular carcinoma cells. Cancer Lett. 2017; 403:108–18. https://doi.org/10.1016/j.canlet.2017.05.034 [PubMed]
- 53. Yang SM, Xie R, Xu JY, Dong H. Su1946 Role of Calcium-Sensing Receptor in the Development and Progression of Human Gastric Cancer. Gastroenterology. 2014; 146:S-505 https://doi.org/10.1016/S0016-5085(14)61826-6
- 54. Xie R, Xu J, Xiao Y, Wu J, Wan H, Tang B, Liu J, Fan Y, Wang S, Wu Y, Dong TX, Zhu MX, Carethers JM, et al. Calcium Promotes Human Gastric Cancer via a Novel Coupling of Calcium-Sensing Receptor and TRPV4 Channel. Cancer Res. 2017; 77:6499–512. https://doi.org/10.1158/0008-5472.CAN-17-0360 [PubMed]
- 55. Tang B, Wu J, Zhu MX, Sun X, Liu J, Xie R, Dong TX, Xiao Y, Carethers JM, Yang S, Dong H. VPAC1 couples with TRPV4 channel to promote calcium-dependent gastric cancer progression via a novel autocrine mechanism. Oncogene. 2019; 38:3946–61. https://doi.org/10.1038/s41388-019-0709-6 [PubMed]
- 56. Kubota T, Kubota N, Kadowaki T. Imbalanced Insulin Actions in Obesity and Type 2 Diabetes: Key Mouse Models of Insulin Signaling Pathway. Cell Metab. 2017; 25:797–810. https://doi.org/10.1016/j.cmet.2017.03.004 [PubMed]
- 57. Ray A, Alalem M, Ray BK. Insulin signaling network in cancer. Indian J Biochem Biophys. 2014; 51:493–98. [PubMed]
- 58. Bertuzzi A, Conte F, Mingrone G, Papa F, Salinari S, Sinisgalli C. Insulin Signaling in Insulin Resistance States and Cancer: A Modeling Analysis. PLoS One. 2016; 11:e0154415. https://doi.org/10.1371/journal.pone.0154415 [PubMed]
- 59. Tseng CH, Tseng FH. Diabetes and gastric cancer: the potential links. World J Gastroenterol. 2014; 20:1701–11. https://doi.org/10.3748/wjg.v20.i7.1701 [PubMed]
- 60. Frankish A, Diekhans M, Ferreira AM, Johnson R, Jungreis I, Loveland J, Mudge JM, Sisu C, Wright J, Armstrong J, Barnes I, Berry A, Bignell A, et al. GENCODE reference annotation for the human and mouse genomes. Nucleic Acids Res. 2019; 47:D766–73. https://doi.org/10.1093/nar/gky955 [PubMed]
- 61. Lun AT, Chen Y, Smyth GK. It’s DE-licious: A Recipe for Differential Expression Analyses of RNA-seq Experiments Using Quasi-Likelihood Methods in edgeR. Methods Mol Biol. 2016; 1418:391–416. https://doi.org/10.1007/978-1-4939-3578-9_19 [PubMed]
- 62. Langfelder P, Cantle JP, Chatzopoulou D, Wang N, Gao F, Al-Ramahi I, Lu XH, Ramos EM, El-Zein K, Zhao Y, Deverasetty S, Tebbe A, Schaab C, et al. Integrated genomics and proteomics define huntingtin CAG length-dependent networks in mice. Nat Neurosci. 2016; 19:623–33. https://doi.org/10.1038/nn.4256 [PubMed]
- 63. Botía JA, Vandrovcova J, Forabosco P, Guelfi S, D’Sa K, Hardy J, Lewis CM, Ryten M, Weale ME, and United Kingdom Brain Expression Consortium. An additional k-means clustering step improves the biological features of WGCNA gene co-expression networks. BMC Syst Biol. 2017; 11:47. https://doi.org/10.1186/s12918-017-0420-6 [PubMed]
- 64. Zhang B, Horvath S. A general framework for weighted gene co-expression network analysis. Stat Appl Genet Mol Biol. 2005; 4:Article 17. https://doi.org/10.2202/1544-6115.1128 [PubMed]
- 65. Voigt A, Almaas E. Assessment of weighted topological overlap (wTO) to improve fidelity of gene co-expression networks. BMC Bioinformatics. 2019; 20:58. https://doi.org/10.1186/s12859-019-2596-9 [PubMed]
- 66. Langfelder P, Zhang B, Horvath S. Defining clusters from a hierarchical cluster tree: the Dynamic Tree Cut package for R. Bioinformatics. 2008; 24:719–20. https://doi.org/10.1093/bioinformatics/btm563 [PubMed]
- 67. Ravasz E, Somera AL, Mongru DA, Oltvai ZN, Barabási AL. Hierarchical organization of modularity in metabolic networks. Science. 2002; 297:1551–55. https://doi.org/10.1126/science.1073374 [PubMed]
- 68. Chen H, Boutros PC. VennDiagram: a package for the generation of highly-customizable Venn and Euler diagrams in R. BMC Bioinformatics. 2011; 12:35. https://doi.org/10.1186/1471-2105-12-35 [PubMed]
- 69. Camp RL, Dolled-Filhart M, Rimm DL. X-tile: a new bio-informatics tool for biomarker assessment and outcome-based cut-point optimization. Clin Cancer Res. 2004; 10:7252–59. https://doi.org/10.1158/1078-0432.CCR-04-0713 [PubMed]
- 70. Reimand J, Isserlin R, Voisin V, Kucera M, Tannus-Lopes C, Rostamianfar A, Wadi L, Meyer M, Wong J, Xu C, Merico D, Bader GD. Pathway enrichment analysis and visualization of omics data using g:Profiler, GSEA, Cytoscape and EnrichmentMap. Nat Protoc. 2019; 14:482–517. https://doi.org/10.1038/s41596-018-0103-9 [PubMed]
- 71. Subramanian A, Tamayo P, Mootha VK, Mukherjee S, Ebert BL, Gillette MA, Paulovich A, Pomeroy SL, Golub TR, Lander ES, Mesirov JP. Gene set enrichment analysis: a knowledge-based approach for interpreting genome-wide expression profiles. Proc Natl Acad Sci USA. 2005; 102:15545–50. https://doi.org/10.1073/pnas.0506580102 [PubMed]