


Introduction
The 20th century was characterized worldwide by important demographic changes [1] that contributed to the progressive ageing of the population, especially in industrialized countries [2].
Ageing, a physiological process that involves all organs and apparatuses of an organism, is accompanied by progressive functional alterations that cause a gradual reduction, and eventually loss of, the maintenance capacity of homeostasis, and is associated with the development of frailty [3,4]. Frailty is defined as a biological syndrome characterized by a reduction in the functional reserves of an organism and in its resistance to stressful events [5], derives from a progressive failure of different physiological systems and leads to an increase in vulnerability to stressful events [6] and a reduction in survival [7].
Frailty has been identified as a distinct biological syndrome [6] the development of which contribute to various conditions, such as chronic inflammation and changes in the immune and endocrine systems [5,8,9], and is associated with an increased risk of death [6,10].
To date, there is no universally accepted definition of frailty [11]. This accounts for the difficulties encountered by clinicians and researchers in identifying a reference tool that allows a simple, precise and easily reproducible evaluation of frailty. Among the different tools proposed over the years to identify frailty [12,13], the phenotypic model introduced by Fried et al. [6] is the most widely used [14], although various algorithms based on laboratory tests have also been proposed [15].
According to the phenotypic model of Fried et al., a subject is identified as frail when she/he has at least three of the following characteristics: 1) weight reduction greater than 4.5 kg or greater than 5% of body weight with respect to the usual weight of the subject in a year; 2) muscle weakness, characterized by a reduction in muscle strength of 20% or more compared to the baseline minimum reference value, standardized by sex and body mass index; 3) asthenia and easy fatigue, referred by the subject as a feeling of exhaustion; 4) motor sluggishness, defined by a reduction in walking speed, stratified by sex and height (the subject takes longer than the maximum time established to travel 4.572 m at the walking speed usually attributed to her/him or is unable to walk); 5) reduction in the level of physical activity and weekly energy expenditure, which is less than 383 Kcal / week for men and below 270 Kcal / week for women [6].
In our study, we chose to evaluate frailty using SHARE-FI [16], based on the criteria proposed by LP Fried [6]. This allowed us not only to identify the frailty phenotype but also to quantify the degree of frailty of an individual [16]. Studies seeking to identify biomarkers as possible indicators of frailty have shown that some of these are associated with an increased risk of mortality [17–19].
Osteoprotegerin (OPG) was originally identified as an inhibitor of the Receptor Activator of Nuclear factor Kappa B Ligand (RANKL) in bone tissue [20], but subsequent studies proved that OPG was also a marker of vascular damage, and its plasma concentrations have been correlated, in different populations, with an increased risk of both all-cause mortality and cardiovascular mortality [21–23]. Moreover, OPG is a protein involved in different physiopathologic conditions including bone, vascular, immune and tumor disease [24] and several studies found a positive linear correlation between OPG and age [25–27].
However, no study to date has investigated the relationship between OPG and frailty, a condition that, as already underscored, is able to significantly compromise the maintenance capacity of homeostasis of an organism, with a consequent increase in the risk of death [4,6].
The aim of this study was to evaluate osteoprotegerin as a possible biochemical marker associated with frailty in the elderly.
Results
The average age of the study population was 79.56 ± 7.20 years and was higher in frail subjects compared to pre-frail and non-frail subjects (ANOVA p<0.0001), as shown in Table 1. However, it did not differ between patients with fracture and patients without fracture. The evaluation of frailty through SHARE-FI required the assessment of muscle grip strength, measured using handgrip dynamometry. As this was not possible to obtain for 12 of the subjects, the data on frailty were only available for 160 subjects (Table 1).
Table 1. Characteristics of the study population and laboratory parameters.
| Frail | Pre-Frail | Non-Frail | p | ||||||||||||||||||||||||||||||||||||||||||||||||||||||||||||||||||||||||||||||||||||||||||||||||
| Age (years)* | 82.00±7.47 | 78.09±6.11 | 76.56±6.44 | - | |||||||||||||||||||||||||||||||||||||||||||||||||||||||||||||||||||||||||||||||||||||||||||||||
| Males | 11 | 9 | 27 | - | |||||||||||||||||||||||||||||||||||||||||||||||||||||||||||||||||||||||||||||||||||||||||||||||
| Females | 58 | 34 | 21 | - | |||||||||||||||||||||||||||||||||||||||||||||||||||||||||||||||||||||||||||||||||||||||||||||||
| Frailty Score | 3.95±0.90 | 1.38±0.59 | 0.038±0.62 | < 0.0001 | |||||||||||||||||||||||||||||||||||||||||||||||||||||||||||||||||||||||||||||||||||||||||||||||
| Frailty Score (Females) | 3.87±0.89 | 1.23±0.52 | -0.21±0.43 | < 0.0001 | |||||||||||||||||||||||||||||||||||||||||||||||||||||||||||||||||||||||||||||||||||||||||||||||
| Frailty Score (Males) | 4.39±0.87 | 1.98±0.43 | 0.23±0.68 | < 0.0001 | |||||||||||||||||||||||||||||||||||||||||||||||||||||||||||||||||||||||||||||||||||||||||||||||
| BMI (Kg/m2) | 26.40±5.58 | 27.30±5.60 | 25.53±4.18 | NS | |||||||||||||||||||||||||||||||||||||||||||||||||||||||||||||||||||||||||||||||||||||||||||||||
| WBC (103/μl) | 8.63±2.85 | 8.09±2.91 | 8.23±3.26 | NS | |||||||||||||||||||||||||||||||||||||||||||||||||||||||||||||||||||||||||||||||||||||||||||||||
| Hemoglobin (g/dl) | 11.64±1.77 | 12.71±1.65 | 13.22±1.58 | < 0.0001 | |||||||||||||||||||||||||||||||||||||||||||||||||||||||||||||||||||||||||||||||||||||||||||||||
| Creatinin (mg/dl) | 1.06±1.07 | 0.90±0.49 | 1.11±0.75 | NS | |||||||||||||||||||||||||||||||||||||||||||||||||||||||||||||||||||||||||||||||||||||||||||||||
| Albumin (g/dl) | 2.88±0.64 | 3.23±0.82 | 3.43±0.84 | < 0.0005 | |||||||||||||||||||||||||||||||||||||||||||||||||||||||||||||||||||||||||||||||||||||||||||||||
| TSH (μUI/ml) | 2.18±1.61 | 1.98±1.92 | 2.03±1.89 | NS | |||||||||||||||||||||||||||||||||||||||||||||||||||||||||||||||||||||||||||||||||||||||||||||||
| FT4 (ng/dl) | 1.18±0.20 | 1.21±0.24 | 1.22±0.18 | NS | |||||||||||||||||||||||||||||||||||||||||||||||||||||||||||||||||||||||||||||||||||||||||||||||
| FT3 (pg/ml) | 2.22±0.65 | 2.63±0.63 | 2.86±0.62 | < 0.0001 | |||||||||||||||||||||||||||||||||||||||||||||||||||||||||||||||||||||||||||||||||||||||||||||||
| OPG (pmol/l) | 9.31±4.00 | 7.65±3.23 | 7.09±3.01 | < 0.005 | |||||||||||||||||||||||||||||||||||||||||||||||||||||||||||||||||||||||||||||||||||||||||||||||
| IL-6 (pg/ml) | 102.23±76.67 | 80.70±95.51 | 58.43±88.07 | < 0.05 | |||||||||||||||||||||||||||||||||||||||||||||||||||||||||||||||||||||||||||||||||||||||||||||||
| TNF-α (pg/ml) | 12.26±10.53 | 10.02±6.13 | 8.48±3.78 | < 0.05 | |||||||||||||||||||||||||||||||||||||||||||||||||||||||||||||||||||||||||||||||||||||||||||||||
| hs-CRP (mg/dl) | 7.97±5.73 | 5.62±6.06 | 4.44±5.24 | < 0.01 | |||||||||||||||||||||||||||||||||||||||||||||||||||||||||||||||||||||||||||||||||||||||||||||||
| Cortisol (μg/dl) | 20.03±7.62 | 16.73±3.98 | 16.31±5.74 | < 0.01 | |||||||||||||||||||||||||||||||||||||||||||||||||||||||||||||||||||||||||||||||||||||||||||||||
| DHEAS (μg/dl) | 45.56±30.02 | 49.82±37.39 | 51.48±36.14 | NS | |||||||||||||||||||||||||||||||||||||||||||||||||||||||||||||||||||||||||||||||||||||||||||||||
| IGF-1 (ng/ml) | 71.00±40.34 | 79.27±34.48 | 95.55±49.63 | < 0.05 | |||||||||||||||||||||||||||||||||||||||||||||||||||||||||||||||||||||||||||||||||||||||||||||||
| IGFBP-3 (μg/ml) | 1.77±0.72 | 2.05±0.88 | 2.52±1.01 | < 0.005 | |||||||||||||||||||||||||||||||||||||||||||||||||||||||||||||||||||||||||||||||||||||||||||||||
| Data are presented as mean ± standard deviation | |||||||||||||||||||||||||||||||||||||||||||||||||||||||||||||||||||||||||||||||||||||||||||||||||||
As shown in Table 1, frail subjects had lower mean values of hemoglobin, albumin, FT3, IGF-1 and IGFBP-3 and higher mean values of IL-6, cortisol, hs-CRP, TNF-α and OPG, compared to pre-frail and non-frail subjects.
In a linear regression model (Figure 1) of the entire study population, OPG was directly and significantly correlated with the values of the Frailty Score (ANOVA r=0.208; p<0.01). OPG mean values were 9.59 ± 4.60 in subjects with hip fracture and 7.03 ± 2.58 in subjects without fractures (p<0.001).
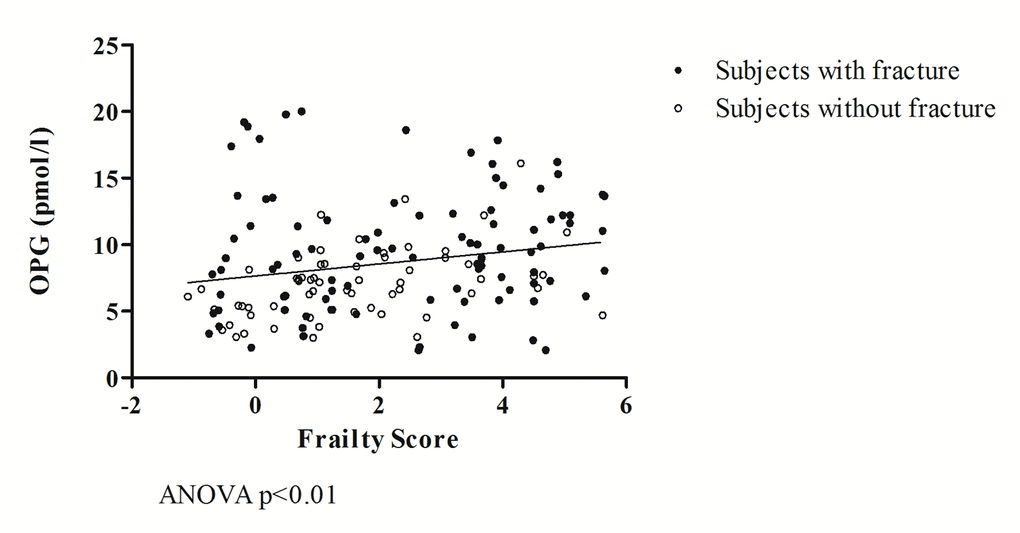
Figure 1. The relationship between OPG and frailty.
A linear correlation was also found between OPG and osteoporosis, evaluated by neck femoral T-score (p<0.001), but not with lumbar vertebral T-score or femoral and vertebral BMD. Furthermore, a correlation exists between OPG and renal function evaluated by means of estimated GFR (p<0.01), but not by plasma creatinine. OPG was also positively correlated with age (p<0.05).
A covariance analysis (ANCOVA) shows how a fracture event influences, in a statistically significant manner, the regression between OPG and Frailty Score (F=14.40; p<0.001), which are closely associated with one another (F =4.32; p<0.05).
As shown in Figure 2, when analyzing separately the data of subjects without fracture from those of patients with hip fracture, it is observed that in the former group (Figure 2 A), there is a statistically significant correlation between OPG and Frailty Score values (ANOVA r =0.420; p<0.001), while in the latter group (Figure 2 B) the two variables are not correlated with each other (r=0.092; p=NS).
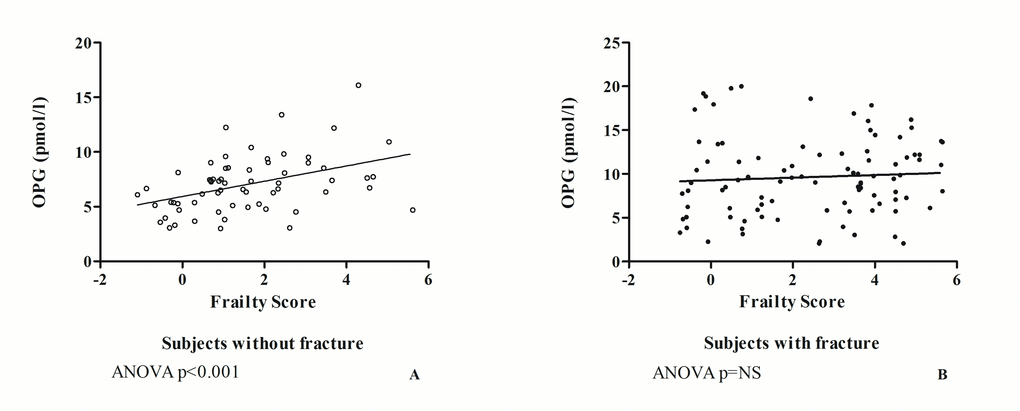
Figure 2. The relationship between OPG and frailty in subjects without fracture (A) and in patients with hip fracture (B).
A covariance analysis (ANCOVA) excluding non-frail subjects shows that the relationship between OPG and Frailty Score, regardless of fracture (F=3.12; p=0.0804), remains significant in both groups (F=6.97; p<0.01), with a parallel and higher regression line in patients with hip fracture (Figure 3).
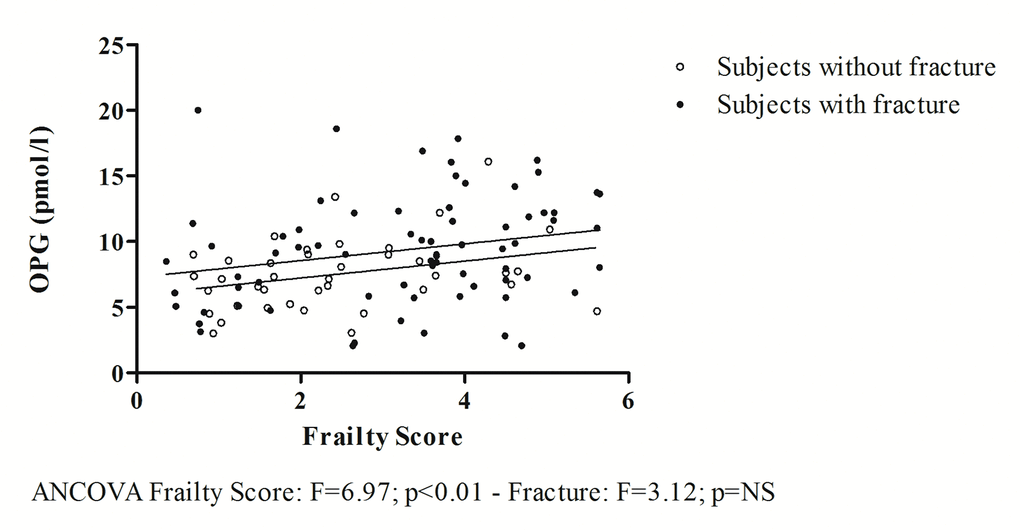
Figure 3. The relationship between OPG and frailty obtained excluding non-frail subjects.
In the study population, Frailty Score values are inversely associated with FT3 values (ANCOVA F=10.02; p<0.005) regardless of fracture event (ANCOVA F=0.12; p=NS). Furthermore, as shown in Figure 4, FT3 values are inversely and significantly correlated with OPG values (ANCOVA F=5.75, p<0.05), regardless of the presence of fracture (ANCOVA F=0.09; p=NS).
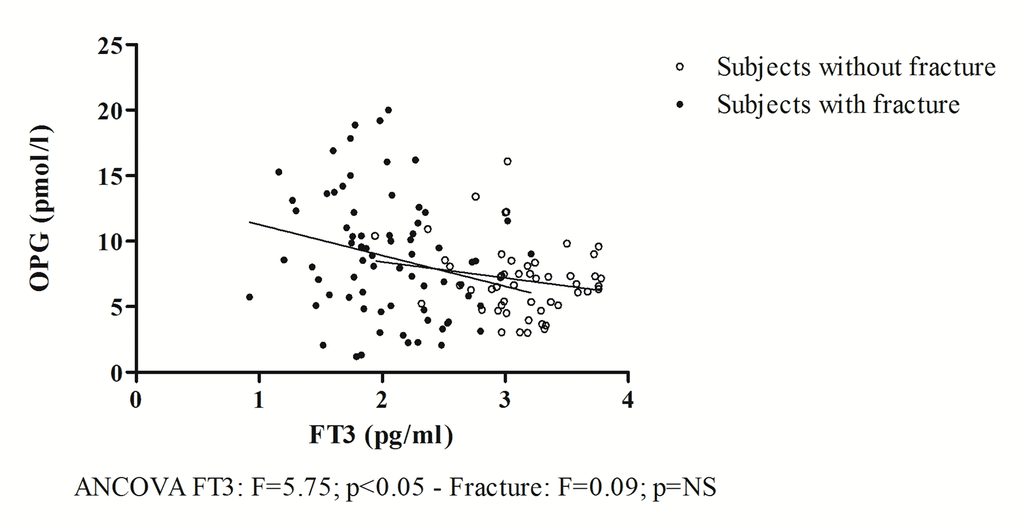
Figure 4. The relationship between OPG and FT3.
A multivariate linear regression model that includes common laboratory tests (Model 1) was developed, featuring as independent variables FT3, OPG, MCV, WBC, blood glucose, creatinine, albumin, total cholesterol and plasma concentrations of sodium, potassium, calcium and phosphorus. This model showed that, regardless of fracture event, inserted as a covariate, the Frailty Score, inserted as a dependent variable, was associated only with FT3 (p<0.05; CI (95%) -1.758 - -0.015) and with OPG (p<0.05; CI (95%) 0.002 - 0.208). Another multivariate linear regression model, mainly oriented towards endocrine evaluation, (Model 2), which included FT3, OPG, IGF-1, SHBG, cortisol and DHEAS as independent variables, showed that, regardless of fracture event, the Frailty Score was associated with FT3 (p<0.05; CI (95%) -1.820 - -0.191) and OPG (p<0.05; CI (95%) 0.009 - 0.191). Excluding patients with femur fractures, yet another linear multivariate regression model (Model 3) that considered the inflammatory proteins (hs-CRP, IL-6, TNF-α, cortisol) and OPG as independent variables showed that the Frailty Score was predicted by OPG alone (p<0.0001; CI (95%) 0.127 - 0.467).
Discussion
In the entire study population, the prevalence of frailty was equal to 43.13% and was greater, in both sexes, among patients admitted for fracture (53.61%), who exhibited a greater degree of frailty, compared to outpatients without fractures (26.98%).
Drawing on extant literature [6], we observed that in our study population, frail subjects were older than pre-frail and non-frail subjects and presented modifications of some laboratory parameters characteristic of frailty. In particular, as shown in Table 1, frail subjects had lower mean values of hemoglobin, albumin, FT3, IGF-1 and IGFBP-3 and higher mean values of IL-6, cortisol, hs-CRP, TNF-α and OPG, compared to pre-frail and non-frail subjects.
The modifications of laboratory parameters observed in our study population confirm some of the data in the literature which indicate that, compared to non-frail subjects, frail subjects generally have higher mean values of IL-6 [28–31] and of plasma cortisol and lower mean values of hemoglobin [29], albumin [32], DHEAS [17,33,34], IGF-1 [34] and FT3 [19]. However, fracture events and resulting hospitalizations in our study population played an important role in influencing the serum concentrations of these laboratory parameters. This was supported by an analysis of the covariance that demonstrated how fractures accentuate the differences between frail and non-frail subjects, with an additive, independent effect.
As shown in Table 1, among the study population, frail subjects had significantly higher values of OPG compared to pre-frail and non-frail subjects. Acute secondary events due to fracture had an additive, independent effect on accentuating the differences between groups, so that patients admitted for fracture had higher mean values of OPG than subjects without fracture.
In our population an increase in OPG circulating levels is associated with several conditions frequently observed in frail subjects. It is related to osteoporosis, as suggested by the correlation with neck femoral T-score, to reduced renal function, as suggested by the correlation with GFR and BUN, and to aging itself, and aging is the main cause of frailty (5, 6, 25, 26, 27).
The relationship between OPG and frailty is further highlighted in the regression in Figure 1, which shows how, in the entire study population, higher Frailty Score values correspond to higher OPG values. The analysis of covariance further underscores the close association between the two variables independently of the fracture event, which, in turn, has an additive effect on the relationship between OPG and frailty.
In fact, as per some authors [35], trauma due to a fracture event induces an increase in the expression of OPG. However, as shown in this article, it does not influence the relationship between OPG and frailty. This leads us to hypothesize that the role of OPG is to limit the damage induced by the inflammatory cytokines of the TNF family, as evidenced by the results obtained by analyzing separately the data of the group of patients hospitalized for fracture from those of patients without fracture (Figure 2 A and B). These results suggest that in the study population, the increase in plasma concentrations of OPG has a double origin. In subjects without fracture, OPG, which is well correlated with the Frailty Score, reflects the impairment of various organs and systems that contribute to determining frailty. By contrast, in subjects with hip fracture, OPG produced in response to frailty is supplemented by a share of OPG of bone origin. The production of the latter also depends on the reactive abilities of a subject, which can be greater in non-frail subjects than in pre-frail and frail subjects, as suggested by the loss of correlation between OPG and Frailty Score in subjects with fracture (Figure 2 B).
To further validate the above findings, Figure 3 shows how, by excluding non-frail subjects from the analysis, the correlation between OPG and Frailty Score is statistically significant both in patients with and without fracture. The two regression lines are parallel to each other, but the intercept is greater in patients with hip fracture. This indicates that the fracture event has an additive effect on the increase in plasma concentrations of OPG, which are higher in patients with fractures, but is independent of the relationship between OPG and Frailty Score. Moreover, in our study population, regardless of fracture event, OPG was inversely correlated with FT3 values (Figure 4), whose low concentrations were previously proposed as a possible indicator of frailty in the elderly [19] and of mortality [36].
The close relationship between OPG, FT3 and Frailty Score was confirmed in two multivariate linear regression models where the dependent variable and the covariate were represented by the Frailty Score and the fracture event, respectively; the independent variables were represented in Model 1 by FT3, OPG, MCV, WBC, blood glucose, creatinine, albumin, total cholesterol and plasma concentrations of sodium, potassium, calcium and phosphorus, while in Model 2 they were represented by FT3, OPG, IGF-1, SHBG, DHEAS and cortisol. Both models showed that, independently of fracture events, the Frailty Score was significantly associated only with OPG and FT3 values. This confirms the role of FT3 as a biological indicator of frailty and suggests an analogous role for OPG. In a third model of linear multivariate regression (Model 3), we inserted OPG and the biological indicators of inflammation as independent variables. As these are significantly modified by the acute event, we excluded from the analysis patients with hip fractures. OPG was observed to be the only predictive variable of frailty in this model.
These results led us to two hypotheses. Firstly, the relationship observed between OPG and Frailty Score could reflect the non-specific damaged condition of numerous organs and apparatuses. In non-frail individuals, this could reflect the physiological ageing process, whereas in pre-frail and frail subjects it could be the expression of the progressive accumulation of molecular lesions, cellular and, subsequently, tissutal and organic [37]. These lead to a progressively greater functional impairment manifested in the increase in vulnerability to acute events that characterizes frailty. Secondly, the relationship observed between FT3 and the Frailty Score could be the consequence of the non-specific damage of numerous organs and apparatuses that induces a deterioration of the overall condition of the body, requiring a reduction of energy metabolism [38], thereby configuring low T3 syndrome. Accordingly, the association of frailty and a reduction of FT3/FT4 ratio, a surrogate marker of peripheral thyroxin deiodination, has been recently reported by Pasqualetti G and co-workers [39].
Our data confirm the role of low FT3 values as a biological marker of frailty in the elderly and add new evidence on the role of OPG. Increased levels of OPG are a valid sign of the presence of damage to organs or systems that render elderly people frail. The significant correlation between OPG and Frailty Score found in our study points to its potential use as a biomarker for geriatric frailty syndrome.
Materials and Methods
Our data derive from the extension of an observational study [19] conducted at the "Tor Vergata" University Hospital in Rome on 172 subjects aged 65 or over, whose objective was to identify the main indicators of frailty and to evaluate their relationship with changes of the endocrine system observed with ageing, as described in Bertoli et al [19].
The study population included 107 elderly subjects, representative of a population with a greater prevalence of frailty, having been hospitalised at the Department of Orthopedics and Traumatology for hip fracture which resulted from low-energy trauma, and 65 older subjects with no history of low-energy trauma fracture, who had been referred to the Geriatric Outpatient and Day Hospital Medical Center of the Atherosclerosis Center, as previously described in Bertoli et al [19]. Patients with a history of current or previous malignancies were excluded [19].
The study was approved by the local Ethics Committee and all investigations were carried out in accordance with the principles of the Helsinki Declaration as amended in 2000.
Informed written consent was obtained from each subject who took part in the study and, in the case of patients with mild impairment of cognitive function, informed consent was obtained with the help of a caregiver. All subjects affected by severe impairment of cognitive status and thus not able to understand the objectives of the study and express their consent were automatically excluded.
Anamnestic data and anthropometric parameters (body weight and height) were recorded for each patient, a multidimensional geriatric evaluation including Activity of Daily Living (ADL) and Instrumental Activity of Daily Living (IADL), Mini Mental State Examination (MMSE), Geriatric Depression Scale (GDS), Mini Nutritional Assessment (MNA) and comorbidities assessed using the Cumulative Illness Rating Scale for Geriatrics (CIRS-G) were undertaken as described in previous work [8], and blood samples measured blood count, blood glucose, glycosylated hemoglobin (HbA1c), creatinine, Thyroid Stimulating Hormone (TSH), Free Triiodothyronine (FT3), Free Thyroxine (FT4), Parathyroid Hormone (PTH), 25-hydroxyvitamin D3 (25OHD), osteoprotegerin, cortisolemia, Dehydroepiandrosterone Sulfate (DHEAS), Sex Hormone Binding Globulin (SHBG), Growth Hormone (GH), Insulin-like Growth Factor-1 (IGF-1), Insulin-like Growth Factor Binding Protein-3 (IGFBP-3), Inteleuchin-6 (IL-6), Tumor Necrosis Factor-α (TNF-α), and high sensitivity-C Reactive Protein (hs-CRP).
The degree of frailty was calculated using the Survey of Health, Ageing and Retirement in Europe Frailty Instrument (SHARE-FI) [16].
The blood count was evaluated by routine laboratory tests (Sysmex XE 2100, Dasit). Blood glucose and creatinine levels were measured using homogeneous chemiluminescence assay (Dimension VISTA 1500, Siemens). HbA1c was assessed using capillary electrophoresis (Capillarys 2, Sebia), OPG was measured using an immunoenzymatic method (Biomedia), plasma concentrations of PTH, 25OHD, TSH, FT3, FT4 and cortisolemia were measured using chemiluminescence assay (ADVIA Centaur XP, Siemens). ACTH, DHEAS, SHBG, GH, IGF-1 and IGFBP-3 were measured with chemiluminescence assay (Immulite 2000, Siemens). hs-CRP was assessed with a nephelometric method (Dimension Vista 1500, Siemens), while IL-6 and TNF-α were measured using the immuno-reflex method (DRG). The degree of frailty of each patient was calculated using the Frailty Instrument for Primary Care of the Survey of Health, Ageing and Retirement in Europe (SHARE-FI) [16], based on the main identification criteria of frailty introduced by Fried LP et al [6]. Muscle strength was measured as muscle-holding force of the dominant hand using a Jamar-like digital hand-held dynamometer (Kern & Sohn, Balingen, Germany), according to which normal values for the elderly population are identified as greater than 30 Kg for male subjects and above 20 Kg for female subjects [40].
Statistical analysis
The Kolmogorov-Smirnov test was used to verify the normal distribution of parameters.
For comparison between the groups, the Student’s t-test and the analysis of variance (ANOVA) were used. Correlations were evaluated by simple linear regression. Multivariate linear regression was used to estimate the predictive variables of frailty. Statistical analysis was performed using Stat View 5 (SAS Institute, Cary North Carolina, USA) and SPSS 21 (IBM SPSS Statistics, Version 21.0. Armonk, NY: IBM Corp. IBM). The graphs were developed using GraphPad Prism 5 (GraphPad Software Inc., San Diego, California, USA).
Data are presented as mean ± standard deviation.
Values of p<0.05 were considered significant.
Acknowledgments
We acknowledge Dr. Massimo Federici, head of the Clinical Program on Atherosclerosis, for his advice on the study concept and design, and the identification of study subjects.
Conflicts of Interest
The authors have no conflicts of interest to disclose.
References
- 1. Sander M, Oxlund B, Jespersen A, Krasnik A, Mortensen EL, Westendorp RG, Rasmussen LJ. The challenges of human population ageing. Age Ageing. 2015; 44:185–87. https://doi.org/10.1093/ageing/afu189 [PubMed]
- 2. Christensen K, Doblhammer G, Rau R, Vaupel JW. Ageing populations: the challenges ahead. Lancet. 2009; 374:1196–208. https://doi.org/10.1016/S0140-6736(09)61460-4 [PubMed]
- 3. Fulop T, Larbi A, Witkowski JM, McElhaney J, Loeb M, Mitnitski A, Pawelec G. Aging, frailty and age-related diseases. Biogerontology. 2010; 11:547–63. https://doi.org/10.1007/s10522-010-9287-2 [PubMed]
- 4. Lang PO, Michel JP, Zekry D. Frailty syndrome: a transitional state in a dynamic process. Gerontology. 2009; 55:539–49. https://doi.org/10.1159/000211949 [PubMed]
- 5. Clegg A, Young J, Iliffe S, Rikkert MO, Rockwood K. Frailty in elderly people. Lancet. 2013; 381:752–62. https://doi.org/10.1016/S0140-6736(12)62167-9 [PubMed]
- 6. Fried LP, Tangen CM, Walston J, Newman AB, Hirsch C, Gottdiener J, Seeman T, Tracy R, Kop WJ, Burke G, McBurnie MA, and Cardiovascular Health Study Collaborative Research Group. Frailty in older adults: evidence for a phenotype. J Gerontol A Biol Sci Med Sci. 2001; 56:M146–56. https://doi.org/10.1093/gerona/56.3.M146 [PubMed]
- 7. Shamliyan T, Talley KM, Ramakrishnan R, Kane RL. Association of frailty with survival: a systematic literature review. Ageing Res Rev. 2013; 12:719–36. https://doi.org/10.1016/j.arr.2012.03.001 [PubMed]
- 8. Chen X, Mao G, Leng SX. Frailty syndrome: an overview. Clin Interv Aging. 2014; 9:433–41. https://doi.org/10.2147/CIA.S45300 [PubMed]
- 9. Walston J, Hadley EC, Ferrucci L, Guralnik JM, Newman AB, Studenski SA, Ershler WB, Harris T, Fried LP. Research agenda for frailty in older adults: toward a better understanding of physiology and etiology: summary from the American Geriatrics Society/National Institute on Aging Research Conference on Frailty in Older Adults. J Am Geriatr Soc. 2006; 54:991–1001. https://doi.org/10.1111/j.1532-5415.2006.00745.x [PubMed]
- 10. Kulmala J, Nykänen I, Hartikainen S. Frailty as a predictor of all-cause mortality in older men and women. Geriatr Gerontol Int. 2014; 14:899–905. https://doi.org/10.1111/ggi.12190 [PubMed]
- 11. Bergman H, Ferrucci L, Guralnik J, Hogan DB, Hummel S, Karunananthan S, Wolfson C. Frailty: an emerging research and clinical paradigm--issues and controversies. J Gerontol A Biol Sci Med Sci. 2007; 62:731–37. https://doi.org/10.1093/gerona/62.7.731 [PubMed]
- 12. Abellan van Kan G, Rolland Y, Houles M, Gillette-Guyonnet S, Soto M, Vellas B. The assessment of frailty in older adults. Clin Geriatr Med. 2010; 26:275–86. https://doi.org/10.1016/j.cger.2010.02.002 [PubMed]
- 13. Pialoux T, Goyard J, Lesourd B. Screening tools for frailty in primary health care: a systematic review. Geriatr Gerontol Int. 2012; 12:189–97. https://doi.org/10.1111/j.1447-0594.2011.00797.x [PubMed]
- 14. Dent E, Kowal P, Hoogendijk EO. Frailty measurement in research and clinical practice: A review. Eur J Intern Med. 2016; 31:3–10. https://doi.org/10.1016/j.ejim.2016.03.007 [PubMed]
- 15. Howlett SE, Rockwood MR, Mitnitski A, Rockwood K. Standard laboratory tests to identify older adults at increased risk of death. BMC Med. 2014; 12:171. https://doi.org/10.1186/s12916-014-0171-9 [PubMed]
- 16. Romero-Ortuno R, Walsh CD, Lawlor BA, Kenny RA. A frailty instrument for primary care: findings from the Survey of Health, Ageing and Retirement in Europe (SHARE). BMC Geriatr. 2010; 10:57. https://doi.org/10.1186/1471-2318-10-57 [PubMed]
- 17. Baylis D, Bartlett DB, Syddall HE, Ntani G, Gale CR, Cooper C, Lord JM, Sayer AA. Immune-endocrine biomarkers as predictors of frailty and mortality: a 10-year longitudinal study in community-dwelling older people. Age (Dordr). 2013; 35:963–71. https://doi.org/10.1007/s11357-012-9396-8 [PubMed]
- 18. Fontana L, Addante F, Copetti M, Paroni G, Fontana A, Sancarlo D, Pellegrini F, Ferrucci L, Pilotto A. Identification of a metabolic signature for multidimensional impairment and mortality risk in hospitalized older patients. Aging Cell. 2013; 12:459–66. https://doi.org/10.1111/acel.12068 [PubMed]
- 19. Bertoli A, Valentini A, Cianfarani MA, Gasbarra E, Tarantino U, Federici M. Low FT3: a possible marker of frailty in the elderly. Clin Interv Aging. 2017; 12:335–41. https://doi.org/10.2147/CIA.S125934 [PubMed]
- 20. Yasuda H, Shima N, Nakagawa N, Yamaguchi K, Kinosaki M, Goto M, Mochizuki SI, Tsuda E, Morinaga T, Udagawa N, Takahashi N, Suda T, Higashio K. A novel molecular mechanism modulating osteoclast differentiation and function. Bone. 1999; 25:109–13. https://doi.org/10.1016/S8756-3282(99)00121-0 [PubMed]
- 21. Vik A, Mathiesen EB, Brox J, Wilsgaard T, Njølstad I, Jørgensen L, Hansen JB. Serum osteoprotegerin is a predictor for incident cardiovascular disease and mortality in a general population: the Tromsø Study. J Thromb Haemost. 2011; 9:638–44. https://doi.org/10.1111/j.1538-7836.2011.04222.x [PubMed]
- 22. Omland T, Ueland T, Jansson AM, Persson A, Karlsson T, Smith C, Herlitz J, Aukrust P, Hartford M, Caidahl K. Circulating osteoprotegerin levels and long-term prognosis in patients with acute coronary syndromes. J Am Coll Cardiol. 2008; 51:627–33. https://doi.org/10.1016/j.jacc.2007.09.058 [PubMed]
- 23. Lewis JR, Lim WH, Ueland T, Wong G, Zhu K, Lim EM, Bollerslev J, Prince RL. Elevated circulating osteoprotegerin and renal dysfunction predict 15-year cardiovascular and all-cause mortality: a prospective study of elderly women. PLoS One. 2015; 10:e0134266. https://doi.org/10.1371/journal.pone.0134266 [PubMed]
- 24. Baud’huin M, Lamoureux F, Duplomb L, Rédini F, Heymann D. RANKL, RANK, osteoprotegerin: key partners of osteoimmunology and vascular diseases. Cell Mol Life Sci. 2007; 64:2334–50. https://doi.org/10.1007/s00018-007-7104-0 [PubMed]
- 25. Liu JM, Zhao HY, Ning G, Zhao YJ, Chen Y, Zhang Z, Sun LH, Xu MY, Chen JL. Relationships between the changes of serum levels of OPG and RANKL with age, menopause, bone biochemical markers and bone mineral density in Chinese women aged 20-75. Calcif Tissue Int. 2005; 76:1–6. https://doi.org/10.1007/s00223-004-0007-2 [PubMed]
- 26. Szulc P, Hofbauer LC, Heufelder AE, Roth S, Delmas PD. Osteoprotegerin serum levels in men: correlation with age, estrogen, and testosterone status. J Clin Endocrinol Metab. 2001; 86:3162–65. https://doi.org/10.1210/jcem.86.7.7657 [PubMed]
- 27. Khosla S, Arrighi HM, Melton LJ
3rd , Atkinson EJ, O’Fallon WM, Dunstan C, Riggs BL. Correlates of osteoprotegerin levels in women and men. Osteoporos Int. 2002; 13:394–99. https://doi.org/10.1007/s001980200045 [PubMed] - 28. Soysal P, Stubbs B, Lucato P, Luchini C, Solmi M, Peluso R, Sergi G, Isik AT, Manzato E, Maggi S, Maggio M, Prina AM, Cosco TD, et al. Inflammation and frailty in the elderly: A systematic review and meta-analysis. Ageing Res Rev. 2016; 31:1–8. https://doi.org/10.1016/j.arr.2016.08.006 [PubMed]
- 29. Leng S, Chaves P, Koenig K, Walston J. Serum interleukin-6 and hemoglobin as physiological correlates in the geriatric syndrome of frailty: a pilot study. J Am Geriatr Soc. 2002; 50:1268–71. https://doi.org/10.1046/j.1532-5415.2002.50315.x [PubMed]
- 30. Lai HY, Chang HT, Lee YL, Hwang SJ. Association between inflammatory markers and frailty in institutionalized older men. Maturitas. 2014; 79:329–33. https://doi.org/10.1016/j.maturitas.2014.07.014 [PubMed]
- 31. Leng SX, Xue QL, Tian J, Walston JD, Fried LP. Inflammation and frailty in older women. J Am Geriatr Soc. 2007; 55:864–71. https://doi.org/10.1111/j.1532-5415.2007.01186.x [PubMed]
- 32. Hubbard RE, O’Mahony MS, Savva GM, Calver BL, Woodhouse KW. Inflammation and frailty measures in older people. J Cell Mol Med. 2009; 13:3103–09. https://doi.org/10.1111/j.1582-4934.2009.00733.x [PubMed]
- 33. Voznesensky M, Walsh S, Dauser D, Brindisi J, Kenny AM. The association between dehydroepiandosterone and frailty in older men and women. Age Ageing. 2009; 38:401–06. https://doi.org/10.1093/ageing/afp015 [PubMed]
- 34. Leng SX, Cappola AR, Andersen RE, Blackman MR, Koenig K, Blair M, Walston JD. Serum levels of insulin-like growth factor-I (IGF-I) and dehydroepiandrosterone sulfate (DHEA-S), and their relationships with serum interleukin-6, in the geriatric syndrome of frailty. Aging Clin Exp Res. 2004; 16:153–57. https://doi.org/10.1007/BF03324545 [PubMed]
- 35. Wanby P, Nobin R, Von SP, Brudin L, Carlsson M. Serum levels of the bone turnover markers dickkopf-1, sclerostin, osteoprotegerin, osteopontin, osteocalcin and 25-hydroxyvitamin D in Swedish geriatric patients aged 75 years or older with a fresh hip fracture and in healthy controls. J Endocrinol Invest. 2016; 39:855–63. https://doi.org/10.1007/s40618-015-0421-5 [PubMed]
- 36. De Alfieri W, Nisticò F, Borgogni T, Riello F, Cellai F, Mori C, Nante N, Di Bari M. Thyroid hormones as predictors of short- and long-term mortality in very old hospitalized patients. J Gerontol A Biol Sci Med Sci. 2013; 68:1122–28. https://doi.org/10.1093/gerona/glt012 [PubMed]
- 37. Rockwood K, Mitnitski A. Frailty defined by deficit accumulation and geriatric medicine defined by frailty. Clin Geriatr Med. 2011; 27:17–26. https://doi.org/10.1016/j.cger.2010.08.008 [PubMed]
- 38. De Groot LJ. Dangerous dogmas in medicine: the nonthyroidal illness syndrome. J Clin Endocrinol Metab. 1999; 84:151–64. https://doi.org/10.1210/jcem.84.1.5364 [PubMed]
- 39. Pasqualetti G, Calsolaro V, Bernardini S, Linsalata G, Bigazzi R, Caraccio N, Monzani F. Degree of peripheral thyroxin deiodination, frailty, and long-term survival in hospitalized older patients. J Clin Endocrinol Metab. 2018; 103:1867–76. https://doi.org/10.1210/jc.2017-02149 [PubMed]
- 40. Valentini A, Federici M, Cianfarani MA, Tarantino U, Bertoli A. Frailty and nutritional status in older people: the Mini Nutritional Assessment as a screening tool for the identification of frail subjects. Clin Interv Aging. 2018; 13:1237–44. https://doi.org/10.2147/CIA.S164174 [PubMed]