


Introduction
Alternative splicing plays an important role in cellular senescence and aging [1–5]. Core splicing machinery and related splicing factors undergo dramatic changes during aging [6], accompanied with global splicing changes of downstream target genes [7–9]. Heterogeneous nuclear ribonucleoproteins (hnRNPs) and serine/arginine-rich (SR) splicing factors (SRSFs) are two groups of factors regulating alternative splicing and play important roles in numerous biological processes including aging [5,10–12]. Known examples include that the expression changes of multiple such factors (Hnrnpa1, Hnrnpa2b1, Sf3b1, Srsf3, etc.) are associated with mice lifespan and some (HNRNPA1 and HNRNPA2B1) are even related to parental longevity in humans [13]. Notably, decreased expression of splicing factor SRSF3 (also known as SRp20) is found in multiple cellular senescence models, and depletion of SRSF3 intriguingly induces cellular senescence via its influence on the choice of TP53 splicing isoforms in human fibroblast cells [5]. Reversely, elevated SRSF3 expression level is universal in many cancers, which can promote cell growth and maintain the transformation properties of cancer cells [14]. It has also been reported that higher expression of SRSF3 and the consequent splicing dysfunction is associated with neurodegenerative diseases and cancers [15–17]. These findings suggest that splicing-dependent function of SRSF3 plays an important role in senescence and related biological processes.
However, increasing evidence has come to highlight the biomedical importance of revealing splicing-independent function of splicing factors in fully understanding their regulation mechanism [18,19]. As an example, splicing factor RBFox2 directly interacts with Polycomb complex 2 (PRC2) to regulate genome-wide transcription in mammals [19]. In addition, RBFox2 binding to 3′ UTR of Jph2 gene can antagonise miR34a-mediated gene suppression and plays a role in heart failure [20]. Splicing factor SRSF3 can directly bind to transcripts of histone H2a gene to facilitate their nucleus-to-cytoplasm transport [21]. Interestingly, SRSF3 can modulate the translation efficiency of a viral RNA through interacting with an RNA-binding protein PCBP2 [22]. Noteworthy, SRSF3 can also regulate the alternative poly(A) (pA) site recognition in calcitonin coding gene CALCA by affecting CSTF2 binding [23]. These above findings on splicing-independent function of SRSF3 inspire us to hypothesize that alternative polyadenylation (APA) dependent function of SRSF3 could also play a role in regulating cellular senescence.
APA is a phenomenon that one gene contains multiple polyadenylation (pA) sites to produce transcript isoforms differ either at the lengths of 3′ untranslated regions (UTR-APA) or C-terminal domains (CR-APA) [24,25]. UTR-APA is more prevalent than CR-APA at genome-wide level [25], which could lead to distinct difference in RNA stability, translation efficiency, localization of RNA and protein among isoforms with different lengths of 3′ UTR [26,27]. The dynamic APA changes have been reported to occur in multiple physiological or pathological processes [28–32]. Global 3′ UTR shortening due to the favorite usage of the proximal pA site took place in cell proliferation and tumorigenesis, and genome-wide lengthening of 3′ UTRs occurs during development and differentiation [33]. It has been discovered that APA regulation is widespread in eukaryotes, and there are more than 70% genes in human genome undergoing APA [25,34], further supporting the prevalence and importance of APA. As for the regulation mechanisms, the cis-acting elements and 3′ end processing factors can both affect pA site selection [24,33,35–37]. For example, CSTF2 is a well-known factor that participates in mRNA 3′ end processing, and its cellular concentration can affect pA site usage [38,39]. Knockdown of CSTF2 plus its paralog CSTF2t can promote genes to preferentially use the distal pA site [40,41]. Besides, CFIm25 and CFIm68 were another two 3′ end processing factors that have been reported to be involved in pA site selection. Favorite usage of the proximal pA site was observed when CFIm25 or CFIm68 was down-regulated [42–45]. Polyadenylation can also be coupled with splicing [46], recent studies demonstrated that multiple splicing factors (such as U1 snRNP [47,48], HnRNP H/H’ [49] and NOVA2 [50]) could regulate APA. Additionally, factors of other aspects, such as transcription [51], chromatin state [52] and other RNA binding proteins [53–55], can also be involved in the modulation of APA.
To examine whether down-regulation of splicing factor SRSF3 promotes cellular senescence via its APA-dependent mechanism, we performed transcriptome-wide APA profiling on SRSF3-knockdown (SRSF3-KD) and control cells by PA-seq [56] (a 3′ end specific enrichment RNA-seq method) and strand-specific RNA-seq methods [57]. Interestingly, we observed SRSF3-KD induced global shortening of 3′ UTRs in both human and mouse cells. SRSF3 has higher binding density near proximal pA sites than distal ones in 3′ UTR shortened genes. These 3′ UTR-shortened genes were enriched in senescence-associated pathways, and shortened 3′ UTRs tended to produce more corresponding proteins. We further found that mimicking the effect of 3′ UTR shortening by overexpression of three candidate genes promoted senescence-associated phenotypes. These results combined to support the model that APA-dependent function of SRSF3 depletion can lead cellular senescence.
Results
Down-regulation of SRSF3 leads to global shortening of 3′ UTR in human and mouse cells
To examine whether SRSF3-KD induces downstream changes other than alternative splicing, we firstly applied our published PA-seq protocol, which specifically enriched 3′ ends of mRNA by reverse transcription with modified oligo(dT) primer to capture the polyA tail and precisely identify polyadenylation site at the genome scale [56], to detect global APA changes in human 293T cells. Two biological replicates of lentivirus-mediated short hairpin RNA (shRNA) interference were performed and down-regulation of SRSF3 protein was confirmed by western blot (Fig. 1A, Fig. S1). The reliability of the identified pA sites was analyzed before comparing the dynamic changes of APA between SRSF3-KD and control cells. Known pA sites and those located at 3′ UTR regions were the top two categories of the identified pA sites (Fig. 1B), consistent with previous reports [32,56]. Besides, 85.5% of the identified pA sites were covered by PolyA_DB3 [58] and nucleotides composition near pA sites were in line with previous reports (Fig. S2). Moreover, canonical polyA signals (AAUAAA and AUUAAA) occupy ~75% of identified pA sites (Fig. S2C). These quality control results demonstrated the satisfied quality of the identified pA sites and their reliability for further analyses. The changes of pA site usage upon SRSF3 knockdown were next analyzed. Effective 3′ UTR (eUTR), which considering both location and abundance of pA sites for genes with APA, was used to reflect the weighted length of 3′ UTR for each gene [32,56]. Interestingly, an overall 3′ UTR shortening pattern evaluated by eUTR was observed in SRSF3-KD human 293T cells with two biological replicates (Fig. 1C), suggesting that SRSF3 downregulation favored the usage of proximal pA sites. We further examined the eUTR changes at individual gene level and found that SRSF3-KD induced more genes to use proximal pA sites in both replicates (Fig. 1D). Notably, a considerable proportion of overlapped genes between two biological replicates using PA-seq method and eUTR calculation further supported the reproducibility of such global trend (Fig. 1D).
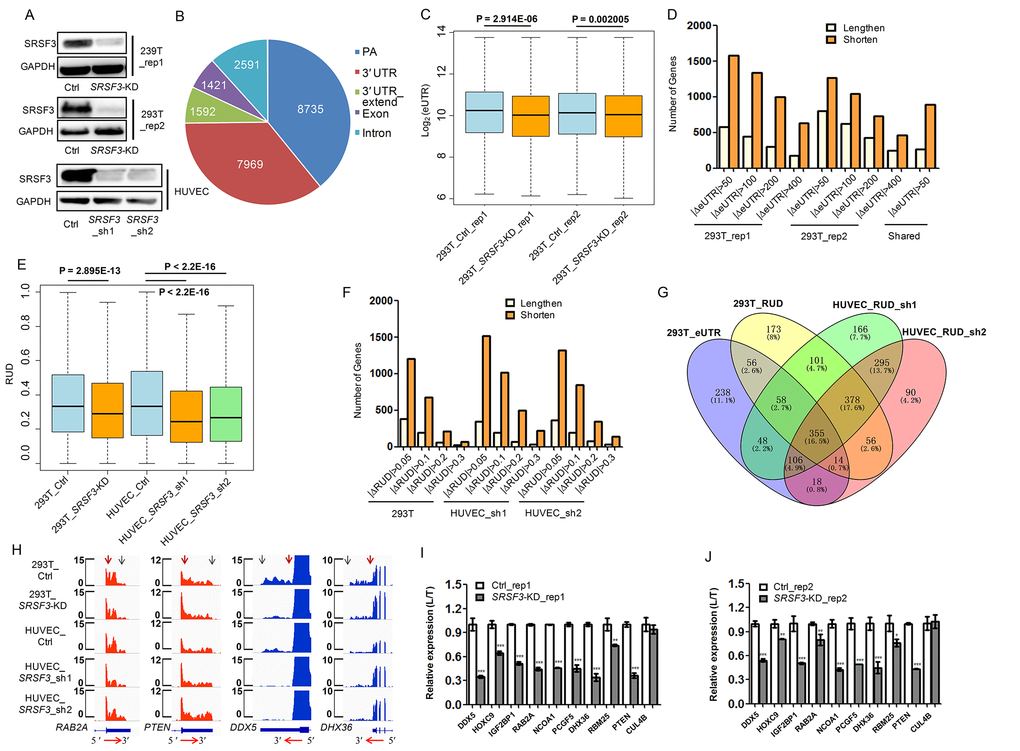
As an independent validation, we next adopted the method of RUD index [59], which reflected the relative usage of distal pA sites compared to total pA sites, to confirm the APA changes based on a separate RNA-seq data. Consistent with the results based on eUTR method, we detected a global reduction of RUD index upon SRSF3 KD in 293T cells (Fig. 1E), suggesting the favoring of proximal pA sites and shortening of 3′ UTRs. At individual gene level, we also detected more genes using shortened 3′ UTRs than lengthened ones in SRSF3-KD 293T cells (Fig. 1F). To expand this conclusion in more human cells, we applied the same RNA-seq and RUD analysis in Human Umbilical Vein Endothelial Cells (HUVECs), which is widely used as a vascular senescence model [32,60–62]. In line with the results in human 293T cells, knockdown SRSF3 with two replicates in HUVECs both displayed a similar 3′ UTR shortening trend at both genome-wide (Fig. 1E) and individual gene level (Fig. 1F).
To gain a comprehensive comparison of genes tending to use shorter 3′ UTRs upon SRSF3-KD based on different methods, biological replicates and types of cells, the interrelation of these gene sets was shown in a venn diagram (Fig. 1G). The majority (1134 genes) of SRSF3-KD induced 3′ UTR shortened genes were shared between two biological replicates of HUVECs (Fig. 1G). A considerable overlap (483 genes) between two different bioinformatical methods (eUTR and RUD) was also detected in 293T cells (Fig. 1G). Importantly, there were 355 genes showed 3′ UTR shortening in both 293T and HUVECs based on different methods and biological replicates (Fig. 1G), which were probably the common targets of SRSF3 in different cell types. SRSF3-KD induced 3′ UTR shortening in four representative genes was visualized in tracks of RNA-seq (Fig. 1H) and PA-seq (Fig. S3). Ten candidate genes were further selected for validation by reverse transcription coupled with quantitative real-time polymerase chain reaction (qRT-PCR), nine of which were confirmed to have reduced usage of distal pA sites (i.e., favor the proximal pA sites) in SRSF3-KD human cells (Fig. 1I-J). These above results indicated that downregulation of SRSF3 caused global 3′ UTR shortening in human cells.
To examine whether Srsf3 could play a similar APA regulatory role in mouse cells, we knocked down Srsf3 in mouse embryonic fibroblasts (MEFs) (Fig. S4A) and constructed RNA-seq libraries followed by RUD analysis. Consistent with the trend in human cells, knockdown of Srsf3 in MEFs also led to global shortening of 3′ UTRs (Fig. S4B) and the majority of genes with APA changes favored proximal pA sites (Fig. S4C). Both visualization of RNA-seq results and qRT-PCR validation of selected genes supported the shortening of 3′ UTR in Srsf3-KD mouse cells (Fig. S4D-F). Altogether, our results proved that downregulation of splicing factor SRSF3 resulted in global shortening of 3′ UTR in both human and mouse cells.
SRSF3 favors proximal pA sites binding and transcriptionally modulates APA
We next examined whether SRSF3 directly regulated alternative polyadenylation by integrative analysis of public SRSF3 CLIP-seq (crosslinking-immunoprecipitation and high-throughput sequencing) data [63,64] and our PA-seq and RNA-seq data before and after SRSF3 knockdown. As we focused on UTR-APA, CLIP signal located at 3′ UTRs was analyzed. Interestingly, the binding intensity of SRSF3 was significantly higher near proximal pA sites than distal ones for 3′ UTR shortened genes in both human and mouse cells (Fig. 2A). Since about 90% of genes had ≥ 100 nucleotides (nt) distance between proximal pA site and stop codon (Fig. S5), we analyzed CLIP signal within 100 nt around proximal or distal pA sites and observed same results (Fig. 2B). These results suggested that SRSF3 globally favors the proximal pA site binding. To confirm such result at individual gene level, three candidate genes (PTEN, a well-known tumor suppressor and related to longevity; DNMT3A, a known methyltransferase associated with aging and cancer; PIAS1, a repressor of transcription factor STAT1 that related to breast tumorigenesis), which were validated undergoing 3′ UTR shortening in SRSF3-KD cells (Fig. 1I-J, Fig. S4E-F), were visualized with their CLIP-seq and RNA-seq signal in UCSC genome browser. Noteworthy, SRSF3 had higher binding signal around the proximal pA site than the distal one for PTEN in all three biological replicates in mouse cells (see iCLIP of SRSF3 track in Fig. 2C, Fig. S6). SRSF3 iCLIP tracks of PIAS1 and DNMT3A showed similar proximal pA site preference (SFig. S7, S8). Consistent with the shortening of 3′ UTR, RNA-seq tracks of these three candidate genes showed considerable ratio change between alternative 3′ UTR (aUTR) and constitutive 3′ UTR (cUTR) in SRSF3-KD samples (Fig. 2C, Fig. S7, S8). Importantly, the 3′ UTRs of PTEN, PIAS1 and DNMT3A are all evolutionarily conserved and ranked at top 14%, 13.6% and 10.6% in all human coding genes, respectively (Fig. S9), implying the importance of such regulatory role of SRSF3 in an evolutionary view.
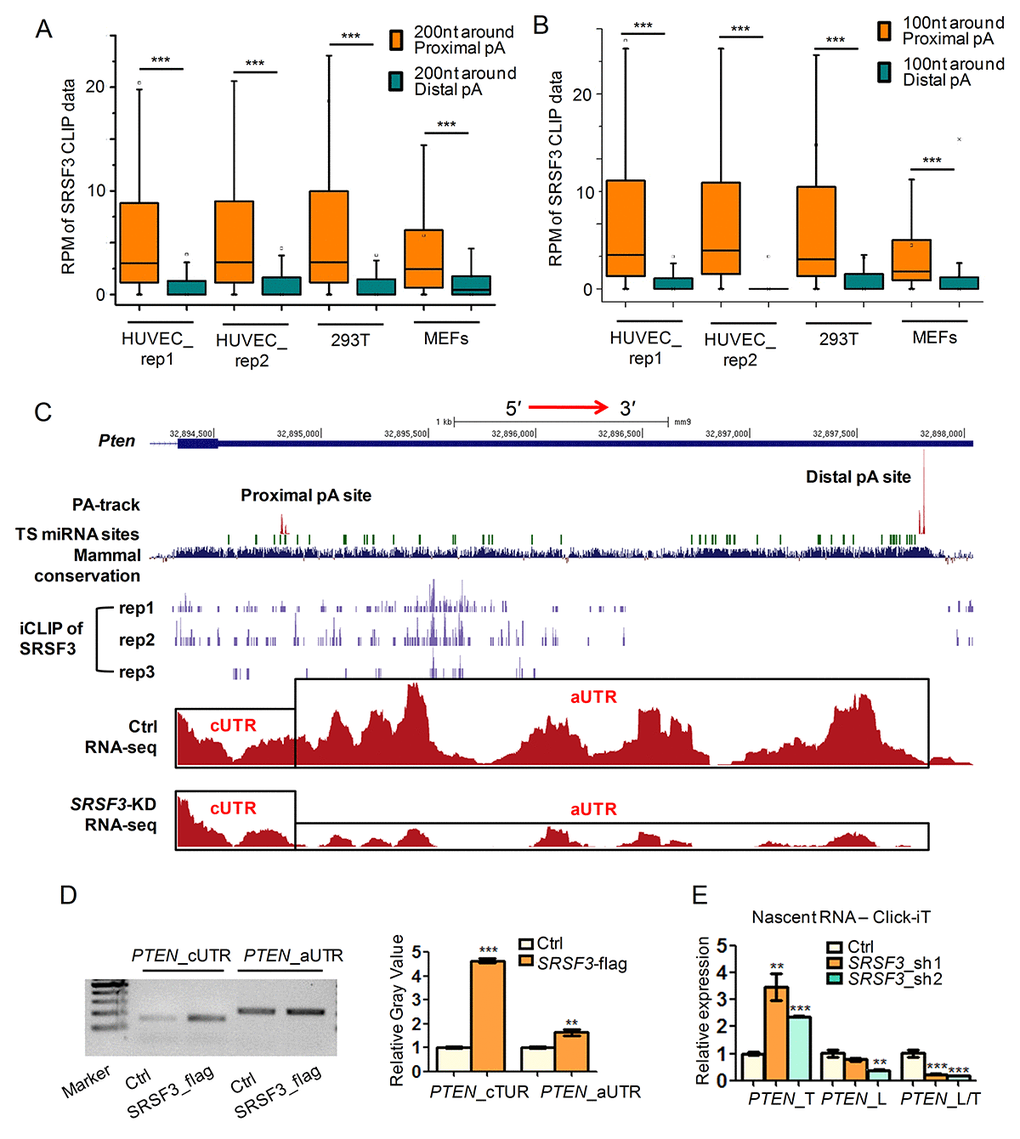
Alternative polyadenylation contributing to different isoforms of PTEN has been reported by other research [65–67], however, SRSF3 directly binding to its 3′ UTR and regulating its APA is novel, we performed further experimental validations in human cell. RNA immunoprecipitation coupled with semi-quantitative PCR (RIP-PCR) showed higher binding signal of SRSF3 near the proximal pA site than the distal one of PTEN (Fig. 2D). These results indicated that SRSF3 regulated APA of PTEN by its binding preference to the proximal pA site. To further explore whether SRSF3 regulated PTEN’s APA at the transcriptional level, we applied analysis on nascent RNA. qRT-PCR showed that SRSF3-KD increased the usage of proximal pA site in nascent poly(A)+ RNA, indicating SRSF3 regulated APA of PTEN at transcriptional level (Fig. 2E). Together, SRSF3 favored proximal pA site binding of PTEN and regulated its APA at transcriptional level.
SRSF3-KD induced 3′ UTR-shortened genes enrich in senescence-associated pathways
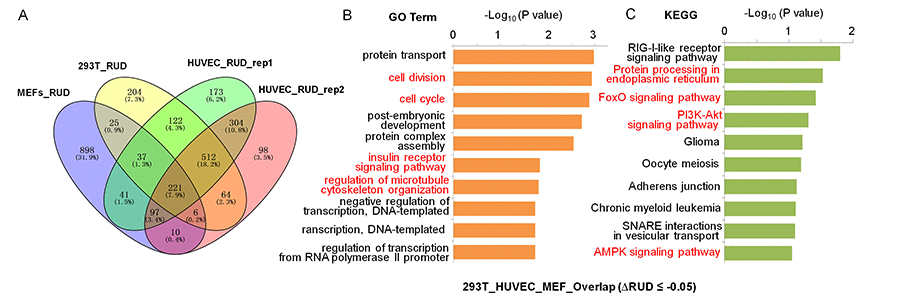
To understand the functional consequence of SRSF3-KD induced 3′ UTR shortening, functional enrichment analyses were performed on those 3′ UTR shortened genes using gene ontology (GO) and KEGG pathway (Fig. 3A). We first analyzed 3′ UTR-shortened genes shared by two biological replicates of HUVEC, and discovered that four (cell division, protein ubiquitination, cell cycle and Wnt signaling pathway) out of the top ten enriched GO terms were associated with senescence (Fig. S10A) [68,69]. And seven out of the top ten enriched KEGG pathways (Endocytosis, Protein processing in endoplasmic reticulum, Ubiquitin mediated proteolysis, Insulin signaling pathway, mTOR signaling pathway, AMPK singling pathway and FoxO signaling pathway) were associated with senescence or aging (Fig. S10B) [70–73]. Next, we analyzed SRSF3-KD induced 3′ UTR shortening genes shared by 293T and HUVEC cells, and found that they were enriched in senescence-associated GO terms (cell division, cellular response to DNA damage stimulus, cell cycle and protein ubiquitination) and senescence/aging related pathways (Protein processing in endoplasmic reticulum, Ubiquitin mediated proteolysis, Endocytosis, FoxO signaling pathway and mTOR signaling pathway) (Fig. S11) [68,70,71,74]. 3′ UTR-shortened genes in MEFs were also enriched in senescence/aging related pathways (cell division, Ras signaling pathway, Wnt signaling pathway, Ubiquitin mediated proteolysis, PI3K-Akt signaling pathway and Endocytosis) (Fig. S12). Finally, we analyzed SRSF3-KD induced 3′ UTR shortening genes shared by 293T, HUVEC and MEF cells (221 genes showed in Fig. 3A), and the result showed that they were enriched in senescence-associated GO terms (cell division, cell cycle, insulin receptor signaling pathway and regulation of microtubule cytoskeleton organization) and senescence/aging related pathways (Protein processing in endoplasmic reticulum, FoxO signaling pathway, PI3K-Akt signaling pathway and AMPK signaling pathway) (Fig. 3B,C) [75–77]. These results above indicated that SRSF3-KD induced 3′ UTR-shortened genes possibly had the potential to function in senescence and aging in both human and mouse cells.
Decreased SRSF3 causes senescence-related phenotypes in human and mouse cells
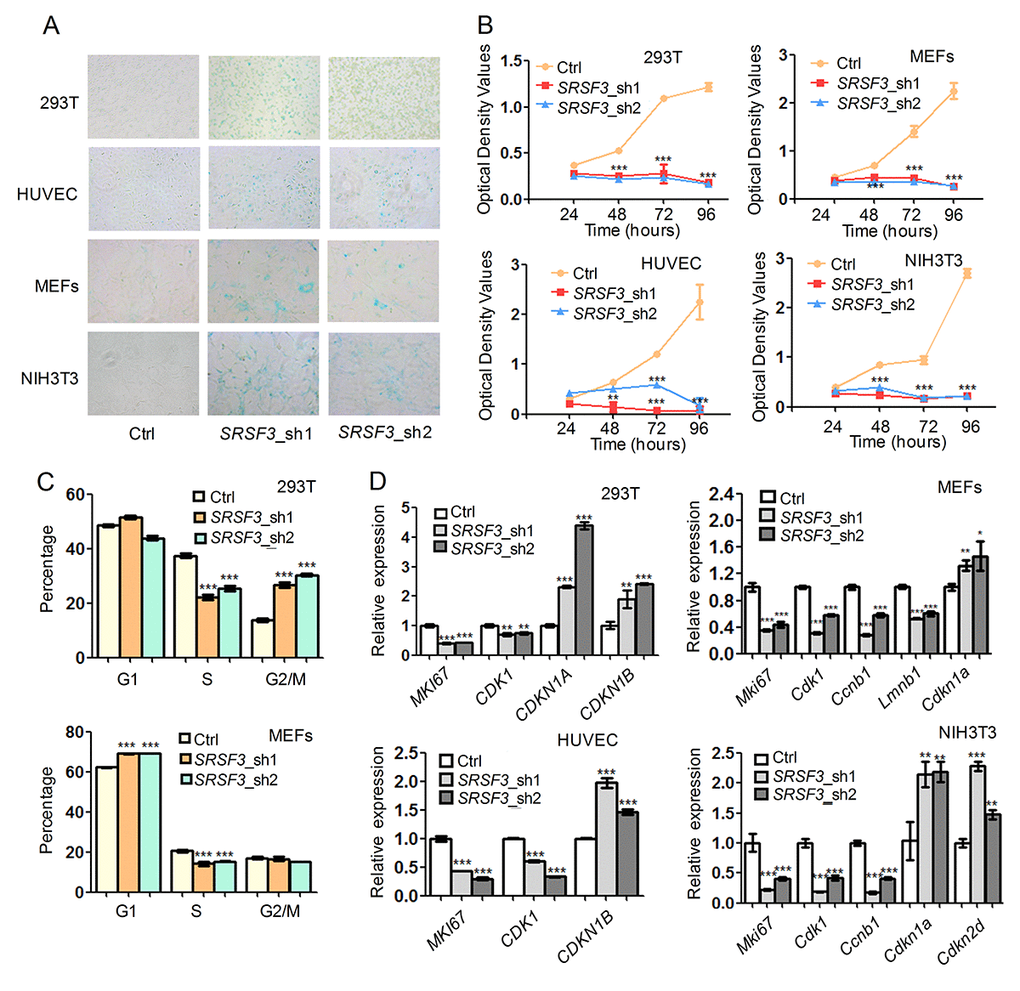
We next examined whether knockdown of SRSF3 could lead to senescence-associated phenotypes in human and mouse cells. RNA interferences using two shRNAs targeting SRSF3 caused increased senescence-associated β-galactosidase (SA-β-gal) staining [78] in both human (293T and HUVEC) and mouse (MEF and NIH3T3) cells (Fig. 4A). In addition, SRSF3-KD reduced cell growth rate in tested cell lines (Fig. 4B). Further investigation showed that SRSF3-KD resulted in cell cycle arrest in G2/M phase in 293T cells while arrest in G1 phase in MEFs (Fig. 4C). Notably, SRSF3-KD caused a common decrease of S phase percentage in both 293T and MEF cells (Fig. 4C). What’s more, knockdown of SRSF3 in human and mouse cells also led to the decreased expression of MKI67, a molecular marker for cell proliferation (Fig. 4D) [79]. In addition, SRSF3-KD resulted in upregulation of senescence-related marker CDKN1A (encodes p21) and/or CDKN1B (encodes p27) in human and mouse cells (Fig. 4D). These results demonstrated that knockdown of SRSF3 could induce senescence-related phenotypes in both human and mouse cells.
SRSF3-KD induced 3′ UTR shortening genes promote senescence-related phenotypes via their increased protein levels
As knockdown of SRSF3 led to global shorting of 3′ UTRs and senescence-associated phenotypes, we hypothesized that 3′ UTR shortening mediated expression change of target genes can be an alternative mechanism in explaining SRSF3-KD induced senescence. Our results already showed that SRSF3 directly regulated APA of candidate genes including PTEN, PIAS1 and DNMT3A (Fig. 2, Fig. S7, S8). These three genes belong to enriched pathways associated with senescence/aging (PTEN belongs to pathways in cancer, PI3K-Akt signaling pathway; PIAS1 and DNMAT3A belong to transcription, DNA-templated, regulation of transcription). We thus chose these genes to test the hypothesis. To examine whether SRSF3-KD induced 3′ UTR shortening affects gene expression, we carried out dual luciferase assay with different lengths of 3′ UTRs. It has been reported that protein abundance of the variable PTEN isoforms resulting from alternative polyadenylation are distinct because of miRNA effects or difference in protein translation efficiency [65,66,80,81]. Our result showed that transcripts with the shorter 3′ UTR of PTEN can markedly produce more protein than those with the longer one in two different human cell types (Fig. 5A, Fig. S13). The result remained true in mouse cells (Fig. S14). In addition, shorter 3′ UTR of PIAS1 also generated more protein than the longer one (Fig. S15). Interestingly, multiple TargetScan (TS) predicted microRNA (miRNA) binding sites existed in the regions between proximal and distal pA sites for both PTEN and PIAS1 (see TS miRNA sites in Fig. 2C, Fig. S7). This result suggested that shortened 3′ UTR could enhance the protein expression through escaping from targeting by miRNAs. Further, there were more predicted miRNA binding sites within the alternative 3′ UTR of DNMT3A (see TS miRNA sites in Fig. S8), however, the dual luciferase assay cannot be performed due to the technical failure of cloning the longer 3′ UTR of DNMT3A. Next, RNA turnover rate analysis showed that transcripts with shorter 3′ UTR of PTEN was more stable than those with the longer one in HUVEC cells, though a less difference of such stability in 293T cells (Fig. 5B). These results suggested that SRSF3-KD induced shortening was likely to increase the protein production of affected genes, possibly contributed by miRNA-mediated stability control, translation efficiency or other mechanisms.
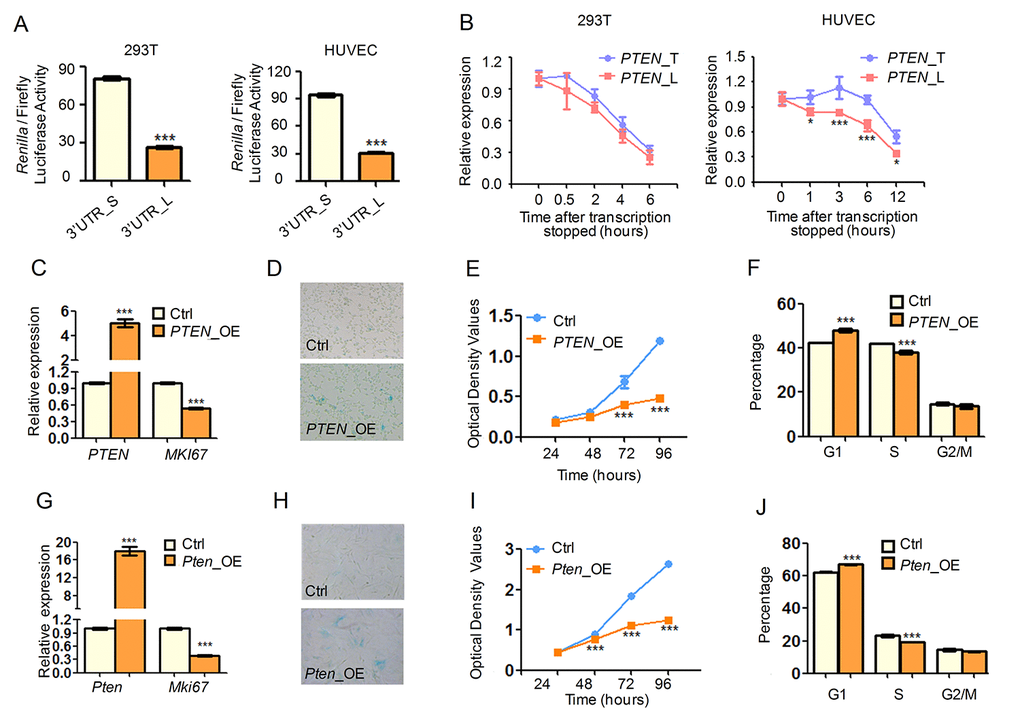
We next mimicked the elevated expression of these 3′ UTR-shortened genes by overexpressing candidate genes and examined whether they could contribute to cell senescence. Overexpression of PTEN in human cells led to decreased expression of MKI67, a well-known cell proliferation marker (Fig. 5C). Upregulation of PTEN also caused senescence-related phenotypes in human cells including increased SA-β-gal activity (Fig. 5D), decreased cell growth rate (Fig. 5E) and reduced percentage of S phase cells (Fig. 5F). Additionally, cells transfected with PTEN shorter isoform grew slower than those with the longer one (Fig. S16). Importantly, upregulated Pten promoted alike senescence-associated phenotypes in mouse cells (Fig. 5G-J). Besides, we also proved that overexpression of Pias1 and Dnmt3a resulted in similar senescence-related phenotypes, including increased SA-β-gal activity, reduced cell proliferation rate and changed cell cycle (Fig. S17). All these results supported the notion that 3′ UTR shortening contributed to, at least in part, SRSF3-KD induced senescence.
PTEN is a well-known tumor suppressor and its overexpression extends mice lifespan through reduced PI3K activity and downstream cancer protection mechanisms [82], consistent with our observation that overexpression of PTEN induced cellular senescence (Fig. 5), an important tumor prevention mechanism [83]. Since PTEN can negatively regulate PI3K/AKT pathway through dephosphorylating phosphatidylinositol-3,4,5-trisphosphate (PIP3) and thus reduce phosphorylated AKT (p-AKT) abundance [84,85], we next examined whether PTEN-induced senescence related to altered level of p-AKT. In good consistence with known reports, overexpressing PTEN in 293T and HUVEC cells reduced p-AKT abundance significantly while the AKT level did not exhibit a significant change (Fig. S18A). As knockdown of SRSF3 induced 3′ UTR shortening of PTEN and transcripts with shortened 3′ UTR of PTEN generated more protein than those with the longer one (validated by dual luciferase assay, Fig. 5A), one would expect that SRSF3-KD can increase the protein level of PTEN. Consistently, SRSF3 knockdown with two shRNAs both led to higher PTEN protein abundance in human 293T and HUVEC cells (Fig. S18B). Furthermore, SRSF3 knockdown attenuated the abundance of p-AKT but not that of the total AKT (Fig. S18B), coinciding with the result of PTEN upregulation. Together, SRSF3-KD induced senescence can be partially explained by PTEN upregulation, which at least in part contributed by 3′ UTR shortening.
Discussion
Cellular senescence is a cancer prevention mechanism, and SRSF3 could be one of the regulators given SRSF3 is downregulated in multiple senescence models and upregulated in many cancer types [5]. What’s more, knockdown of SRSF3 induced cellular senescence while increased SRSF3 expression promoted cancer-related cellular phenotypes further highlighted its regulatory importance in both biological systems [5,14], wherein splicing-dependent function of SRSF3 was mainly focused. However, SRSF3 can also regulate RNA export, RNA stability, alternative polyadenylation and translation [21–23]. Growing evidences have highlighted the biomedical importance of understanding the splicing-independent functions of multiple splicing factors such as RBFox2, SRSF2 and U2AF1 [20,86]. Here, our results also showed that reduction of SRSF3 expression indeed affected splicing of multiple genes, including TP53 gene whose splicing pattern change was consistent with the previous research (Fig. S19) [5]. However, splicing-independent function of SRSF3 in cellular senescence has not been explored. In this study, we were surprised to find that knockdown of SRSF3 led to over one thousand genes favoring proximal pA site usage, resulting in the global shortening of 3′ UTRs in both human and mouse cells. 3′ UTR shortened genes were enriched in senescence-associated pathways and likely produced more protein, as demonstrated by candidate genes. Mimicking the effect of 3′ UTR shortening by overexpression of three candidate genes all caused senescence-related phenotypes. Specifically, SRSF3 regulated PTEN’s APA at transcriptional level and contributed to senescence. Thus, SRSF3-KD induced senescence can be explained, at least in part, by its APA-dependent function (Fig. 6).
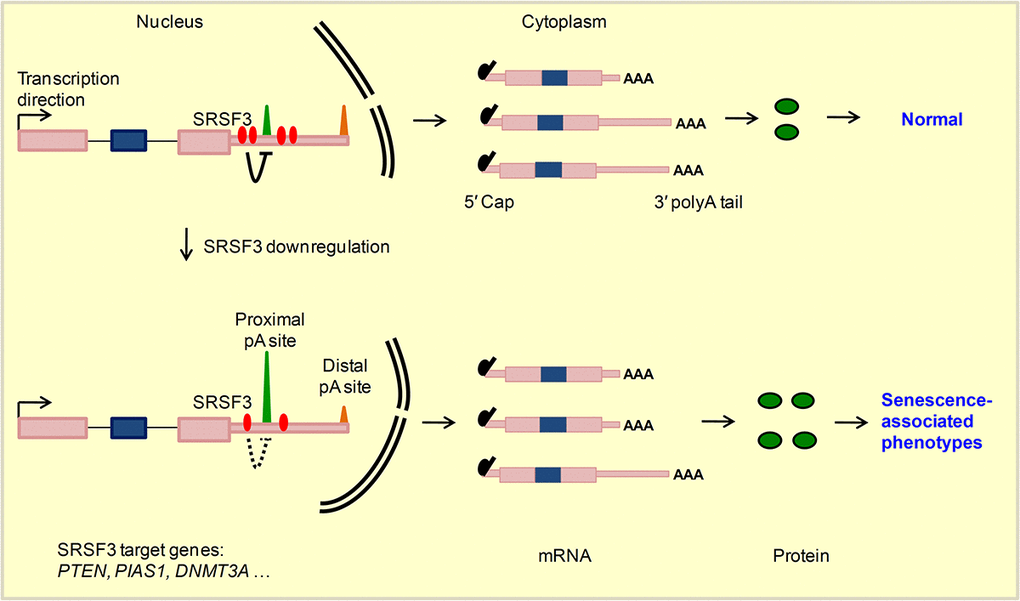
The functional link between SRSF3-KD induced APA changes and cellular senescence was supported by multiple evidences. First, SRSF3-KD induced 3′ UTR shortened genes were enriched in senescence-associated pathways. Second, overexpression of three candidate genes (PTEN, PIAS1 and DNMT3A), emulating their effect of 3′ UTR shortening upon SRSF3 knockdown (Fig. 1,2, Fig. S4,S7,S8), promoted senescence-associated phenotypes. Specifically, PTEN, a well-known tumor suppressor and lifespan regulator [82], can be regulated at APA level by SRSF3 in both human and mouse cells. Supporting this, it was recently reported that nuclear poly(A) polymerases also regulated alternative polyadenylation of PTEN [66]. We further verified that SRSF3-KD induced PTEN’s 3′ UTR shortening generated more proteins, leading to reduced level of p-AKT and ultimately senescence-related phenotypes. Additionally, we did not find any obvious changes on the splicing pattern of PTEN compared SRSF3-KD to the control (Fig. S20). These data combined support the notion that APA-dependent function of SRSF3 contributes to cellular senescence.
To profile the global APA changes in SRSF3-KD comparing to the control, we exploited two high throughput sequencing strategies (PA-seq and strand-specific RNA-seq methods) in 293T cells and HUVEC. Although we identified lots of genes undergoing 3′ UTR shortening either by eUTR or RUD analysis on PA-seq and RNA-seq, respectively, the overlap was relative small as showed in Fig. 1G. Three major differences between these two methods may underlie the phenomenon. First, the library construction step is considerable different. eUTR is calculated based on PA-seq data, which specifically enriches 3′ end sequence of polyA+ RNA. However, RUD is calculated based on RNA-seq data, which covers the full length of polyA+ RNA. Second, eUTR considers all identified pA sites located in 3′ UTR while RUD only calculates two pA sites (the most proximal pA site and the most distal pA site) within 3′ UTR. Thus eUTR and RUD will show less overlap considering this issue. Third, eUTR uses tag number in the pA cluster to reflect the usage preference and RUD reflects the relative read coverage on alternative 3′ UTR comparing to common region of 3′ UTR. Lastly, different PCR bias in different genomic region due to factors such as GC context, secondary structure may also underlie some of the difference between eUTR and RUD. Together, these above three major difference may explain the relative small overlap between eUTR and RUD. Consistent with this, overlap between two biological replicates with the same RUD calculation (52.7% for HUVEC_RUD_sh1 and HUVEC_RUD_sh2) is much higher than overlap between eUTR and RUD (22.5%).
Increasing evidences support the idea that splicing factors can regulate alternative polyadenylation. A well-known example was that downregulation of U1 small nuclear ribonucleoproteins (snRNP), which plays an important role in alternative splicing, led to the production of the truncated transcripts resulting from using cryptic pA sites located in introns [47,48]. To regulate alternative polyadenylation located within 3′ UTR, SRSF3 may need to bind to nearby locations. We thus analyzed publicly available SRSF3 CLIP-seq data to confirm whether SRSF3 can bind to 3′ UTR-shortened genes and what’s the binding difference between proximal and distal pA sites. The results showed higher SRSF3 binding density near proximal pA sites than the distal ones (Fig. 2). Given the higher usage of proximal pA site upon SRSF3 knockdown, the higher SRSF3 binding nearby proximal pA sites possibly inhibited the selection of corresponding pA sites. Further investigation is definitely warranted to elucidate the detailed mechanism of such regulation.
3′ UTR shortening induced protein upregulation probably requires the expression of miRNAs targeting the alternative 3′ UTRs between proximal and distal pA sites. We thus examined whether such miRNAs were expressed by analyzing public small RNA sequencing data in human (293T, HUVEC) and mouse cells (MEFs). Interestingly, the result showed that miRNAs specifically targeting alternative 3′ UTRs of shortened genes have similar expression profiles compared with all expressed miRNAs (Fig. S21), supporting the notion that 3′ UTR shortening produced more protein through escaping of expressed miRNAs [87]. Which miRNA(s) involved in SRSF3-induced cellular senescence deserves extensive experimental validation.
Our recent publication indicated that hundreds of genes underwent 3′ UTR lengthening in mouse embryonic fibroblasts (MEFs) replicative senescence model and rat Vascular Smooth Muscle Cells (rVSMCs) derived from old animal [32]. Specifically, longer 3′ UTR of Rras2 could produce less protein and induce senescence-related phenotypes [32]. However, it did not rule out the possibility that 3′ UTR shortening of certain genes could also promote senescence, given the complicated and sometimes opposite functions of genes in the same regulatory network. For example, kinase PI3K transforms PIP2 to PIP3, while phosphatase PTEN reverses PIP3 to PIP2. The two proteins act oppositely in the PI3K/AKT pathway, and thus similar 3′ UTR length change of these two genes might result in opposite consequences [88,89]. In the present study, we showed that SRSF3-KD induced 3′ UTR shortening of PTEN could produce more protein and promote senescence-associated phenotypes. These data support a model that both 3′ UTR lengthening and shortening could regulate cellular senescence, and the function of the corresponding gene in the senescence pathway is the key. Keeping in mind that replicative senescence is a complicated biological process that multiple factors including SRSF3 are changed. Although reduced SRSF3 led to 3′ UTR shortening of target genes, changes of other regulators during replicative senescence may cause 3′ UTR lengthening of target genes. Actually, previous reports demonstrated that both 3′ UTR lengthening and shortening can be observed upon knockdown of different RNA binding proteins [53,54]. Thus, SRSF3-KD induced global 3′ UTR shortening is not a contradiction compared to 3′ UTR lengthening in replicative senescence given the changed expression of multiple APA regulators. Understanding the downstream consequence of each APA regulators will definitely extend our understanding of the much-complicated APA changes during cellular senescence.
Materials and Methods
Cell culture, transfection and selection of stable cell lines
All cells (293T, HUVEC, NIH3T3 and MEF) used in this study were cultured in DMEM medium supplemented with 10% FBS at 37 °C incubator with 5% CO2. For transient transfection, cells were seeded in 6-well plate for 60%-70% confluence one day in advance, then transfected with lipofectamine 2000 (Invitrogen) in the second day. Cells were harvested for RNA and protein extraction 48 hours (hrs) after transfection.
For lentivirus transduction to stably knockdown SRSF3 or overexpress PTEN/PIAS1/DNMT3A in cells, the expression vector or the control vector plus VSVG and gag/pol encoding plasmids was transfected into the 293T cells, respectively. After culture for 24 and 48 hrs, the virus supernatant was harvested to infect cells. 24 hrs post the second infection, the medium was replaced with fresh DMEM medium supplemented with puromycin (final concentration was 2 μg/ml) to screen for stably transformed cells. After one day selection, the survival cells were trypsinized and split into two parts, one for cell proliferation assay and cell cycle analysis, the rest was cultured for additional two days in the medium with puromycin (2 μg/ml) for RNA and protein extraction.
Vector construction
For SRSF3 shRNA plasmid construction, the DNA oligonucleotides were annealed and then cloned into the pLKO.1 plasmid by using EcoRI and AgeI restriction enzyme sites. The short and long 3' UTR of PTEN/PIAS1 were PCR amplified by Q5 high-fidelity DNA polymerase (NEB) and then were individually ligated into the downstream of the Renilla luciferase coding gene in the dual luciferase vector psiCHECK-2. Firefly luciferase activity serves as the internal control of Renilla luciferase expression. To construct ectopic overexpression vector for PTEN/PIAS1/DNMT3A, the complete coding sequences were PCR amplified from human 293T cDNA or mouse 3T3 cDNA and then inserted into the pcDH_EF1_MCS_T2A_Puro vector.
qRT-PCR and western blot
Total RNA and protein were extracted with TRIzol reagent (Sigma) according to the manufacturer’s instruction. For cDNA synthesis, 1 μg total RNA was reverse-transcribed into cDNA by FastQuant RT Kit (TIANGEN) and oligo(dT) primer. Then quantitative PCR reaction was performed using 2×SYBR mix (KAPA) and the reaction was run on Bio-Rad CFX manager machine. Sequence information of all used primers was listed in Supplementary Table S1.
For western blot, the primary antibody for detecting SRSF3 (Abcam, cat. no. ab198291), PTEN (CST, cat. no. 9188T), pAKT (CST, cat. no. 4060T), AKT (CST, cat. no. 4691T) and GAPDH (CST, cat. no. 2118S) was 1:1000 diluted and incubated for 2 hrs at room temperature. The second antibody (HRP conjugate, YEASON) was 1:5000 diluted and incubated for 1 hr at room temperature. Blots were washed three times with TBST and visualization was carried out by Tanon Chemiluminescent Imaging System.
RNA stability assay
The stability for short and long isoforms of PTEN was measured by adding actinomycin D (actD) at a final concentration of 5 μg/ml into 293T and HUVEC cells to block transcription. Cells were harvested at different time points respectively. Total RNAs from all time points were then extracted by TRIzol reagent. The degradation rate was evaluated by qRT-PCR. The long isoform PTEN_L was quantified using primer pair specific to long 3′ UTR, while the overall expression of PTEN was quantified using primer pair shared by both short and long 3′ UTRs (PTEN_T).
Dual-luciferase reporter assay
Cells were transfected with psiCHECK-2 vectors containing either short-3' UTR or long-3' UTR using lipofectamine 2000 in 24-well plate. After transfection for 24 hrs, the firefly and Renilla luciferase activities were measured one by one according to the manufacture’s instruction (Promega). The final Renilla luciferase activity was normalized to the firefly luciferase signal.
Cell proliferation assay and cell cycle analysis
After selection by puromycin, the survival (transfected) cells were trypsinized and counted using hemocytometer. Then cells were diluted and seeded into a 96-well plate, with 2000 cells per well and three replicates for each time point (add CCK-8 reagent at 24 hrs, 48 hrs, 72 hrs and 96 hrs according to the manufacturer’s protocol). After each treatment, cells were incubated for two hours at 37 °C, then the optical density (OD) at 450 nm and 600 nm were measured respectively for each well by microplate reader (Tecan i-control).
For cell cycle analysis, cells were trypsinized, then centrifuged at 500g for four minutes (mins). Cell pellets were washed once with 1×PBS and resuspended with PBS containing 0.03% Triton X-100 and 50μg/ml Propidium Iodide (PI), and incubate for 10 mins. The cell cycle assay was then performed on the BD Flow Cytometer.
Nascent RNA assay
The nascent RNA assay was performed with the Click-iT method (Click-iT Nascent RNA Capture Kit from Thermo). Briefly, a nucleotide analog EU was added into the medium and cells were incubated for 1 hr at 37 °C. Total RNA was then extracted, and the EU-contained RNA was biotinylated. The EU-biotinylated RNA was isolated from the total RNA by Dynabeads MyOne streptavidin T1 (Invitrogen). Finally, the EU-RNA was quantified by qRT-PCR.
RNA immunoprecipitation coupled with semi-quantitative PCR (RIP-PCR)
Aspirate medium from one 10-cm plate 293T cells of 90% confluence, wherein SRSF3-flag is stably overexpressed. Wash cells with cold PBS once. Then irradiate cells under 200 mJ/cm2 in UV linker. After UV cross-link, immediately wash cells one time with cold PBS, then add RIP lysis buffer (50 mM Tris pH 7.4, 250 mM NaCl, 5 mM EDTA, 1% NP40, 0.5 mM DTT, 1× protease inhibitor, 100 U/ml RNasin) to the plates, and incubate on ice for 20 min and collect cells in a new 1.5 ml tube. Then sonicate lysed cells using Biorupter, and spin down at 16000g for 10 min at 4 °C to collect the supernatant. Additionally, pre-incubate anti-flag antibody and Rabbit IgG with protein G beads at 4 °C for 4 hours (hrs) separately before harvest cell lysates. Then add one half supernatant to anti-flag-antibody-protein G beads, and the other half to IgG-protein G. After incubate and rotate at 4 °C for 4 hrs, put the tubes in the magnetic separation rack for 1 min. Aspirate the solution and wash beads three times with cold RIP lysis buffer. Then add 4mg/ml proteinase K solution to the beads and incubate for 20 min at 37 °C. Put the tubes in the magnetic separation rack once again, and then add Urea solution (100 mM Tris pH 7.4, 50 mM NaCl, 10 mM EDTA, 7M urea) and incubate another 20 mins at 37 °C. Finally, RNA was extracted by adding TRIzol reagent, and reversely transcribed into cDNA using FastQuant RT Kit (TIANGEN). Then the semi-quantitative PCR was performed using the primers specifically targeting the shared and long 3’ UTR regions of PTEN, respectively. Finally, the RIP-PCR result was detected by electrophoresis on 1% agarose gel.
PA-seq and RNA-seq library construction
PA-seq libraries for global profiling of 3′ UTR length was constructed according to our previous publication [56]. RNA-seq libraries for expression and RUD analysis were constructed according to the previous reports [57,90]. Both PA-seq and RNA-seq libraries were sequenced using Illumina HiSeq platform.
Bioinfomatical analysis methods
FastQC software was used for quality control of PA-seq and RNA-seq data (http://www.bioinformatics.bbsrc.ac. uk/projects/fastqc/), nucleotides with sequencing quality smaller than 20 were trimmed off. For PA-seq data, paired-end reads were first subjected to strand correction as previously described [56], and only reads heading with “TTT” were kept for further analysis. All the reads (strand-corrected PA-seq reads and quality-controlled RNA-seq reads) were aligned to the reference genome (mm9 for mouse data and hg38 for human data) using STAR [91]. The peak-calling, pA sites identification and localization were processed following our published methods [32,56]. eUTR methods [56] and RUD methods [59] were used for evaluating the changes in pA site usage before and after SRSF3 knockdown according to the published methods. For RUD analysis in MEF cells, we combined our previously identified pA sites [32] with the RNA-seq data in the present study.
Cufflinks was used to estimate the mRNA abundance using RNA-seq data (fragments per kilobase of transcript per million mapped reads, FPKM) by following previously published instructions [92]. Cuffdiff, a sub-package of cufflinks, was used to evaluate the gene expression changes.
UCSC genome browser was used for visualization of the PA-seq and RNA-seq data on specific genes. For functional enrichment analysis, the Database for Annotation, Visualization and Integrated Discovery (DAVID) [93] was used for the pathway enrichment analysis and the Gene Ontology (GO) and Kyoto Encyclopedia of Genes and Genomes (KEGG) database was selected.
Data access
The raw PA-seq and RNA-seq data from this study can be accessed at the NCBI Sequence Read Archive (SRA; https://www.ncbi.nlm.nih.gov/sra/) with the accession number PRJNA523954 (or SRP186820).
Author Contributions
T.N. G.W. initiated, designed and supervised the research project. T.S. and H.L. performed the experiment. G.W., T.S., and Y.S. performed the sequencing data analysis. T.S. drafted the manuscript while T.N. and G.W. revised it.
Acknowledgments
We are grateful to Dr. Zhi-Ming Zheng for his inspiration of starting this research. Special thanks to Dr. Jun Zhu for his insightful suggestions to the bioinformatical analysis of this work. Thanks to Prof. Yongming Wang for his constitutive suggestions on the manuscript writing. This work was supported by the National Key R&D Program of China (2018YFC1003500), the National Basic Research Program of China (973 program 2015CB943000), National Natural Science Foundation of China (31771336 and 31521003). We thank CloudHealth Genomics (Shanghai) Co., Ltd. for the deep sequencing service.
Conflicts of Interest
The authors declare no competing financial interests.
References
- 1. Deschênes M, Chabot B. The emerging role of alternative splicing in senescence and aging. Aging Cell. 2017; 16:918–33. https://doi.org/10.1111/acel.12646 [PubMed]
- 2. Li H, Wang Z, Ma T, Wei G, Ni T. Alternative splicing in aging and age-related diseases. Translational Medicine of Aging. 2017; 1:32–40. https://doi.org/10.1016/j.tma.2017.09.005
- 3. Eriksson M, Brown WT, Gordon LB, Glynn MW, Singer J, Scott L, Erdos MR, Robbins CM, Moses TY, Berglund P, Dutra A, Pak E, Durkin S, et al. Recurrent de novo point mutations in lamin A cause Hutchinson-Gilford progeria syndrome. Nature. 2003; 423:293–98. https://doi.org/10.1038/nature01629 [PubMed]
- 4. De Sandre-Giovannoli A, Bernard R, Cau P, Navarro C, Amiel J, Boccaccio I, Lyonnet S, Stewart CL, Munnich A, Le Merrer M, Lévy N. Lamin a truncation in Hutchinson-Gilford progeria. Science. 2003; 300:2055. https://doi.org/10.1126/science.1084125 [PubMed]
- 5. Tang Y, Horikawa I, Ajiro M, Robles AI, Fujita K, Mondal AM, Stauffer JK, Zheng ZM, Harris CC. Downregulation of splicing factor SRSF3 induces p53β, an alternatively spliced isoform of p53 that promotes cellular senescence. Oncogene. 2013; 32:2792–98. https://doi.org/10.1038/onc.2012.288 [PubMed]
- 6. Meshorer E, Soreq H. Pre-mRNA splicing modulations in senescence. Aging Cell. 2002; 1:10–16. https://doi.org/10.1046/j.1474-9728.2002.00005.x [PubMed]
- 7. Mazin P, Xiong J, Liu X, Yan Z, Zhang X, Li M, He L, Somel M, Yuan Y, Phoebe Chen YP, Li N, Hu Y, Fu N, et al. Widespread splicing changes in human brain development and aging. Mol Syst Biol. 2013; 9:633. https://doi.org/10.1038/msb.2012.67 [PubMed]
- 8. Tollervey JR, Wang Z, Hortobágyi T, Witten JT, Zarnack K, Kayikci M, Clark TA, Schweitzer AC, Rot G, Curk T, Zupan B, Rogelj B, Shaw CE, Ule J. Analysis of alternative splicing associated with aging and neurodegeneration in the human brain. Genome Res. 2011; 21:1572–82. https://doi.org/10.1101/gr.122226.111 [PubMed]
- 9. Wang Y, Chen D, Qian H, Tsai YS, Shao S, Liu Q, Dominguez D, Wang Z. The splicing factor RBM4 controls apoptosis, proliferation, and migration to suppress tumor progression. Cancer Cell. 2014; 26:374–89. https://doi.org/10.1016/j.ccr.2014.07.010 [PubMed]
- 10. Anczuków O, Akerman M, Cléry A, Wu J, Shen C, Shirole NH, Raimer A, Sun S, Jensen MA, Hua Y, Allain FH, Krainer AR. SRSF1-regulated alternative splicing in breast cancer. Mol Cell. 2015; 60:105–17. https://doi.org/10.1016/j.molcel.2015.09.005 [PubMed]
- 11. Anczuków O, Rosenberg AZ, Akerman M, Das S, Zhan L, Karni R, Muthuswamy SK, Krainer AR. The splicing factor SRSF1 regulates apoptosis and proliferation to promote mammary epithelial cell transformation. Nat Struct Mol Biol. 2012; 19:220–28. https://doi.org/10.1038/nsmb.2207 [PubMed]
- 12. Bruun GH, Doktor TK, Borch-Jensen J, Masuda A, Krainer AR, Ohno K, Andresen BS. Global identification of hnRNP A1 binding sites for SSO-based splicing modulation. BMC Biol. 2016; 14:54. https://doi.org/10.1186/s12915-016-0279-9 [PubMed]
- 13. Lee BP, Pilling LC, Emond F, Flurkey K, Harrison DE, Yuan R, Peters LL, Kuchel GA, Ferrucci L, Melzer D, Harries LW. Changes in the expression of splicing factor transcripts and variations in alternative splicing are associated with lifespan in mice and humans. Aging Cell. 2016; 15:903–13. https://doi.org/10.1111/acel.12499 [PubMed]
- 14. Jia R, Li C, McCoy JP, Deng CX, Zheng ZM. SRp20 is a proto-oncogene critical for cell proliferation and tumor induction and maintenance. Int J Biol Sci. 2010; 6:806–26. https://doi.org/10.7150/ijbs.6.806 [PubMed]
- 15. Sen S, Langiewicz M, Jumaa H, Webster NJ. Deletion of serine/arginine-rich splicing factor 3 in hepatocytes predisposes to hepatocellular carcinoma in mice. Hepatology. 2015; 61:171–83. https://doi.org/10.1002/hep.27380 [PubMed]
- 16. Wong J, Garner B, Halliday GM, Kwok JB. Srp20 regulates TrkB pre-mRNA splicing to generate TrkB-Shc transcripts with implications for Alzheimer’s disease. J Neurochem. 2012; 123:159–71. https://doi.org/10.1111/j.1471-4159.2012.07873.x [PubMed]
- 17. He X, Arslan AD, Pool MD, Ho TT, Darcy KM, Coon JS, Beck WT. Knockdown of splicing factor SRp20 causes apoptosis in ovarian cancer cells and its expression is associated with malignancy of epithelial ovarian cancer. Oncogene. 2011; 30:356–65. https://doi.org/10.1038/onc.2010.426 [PubMed]
- 18. Wu H, Sun S, Tu K, Gao Y, Xie B, Krainer AR, Zhu J. A splicing-independent function of SF2/ASF in microRNA processing. Mol Cell. 2010; 38:67–77. https://doi.org/10.1016/j.molcel.2010.02.021 [PubMed]
- 19. Wei C, Xiao R, Chen L, Cui H, Zhou Y, Xue Y, Hu J, Zhou B, Tsutsui T, Qiu J, Li H, Tang L, Fu XD. RBFox2 binds nascent RNA to globally regulate Polycomb Complex 2 Targeting in mammalian genomes. Mol Cell. 2016; 62:875–89. https://doi.org/10.1016/j.molcel.2016.04.013 [PubMed]
- 20. Gao C, Hu J, Wei C, Hsiao YE, Ren S, Xue Y, Zhou Y, Zhang J, Chen J, Xiao X, Fu XD, Xing Y, Wang Y. Function beyond RNA splicing for RBFox family members in heart. J Mol Cell Cardiol. 2017; 112:146–47. https://doi.org/10.1016/j.yjmcc.2017.07.050
- 21. Huang Y, Steitz JA. Splicing factors SRp20 and 9G8 promote the nucleocytoplasmic export of mRNA. Mol Cell. 2001; 7:899–905. https://doi.org/10.1016/S1097-2765(01)00233-7 [PubMed]
- 22. Bedard KM, Daijogo S, Semler BL. A nucleo-cytoplasmic SR protein functions in viral IRES-mediated translation initiation. EMBO J. 2007; 26:459–67. https://doi.org/10.1038/sj.emboj.7601494 [PubMed]
- 23. Lou H, Neugebauer KM, Gagel RF, Berget SM. Regulation of alternative polyadenylation by U1 snRNPs and SRp20. Mol Cell Biol. 1998; 18:4977–85. https://doi.org/10.1128/MCB.18.9.4977 [PubMed]
- 24. Di Giammartino DC, Nishida K, Manley JL. Mechanisms and consequences of alternative polyadenylation. Mol Cell. 2011; 43:853–66. https://doi.org/10.1016/j.molcel.2011.08.017 [PubMed]
- 25. Tian B, Manley JL. Alternative polyadenylation of mRNA precursors. Nat Rev Mol Cell Biol. 2017; 18:18–30. https://doi.org/10.1038/nrm.2016.116 [PubMed]
- 26. Berkovits BD, Mayr C. Alternative 3′ UTRs act as scaffolds to regulate membrane protein localization. Nature. 2015; 522:363–67. https://doi.org/10.1038/nature14321 [PubMed]
- 27. Chen W, Jia Q, Song Y, Fu H, Wei G, Ni T. Alternative polyadenylation: methods, findings, and impacts. Genomics Proteomics Bioinformatics. 2017; 15:287–300. https://doi.org/10.1016/j.gpb.2017.06.001 [PubMed]
- 28. Mayr C, Bartel DP. Widespread shortening of 3'UTRs by alternative cleavage and polyadenylation activates oncogenes in cancer cells. Cell. 2009; 138:673–84. https://doi.org/10.1016/j.cell.2009.06.016 [PubMed]
- 29. Fu Y, Sun Y, Li Y, Li J, Rao X, Chen C, Xu A. Differential genome-wide profiling of tandem 3′ UTRs among human breast cancer and normal cells by high-throughput sequencing. Genome Res. 2011; 21:741–47. https://doi.org/10.1101/gr.115295.110 [PubMed]
- 30. Ji Z, Tian B. Reprogramming of 3 ' untranslated regions of mRNAs by alternative polyadenylation in generation of pluripotent stem cells from different cell types. PLoS One. 2009; 4:e8419. https://doi.org/10.1371/journal.pone.0008419
- 31. Ji Z, Lee JY, Pan Z, Jiang B, Tian B. Progressive lengthening of 3 ' untranslated regions of mRNAs by alternative polyadenylation during mouse embryonic development. Proc Natl Acad Sci USA. 2009; 106:7028–7033. https://doi.org/10.1073/pnas.0900028106
- 32. Chen M, Lyu G, Han M, Nie H, Shen T, Chen W, Niu Y, Song Y, Li X, Li H, Chen X, Wang Z, Xia Z, et al. 3′ UTR lengthening as a novel mechanism in regulating cellular senescence. Genome Res. 2018; 28:285–94. https://doi.org/10.1101/gr.224451.117 [PubMed]
- 33. Elkon R, Ugalde AP, Agami R. Alternative cleavage and polyadenylation: extent, regulation and function. Nat Rev Genet. 2013; 14:496–506. https://doi.org/10.1038/nrg3482 [PubMed]
- 34. Tian B, Hu J, Zhang H, Lutz CS. A large-scale analysis of mRNA polyadenylation of human and mouse genes. Nucleic Acids Res. 2005; 33:201–12. https://doi.org/10.1093/nar/gki158 [PubMed]
- 35. Zhao J, Hyman L, Moore C. Formation of mRNA 3′ ends in eukaryotes: mechanism, regulation, and interrelationships with other steps in mRNA synthesis. Microbiol Mol Biol Rev. 1999; 63:405–45. [PubMed]
- 36. Tian B, Graber JH. Signals for pre-mRNA cleavage and polyadenylation. Wiley Interdiscip Rev RNA. 2012; 3:385–96. https://doi.org/10.1002/wrna.116 [PubMed]
- 37. Mandel CR, Bai Y, Tong L. Protein factors in pre-mRNA 3′-end processing. Cell Mol Life Sci. 2008; 65:1099–122. https://doi.org/10.1007/s00018-007-7474-3 [PubMed]
- 38. Deka P, Rajan PK, Perez-Canadillas JM, Varani G. Protein and RNA dynamics play key roles in determining the specific recognition of GU-rich polyadenylation regulatory elements by human Cstf-64 protein. J Mol Biol. 2005; 347:719–33. https://doi.org/10.1016/j.jmb.2005.01.046 [PubMed]
- 39. Takagaki Y, Seipelt RL, Peterson ML, Manley JL. The polyadenylation factor CstF-64 regulates alternative processing of IgM heavy chain pre-mRNA during B cell differentiation. Cell. 1996; 87:941–52. https://doi.org/10.1016/S0092-8674(00)82000-0 [PubMed]
- 40. Yao C, Choi EA, Weng L, Xie X, Wan J, Xing Y, Moresco JJ, Tu PG, Yates JR
3rd , Shi Y. Overlapping and distinct functions of CstF64 and CstF64τ in mammalian mRNA 3′ processing. RNA. 2013; 19:1781–90. https://doi.org/10.1261/rna.042317.113 [PubMed] - 41. Yao C, Biesinger J, Wan J, Weng L, Xing Y, Xie X, Shi Y. Transcriptome-wide analyses of CstF64-RNA interactions in global regulation of mRNA alternative polyadenylation. Proc Natl Acad Sci USA. 2012; 109:18773–78. https://doi.org/10.1073/pnas.1211101109 [PubMed]
- 42. Kubo T, Wada T, Yamaguchi Y, Shimizu A, Handa H. Knock-down of 25 kDa subunit of cleavage factor Im in Hela cells alters alternative polyadenylation within 3′-UTRs. Nucleic Acids Res. 2006; 34:6264–71. https://doi.org/10.1093/nar/gkl794 [PubMed]
- 43. Gruber AR, Martin G, Keller W, Zavolan M. Cleavage factor Im is a key regulator of 3′ UTR length. RNA Biol. 2012; 9:1405–12. https://doi.org/10.4161/rna.22570 [PubMed]
- 44. Kim S, Yamamoto J, Chen Y, Aida M, Wada T, Handa H, Yamaguchi Y. Evidence that cleavage factor Im is a heterotetrameric protein complex controlling alternative polyadenylation. Genes Cells. 2010; 15:1003–13. https://doi.org/10.1111/j.1365-2443.2010.01436.x [PubMed]
- 45. Martin G, Gruber AR, Keller W, Zavolan M. Genome-wide analysis of pre-mRNA 3′ end processing reveals a decisive role of human cleavage factor I in the regulation of 3′ UTR length. Cell Reports. 2012; 1:753–63. https://doi.org/10.1016/j.celrep.2012.05.003 [PubMed]
- 46. Wang B, Côté AP, Furukawa H, O’Keeffe M, Yaghi OM. Colossal cages in zeolitic imidazolate frameworks as selective carbon dioxide reservoirs. Nature. 2008; 453:207–11. https://doi.org/10.1038/nature06900 [PubMed]
- 47. Kaida D, Berg MG, Younis I, Kasim M, Singh LN, Wan L, Dreyfuss G. U1 snRNP protects pre-mRNAs from premature cleavage and polyadenylation. Nature. 2010; 468:664–68. https://doi.org/10.1038/nature09479 [PubMed]
- 48. Berg MG, Singh LN, Younis I, Liu Q, Pinto AM, Kaida D, Zhang Z, Cho S, Sherrill-Mix S, Wan L, Dreyfuss G. U1 snRNP determines mRNA length and regulates isoform expression. Cell. 2012; 150:53–64. https://doi.org/10.1016/j.cell.2012.05.029 [PubMed]
- 49. Arhin GK, Boots M, Bagga PS, Milcarek C, Wilusz J. Downstream sequence elements with different affinities for the hnRNP H/H′ protein influence the processing efficiency of mammalian polyadenylation signals. Nucleic Acids Res. 2002; 30:1842–50. https://doi.org/10.1093/nar/30.8.1842 [PubMed]
- 50. Licatalosi DD, Mele A, Fak JJ, Ule J, Kayikci M, Chi SW, Clark TA, Schweitzer AC, Blume JE, Wang X, Darnell JC, Darnell RB. HITS-CLIP yields genome-wide insights into brain alternative RNA processing. Nature. 2008; 456:464–69. https://doi.org/10.1038/nature07488 [PubMed]
- 51. Pinto PA, Henriques T, Freitas MO, Martins T, Domingues RG, Wyrzykowska PS, Coelho PA, Carmo AM, Sunkel CE, Proudfoot NJ, Moreira A. RNA polymerase II kinetics in polo polyadenylation signal selection. EMBO J. 2011; 30:2431–44. https://doi.org/10.1038/emboj.2011.156 [PubMed]
- 52. Spies N, Nielsen CB, Padgett RA, Burge CB. Biased chromatin signatures around polyadenylation sites and exons. Mol Cell. 2009; 36:245–54. https://doi.org/10.1016/j.molcel.2009.10.008 [PubMed]
- 53. Castelo-Branco P, Furger A, Wollerton M, Smith C, Moreira A, Proudfoot N. Polypyrimidine tract binding protein modulates efficiency of polyadenylation. Mol Cell Biol. 2004; 24:4174–83. https://doi.org/10.1128/MCB.24.10.4174-4183.2004 [PubMed]
- 54. Ji X, Wan J, Vishnu M, Xing Y, Liebhaber SA. αCP Poly(C) binding proteins act as global regulators of alternative polyadenylation. Mol Cell Biol. 2013; 33:2560–73. https://doi.org/10.1128/MCB.01380-12 [PubMed]
- 55. Al-Ahmadi W, Al-Ghamdi M, Al-Haj L, Al-Saif M, Khabar KS. Alternative polyadenylation variants of the RNA binding protein, HuR: abundance, role of AU-rich elements and auto-Regulation. Nucleic Acids Res. 2009; 37:3612–24. https://doi.org/10.1093/nar/gkp223 [PubMed]
- 56. Ni T, Yang Y, Hafez D, Yang W, Kiesewetter K, Wakabayashi Y, Ohler U, Peng W, Zhu J. Distinct polyadenylation landscapes of diverse human tissues revealed by a modified PA-seq strategy. BMC Genomics. 2013; 14:615. https://doi.org/10.1186/1471-2164-14-615 [PubMed]
- 57. Zhong S, Joung JG, Zheng Y, Chen YR, Liu B, Shao Y, Xiang JZ, Fei Z, Giovannoni JJ. High-throughput illumina strand-specific RNA sequencing library preparation. Cold Spring Harb Protoc. 2011; 2011:940–49. https://doi.org/10.1101/pdb.prot5652 [PubMed]
- 58. Wang R, Nambiar R, Zheng D, Tian B. PolyA_DB 3 catalogs cleavage and polyadenylation sites identified by deep sequencing in multiple genomes. Nucleic Acids Res. 2018; 46:D315–19. https://doi.org/10.1093/nar/gkx1000 [PubMed]
- 59. Ji Z, Luo W, Li W, Hoque M, Pan Z, Zhao Y, Tian B. Transcriptional activity regulates alternative cleavage and polyadenylation. Mol Syst Biol. 2011; 7:534. https://doi.org/10.1038/msb.2011.69 [PubMed]
- 60. Coleman PR, Chang G, Hutas G, Grimshaw M, Vadas MA, Gamble JR. Age-associated stresses induce an anti-inflammatory senescent phenotype in endothelial cells. Aging (Albany NY). 2013; 5:913–24. https://doi.org/10.18632/aging.100622 [PubMed]
- 61. Collin G, Huna A, Warnier M, Flaman JM, Bernard D. Transcriptional repression of DNA repair genes is a hallmark and a cause of cellular senescence. Cell Death Dis. 2018; 9:259. https://doi.org/10.1038/s41419-018-0300-z [PubMed]
- 62. Tian XL, Li Y. Endothelial cell senescence and age-related vascular diseases. J Genet Genomics. 2014; 41:485–95. https://doi.org/10.1016/j.jgg.2014.08.001 [PubMed]
- 63. Müller-McNicoll M, Botti V, de Jesus Domingues AM, Brandl H, Schwich OD, Steiner MC, Curk T, Poser I, Zarnack K, Neugebauer KM. SR proteins are NXF1 adaptors that link alternative RNA processing to mRNA export. Genes Dev. 2016; 30:553–66. https://doi.org/10.1101/gad.276477.115 [PubMed]
- 64. Xiao W, Adhikari S, Dahal U, Chen YS, Hao YJ, Sun BF, Sun HY, Li A, Ping XL, Lai WY, Wang X, Ma HL, Huang CM, et al. Nuclear m(6)A reader YTHDC1 regulates mRNA splicing. Mol Cell. 2016; 61:507–19. https://doi.org/10.1016/j.molcel.2016.01.012 [PubMed]
- 65. Thivierge C, Tseng HW, Mayya VK, Lussier C, Gravel SP, Duchaine TF. Alternative polyadenylation confers Pten mRNAs stability and resistance to microRNAs. Nucleic Acids Res. 2018; 46:10340–52. https://doi.org/10.1093/nar/gky666 [PubMed]
- 66. Li W, Li W, Laishram RS, Hoque M, Ji Z, Tian B, Anderson RA. Distinct regulation of alternative polyadenylation and gene expression by nuclear poly(A) polymerases. Nucleic Acids Res. 2017; 45:8930–42. https://doi.org/10.1093/nar/gkx560 [PubMed]
- 67. Gray IC, Stewart LM, Phillips SM, Hamilton JA, Gray NE, Watson GJ, Spurr NK, Snary D. Mutation and expression analysis of the putative prostate tumour-suppressor gene PTEN. Br J Cancer. 1998; 78:1296–300. https://doi.org/10.1038/bjc.1998.674 [PubMed]
- 68. Powers ET, Morimoto RI, Dillin A, Kelly JW, Balch WE. Biological and chemical approaches to diseases of proteostasis deficiency. Annu Rev Biochem. 2009; 78:959–91. https://doi.org/10.1146/annurev.biochem.052308.114844 [PubMed]
- 69. Luo J, Chen J, Deng ZL, Luo X, Song WX, Sharff KA, Tang N, Haydon RC, Luu HH, He TC. Wnt signaling and human diseases: what are the therapeutic implications? Lab Invest. 2007; 87:97–103. https://doi.org/10.1038/labinvest.3700509 [PubMed]
- 70. Johnson SC, Rabinovitch PS, Kaeberlein M. mTOR is a key modulator of ageing and age-related disease. Nature. 2013; 493:338–45. https://doi.org/10.1038/nature11861 [PubMed]
- 71. Cornu M, Albert V, Hall MN. mTOR in aging, metabolism, and cancer. Curr Opin Genet Dev. 2013; 23:53–62. https://doi.org/10.1016/j.gde.2012.12.005 [PubMed]
- 72. Salminen A, Kaarniranta K. AMP-activated protein kinase (AMPK) controls the aging process via an integrated signaling network. Ageing Res Rev. 2012; 11:230–41. https://doi.org/10.1016/j.arr.2011.12.005 [PubMed]
- 73. Bartke A, Chandrashekar V, Dominici F, Turyn D, Kinney B, Steger R, Kopchick JJ. Insulin-like growth factor 1 (IGF-1) and aging: controversies and new insights. Biogerontology. 2003; 4:1–8. https://doi.org/10.1023/A:1022448532248 [PubMed]
- 74. Salih DA, Brunet A. FoxO transcription factors in the maintenance of cellular homeostasis during aging. Curr Opin Cell Biol. 2008; 20:126–36. https://doi.org/10.1016/j.ceb.2008.02.005 [PubMed]
- 75. Martínez G, Duran-Aniotz C, Cabral-Miranda F, Vivar JP, Hetz C. Endoplasmic reticulum proteostasis impairment in aging. Aging Cell. 2017; 16:615–23. https://doi.org/10.1111/acel.12599 [PubMed]
- 76. López-Otín C, Blasco MA, Partridge L, Serrano M, Kroemer G. The hallmarks of aging. Cell. 2013; 153:1194–217. https://doi.org/10.1016/j.cell.2013.05.039 [PubMed]
- 77. Hu F, Liu F. Targeting tissue-specific metabolic signaling pathways in aging: the promise and limitations. Protein Cell. 2014; 5:21–35. https://doi.org/10.1007/s13238-013-0002-3 [PubMed]
- 78. Dimri GP, Lee X, Basile G, Acosta M, Scott G, Roskelley C, Medrano EE, Linskens M, Rubelj I, Pereira-Smith O. A biomarker that identifies senescent human cells in culture and in aging skin in vivo. Proc Natl Acad Sci USA. 1995; 92:9363–67. https://doi.org/10.1073/pnas.92.20.9363 [PubMed]
- 79. Sun X, Bizhanova A, Matheson TD, Yu J, Zhu LJ, Kaufman PD. Ki-67 contributes to normal cell cycle progression and inactive X heterochromatin in p21 checkpoint-proficient human cells. Mol Cell Biol. 2017; 37:e00569-16. https://doi.org/10.1128/MCB.00569-16 [PubMed]
- 80. Sumazin P, Yang X, Chiu HS, Chung WJ, Iyer A, Llobet-Navas D, Rajbhandari P, Bansal M, Guarnieri P, Silva J, Califano A. An extensive microRNA-mediated network of RNA-RNA interactions regulates established oncogenic pathways in glioblastoma. Cell. 2011; 147:370–81. https://doi.org/10.1016/j.cell.2011.09.041 [PubMed]
- 81. He L. Posttranscriptional regulation of PTEN dosage by noncoding RNAs. Sci Signal. 2010; 3:pe39. https://doi.org/10.1126/scisignal.3146pe39 [PubMed]
- 82. Ortega-Molina A, Serrano M. PTEN in cancer, metabolism, and aging. Trends Endocrinol Metab. 2013; 24:184–89. https://doi.org/10.1016/j.tem.2012.11.002 [PubMed]
- 83. Dimri GP. What has senescence got to do with cancer? Cancer Cell. 2005; 7:505–12. https://doi.org/10.1016/j.ccr.2005.05.025 [PubMed]
- 84. Blanco-Aparicio C, Renner O, Leal JF, Carnero A. PTEN, more than the AKT pathway. Carcinogenesis. 2007; 28:1379–86. https://doi.org/10.1093/carcin/bgm052 [PubMed]
- 85. Maehama T, Dixon JE. The tumor suppressor, PTEN/MMAC1, dephosphorylates the lipid second messenger, phosphatidylinositol 3,4,5-trisphosphate. J Biol Chem. 1998; 273:13375–78. https://doi.org/10.1074/jbc.273.22.13375 [PubMed]
- 86. Chen L, Chen JY, Huang YJ, Gu Y, Qiu J, Qian H, Shao C, Zhang X, Hu J, Li H, He S, Zhou Y, Abdel-Wahab O, et al. The Augmented R-Loop Is a Unifying Mechanism for Myelodysplastic Syndromes Induced by High-Risk Splicing Factor Mutations. Mol Cell. 2018; 69:412–425.e6. https://doi.org/10.1016/j.molcel.2017.12.029 [PubMed]
- 87. Bartel DP. MicroRNAs: target recognition and regulatory functions. Cell. 2009; 136:215–33. https://doi.org/10.1016/j.cell.2009.01.002 [PubMed]
- 88. Steelman LS, Chappell WH, Abrams SL, Kempf RC, Long J, Laidler P, Mijatovic S, Maksimovic-Ivanic D, Stivala F, Mazzarino MC, Donia M, Fagone P, Malaponte G, et al. Roles of the Raf/MEK/ERK and PI3K/PTEN/Akt/mTOR pathways in controlling growth and sensitivity to therapy-implications for cancer and aging. Aging (Albany NY). 2011; 3:192–222. https://doi.org/10.18632/aging.100296 [PubMed]
- 89. Maehama T, Dixon JE. The tumor suppressor, PTEN/MMAC1, dephosphorylates the lipid second messenger, phosphatidylinositol 3,4,5-trisphosphate. J Biol Chem. 1998; 273:13375–78. https://doi.org/10.1074/jbc.273.22.13375 [PubMed]
- 90. Parkhomchuk D, Borodina T, Amstislavskiy V, Banaru M, Hallen L, Krobitsch S, Lehrach H, Soldatov A. Transcriptome analysis by strand-specific sequencing of complementary DNA. Nucleic Acids Res. 2009; 37:e123. https://doi.org/10.1093/nar/gkp596 [PubMed]
- 91. Dobin A, Davis CA, Schlesinger F, Drenkow J, Zaleski C, Jha S, Batut P, Chaisson M, Gingeras TR. STAR: ultrafast universal RNA-seq aligner. Bioinformatics. 2013; 29:15–21. https://doi.org/10.1093/bioinformatics/bts635 [PubMed]
- 92. Trapnell DW, Hamrick JL, Ishibashi CD, Kartzinel TR. Genetic inference of epiphytic orchid colonization; it may only take one. Mol Ecol. 2013; 22:3680–92. https://doi.org/10.1111/mec.12338 [PubMed]
- 93. Huang W, Sherman BT, Lempicki RA. Systematic and integrative analysis of large gene lists using DAVID bioinformatics resources. Nat Protoc. 2009; 4:44–57. https://doi.org/10.1038/nprot.2008.211 [PubMed]