


Introduction
α-Synuclein (SNCA) is a presynaptic protein and the major component of Lewy bodies, the hallmark proteinaceous inclusions implicated in synucleinopathies, including Parkinson’s disease. While it is evident that SNCA is a key player in synucleinopathies pathogenesis, its exact role, although broadly investigated, is not yet fully understood, either in health or in disease [1].
Proteostasis (protein homeostasis) is maintained by a fine balance between folding, refolding and/or degradation of proteins, orchestrated by molecular chaperones and the proteolytic systems: the ubiquitin-proteasome system (UPS) and lysosome-mediated degradation pathways (reviewed in [2]). SNCA, an aggregation-prone protein, is a target for degradation by proteolytic systems including UPS and macroautophagy (hereafter called autophagy) (reviewed in [3-6]). However, the pathways of SNCA degradation remain controversial and the mechanism(s) that govern whether SNCA will be degraded by the UPS or autophagy remain(s) unclear [4]. In yeast cells expressing SNCA, the pharmacological and genetic inhibition of proteasome resulted in contradictory observations [7-11]. Nonetheless, both degradation pathways, UPS and autophagy, become overloaded in pathological conditions associated with synucleinopathies, such as those caused by SNCA overexpression or the presence of point mutations [7,12-14]. Failure of SNCA clearance due to impairment of protein quality control systems, particularly autophagy, has become a recognized central and common pathogenic event of synucleinopathies [4,12,15-17]. This event of proteostasis collapse is aggravated by aging, a major risk factor for neurodegenerative disorders [18]. Thus, interventions that delay aging could have promising therapeutic effects in PD and other synucleinopathies.
Caloric restriction (CR) is still one of the most effective non-genetic interventions known to promote lifespan extension in several model organisms [19]. CR was shown to alleviate SNCA toxicity in different PD models, ranging from the unicellular yeast to Caenorhabditis elegans, mice and primates [20-25]. CR has been shown to ameliorate the age-related decline of proteostasis by the activation of the protein degradation machinery or through alterations in the balance between protein synthesis and degradation (reviewed in [26]). With regard to protein degradation, CR is known as an enhancer of both UPS [27-29] and autophagy, the later through the modulation of different regulatory pathways/molecules, such as TORC1 or AMPK (yeast homologue of Snf1). However, how CR impacts on the crosstalk between UPS and autophagy and its contribution for SNCA toxicity, a critical stress scenario in aging conditions, remains mostly unexplored. Herein, using a simple and powerful model organism, the yeast Saccharomyces cerevisiae heterologously expressing the human SNCA, we aimed to understand the contribution of proteolytic systems and their crosstalk to the beneficial effects promoted by CR intervention during aging.
Our data shows that CR promotes the upregulation of UPS accompanied by the maintenance of autophagy at homeostatic levels in aged SNCA-expressing cells. The study of the crosstalk between UPS and autophagy indicated that UPS is increased upon autophagy inhibition, but autophagy is not enhanced by UPS inhibition under CR conditions. These results suggest an important role of autophagy on regulation of proteasome homeostasis under CR conditions. Maintenance and regulation of autophagy at homeostatic levels appears to be the central mechanism underlying the cell’s rescue from SNCA-mediated toxicity by CR.
Results
Caloric restriction enhances ubiquitin-proteasome activity of aged SNCA-expressing cells
Our previous results showed that caloric restriction (CR) promotes chronological lifespan (CLS) extension of yeast cells heterologously expressing the human α-synuclein (SNCA) (Fig. 1A) associated with the maintenance of autophagy at homeostatic levels [21]. CR promoting-longevity effects are highly dependent on the main proteolytic systems, ubiquitin-proteasome system (UPS) and autophagy, both affected by aging and SNCA expression. Thus, the contribution of these two cellular processes to CR-extended longevity in SNCA-expressing cells was evaluated. UPS activity, namely the chymotrypsin- and trypsin-like activities, was assessed during CLS. The results showed that SNCA affects UPS functioning by leading to a dramatic reduction of chymotrypsin-like activity in aged cells (Fig. 1B). Trypsin-like activity was affected only after 7 days of CLS (Fig. 1B). Decreased UPS activity in SNCA-expressing cells was also confirmed by the increased accumulation of the short-lived protein UBG76V-GFP (Fig. 1C and 1D), which reflects a reduction of the ubiquitin/proteasome-dependent proteolysis. These findings were further corroborated by the increase in protein ubiquitination profile (Fig. 1E and 1F) and by the increased RPN4 relative mRNA expression levels (Fig. 1G). The increase in the RPN4 mRNA levels in SNCA-expressing cells are accompanied by a decrease in the mRNA levels of RPN5, a subunit of the 26S proteasome complex, indicating that the proteasome stress regulon is operating under this proteotoxic conditions (Fig. 1H). Deletion of RPN4 abolishes the Rpn4-dependent upregulation of RPN5 transcription (data not shown) as previously described for other stress conditions [30]. These results agree with a previous report showing that SNCA alters proteasome composition and impairs proteasome-mediated protein degradation affecting the survival of stationary phase cells [31].
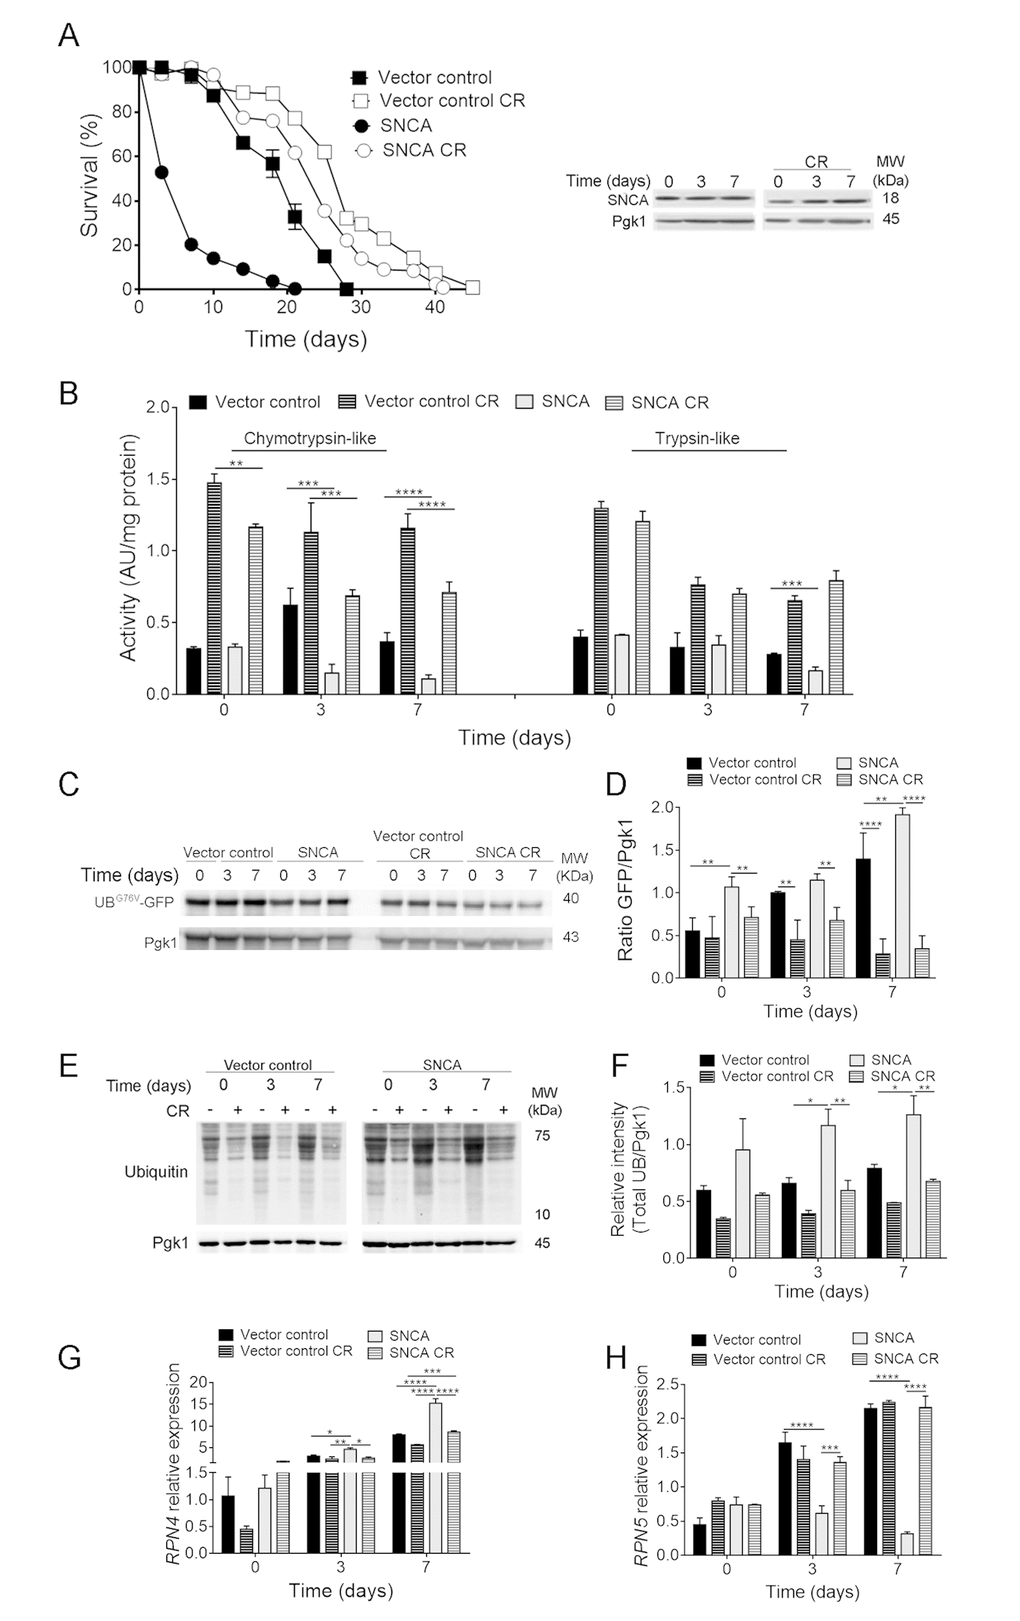
Figure 1. Caloric restriction abrogates α-synuclein (SNCA)-induced toxicity by upregulating ubiquitin-proteasome system activity. (A) Chronological lifespan (CLS) and SNCA levels of stationary wild type cells harbouring the vector control or expressing the human SNCA grown under regular (2% glucose) or CR (0.5% glucose) conditions. (B) Chymotrypsin- and trypsin like activities. The assay was normalized to the total protein amount. (C) UPS activity measured by monitoring the ubiquitin/proteasome-dependent proteolysis of the short-lived protein UBG76V-GFP. GFP was detected by Western blotting using a GFP-specific antibody. (D) Graphical representation of GFP/Pgk1 obtained by densitometric analysis. (E) Ubiquitination profile determined by Western blotting using an anti-mono and polyubiquitination antibody. (F) Graphical representation of the intensity of total UB/Pgk1 obtained by densitometric analysis. (G) RPN4 and (H) RPN5 mRNA relative expression levels. Three reference genes (ACT1-actin, PDA1-alpha subunit of pyruvate dehydrogenase and TDH2-isoform 2 of glyceraldehyde-3-phosphate dehydrogenase) were used as internal standards and for the normalization of mRNA expression levels. Significance was determined by two-way ANOVA (*p≤0.05, **p≤0.01, ***p≤0.001, ****p≤0.0001) between cells grown under regular or CR conditions expressing vector control or SNCA. Data represents mean ± SEM of at least three biological independent replicas. The error bars represent the standard error of the mean (SEM).
Importantly, CR intervention promoted an increase of UPS activity (Fig. 1B, 1C and 1D), increase of RPN5 mRNA levels and reduction of RPN4 levels, and protein ubiquitination profile (Fig. 1) in SNCA-expressing cells submitted to CR. Comparing the RPN4 and RPN5 mRNA levels with UPS activities of caloric restricted SNCA-expressing cells, it is possible to conclude that UPS activity is increased since day 0 while RPN4 and RPN5 mRNA levels are only decreased and increased, respectively, at day 3 of CLS (Fig. 1). This is most probably the result of the negative feedback regulation of proteasome homeostasis. Overall the data presented suggests that CR intervention is able to increase UPS functioning during aging of SNCA-expressing cells.
Autophagy inhibition in SNCA-expressing cells submitted to caloric restriction is associated with increased ubiquitin-proteasome activity
The crosstalk between UPS and autophagy is known to be critical for the surveillance and prevention of protein misfolding toxicity [26,32,33]. Our data showed that CR is able to modulate both UPS (Fig.1) and autophagy [21,34] in aged SNCA-expressing cells, suggesting a coordination between both in this scenario. To explore this hypothesis, autophagy was inhibited in CR conditions and the response of SNCA-expressing cells evaluated during aging. Inhibition of autophagy with chloroquine (CQ) in caloric restricted cells expressing SNCA resulted in a shorter CLS, as compared with cells expressing vector control in the same conditions (Fig. 2A and 2B). These results were further supported by the comparison of the mean (50% of survival) and maximum (10% of survival) lifespans of SNCA-expressing cells with vector control expressing cells, under CR in the presence or absence of CQ (Fig. 2B). These data suggest a relevant role of autophagy in CR-mediated lifespan extension of SNCA-expressing cells. Although autophagy inhibition resulted in a decreased CLS of caloric restricted SNCA-expressing cells (Fig 2A), the CLS of these cells is still increased when compared to SNCA-expressing cells under normal growth conditions (2% glucose) (mean lifespan of 23.1 ± 0.2 days versus 7.7 ± 0.6 days) (Fig. 1A). Next, we wondered about the contribution of UPS activity for the CR effects on the CLS of SNCA-expressing cells when autophagy is inhibited. Pharmacological inhibition of autophagy resulted in increased UPS activity along chronological aging as reflected by chymotrypsin- and trypsin-like activities (Fig. 2D) and by the decreased levels of UBG76V-GFP (Fig. 2E and 2F) in caloric restricted SNCA-expressing cells. The increase of UPS activity elicited by autophagy inhibition is further confirmed by a decrease of the protein ubiquitination profile (Fig. 2G and 2H) and of RPN4 mRNA levels in SNCA-expressing cells under CR conditions (Fig. 2C). Altogether, the data revealed that UPS and autophagy crosstalk under CR with increased UPS activity as a response to autophagy inhibition.
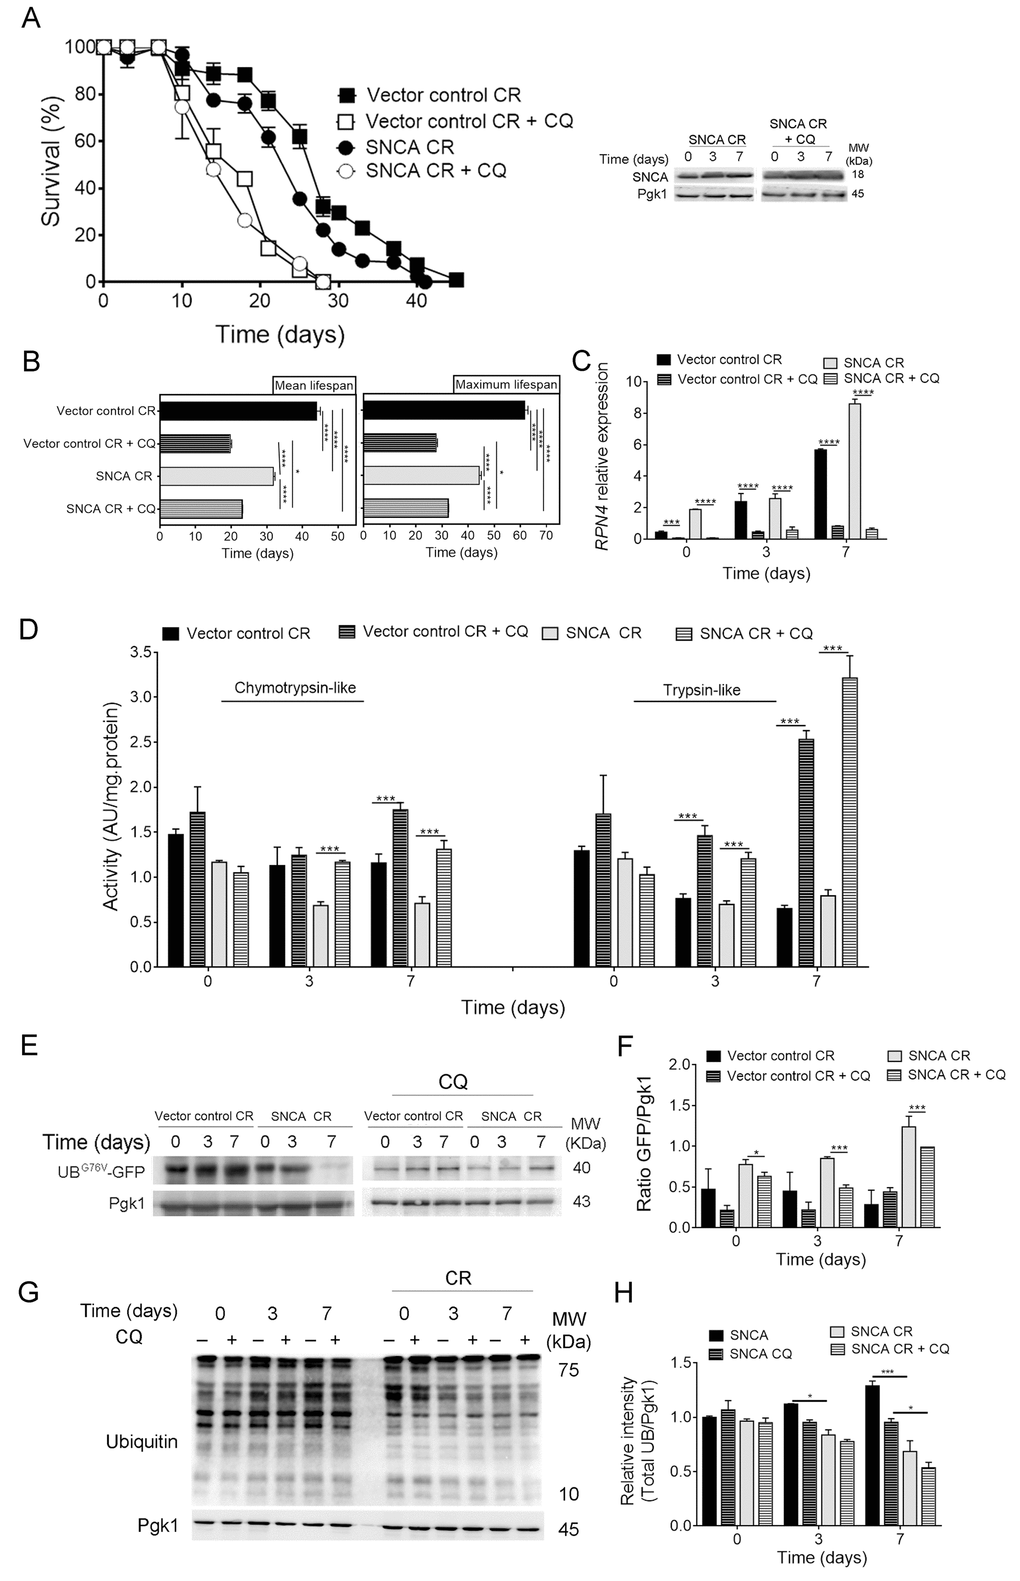
Figure 2. Autophagy inhibition leads to upregulation of the ubiquitin-proteasome system activity in α-synuclein (SNCA)-expressing cells under caloric restriction. (A) Chronological lifespan (CLS) and SNCA levels of SNCA-expressing stationary wild type cells, under caloric restriction (CR, 0.5% glucose) conditions, in the presence or absence of chloroquine (CQ), an inhibitor of autophagy. (B) Mean (50% survival) and maximum (10% survival) lifespans determined from curve fitting of the survival data from CLS. Significance was determined by two-way ANOVA (*p≤0.05, ****p≤0.0001) between cells grown under CR conditions expressing vector control or SNCA in the presence or absence of CQ. (C) RPN4 mRNA relative expression levels as described in the legend of Figure 1. (D) Chymotrypsin- and trypsin like activities. The assay was normalized to the total protein amount. (E) UPS activity measured by monitoring the ubiquitin/proteasome-dependent proteolysis of the short-lived protein UBG76V-GFP. GFP was detected by Western blotting using a GFP-specific antibody. (F) Graphical representation of GFP/Pgk1 obtained by densitometric analysis. (G) Ubiquitination profile determined by Western blotting using an anti-mono and polyubiquitination antibody. (H) Graphical representation of the intensity of total UB/Pgk1 obtained by densitometric analysis. Statistical significance represented in (C), (D), (F) and (H) was determined by Student's t-test (*p≤0.05, ***p≤0.001, ****p≤0.0001) comparing caloric restricted vector control or SNCA-expressing cells in the presence or absence of CQ. Data represents mean ± SEM of at least three biological independent replicas. The error bars represent the standard error of the mean (SEM).
Ubiquitin-proteasome activity inhibition does not impact on autophagy of SNCA-expressing cells under caloric restriction
To further explore the crosstalk between autophagy and UPS in SNCA-expressing cells under CR conditions, UPS activity was pharmacological inhibited with two different proteasome inhibitors, bortezomib and MG132. The use of proteasome inhibitors in S. cerevisiae cells requires reduced drug efflux that is achieved by deletion of PDR5, a multidrug transporter involved in pleiotropic drug resistance [35]. Thus, pdr5Δ cells heterologous expressing SNCA were cultured under CR conditions and treated with proteasome inhibitors. The pharmacological inhibition of UPS activity was confirmed by the drastic reduction of chymotrypsin- and trypsin-like activities (Fig. 3A) and by the accumulation of UBG76V-GFP, promoted by bortezomib (Fig. 3C and 3D) and MG132 (data not shown), in SNCA-expressing cells under CR. The inhibition of UPS activity is also supported by the increased RPN4 mRNA levels (Fig. 3B).
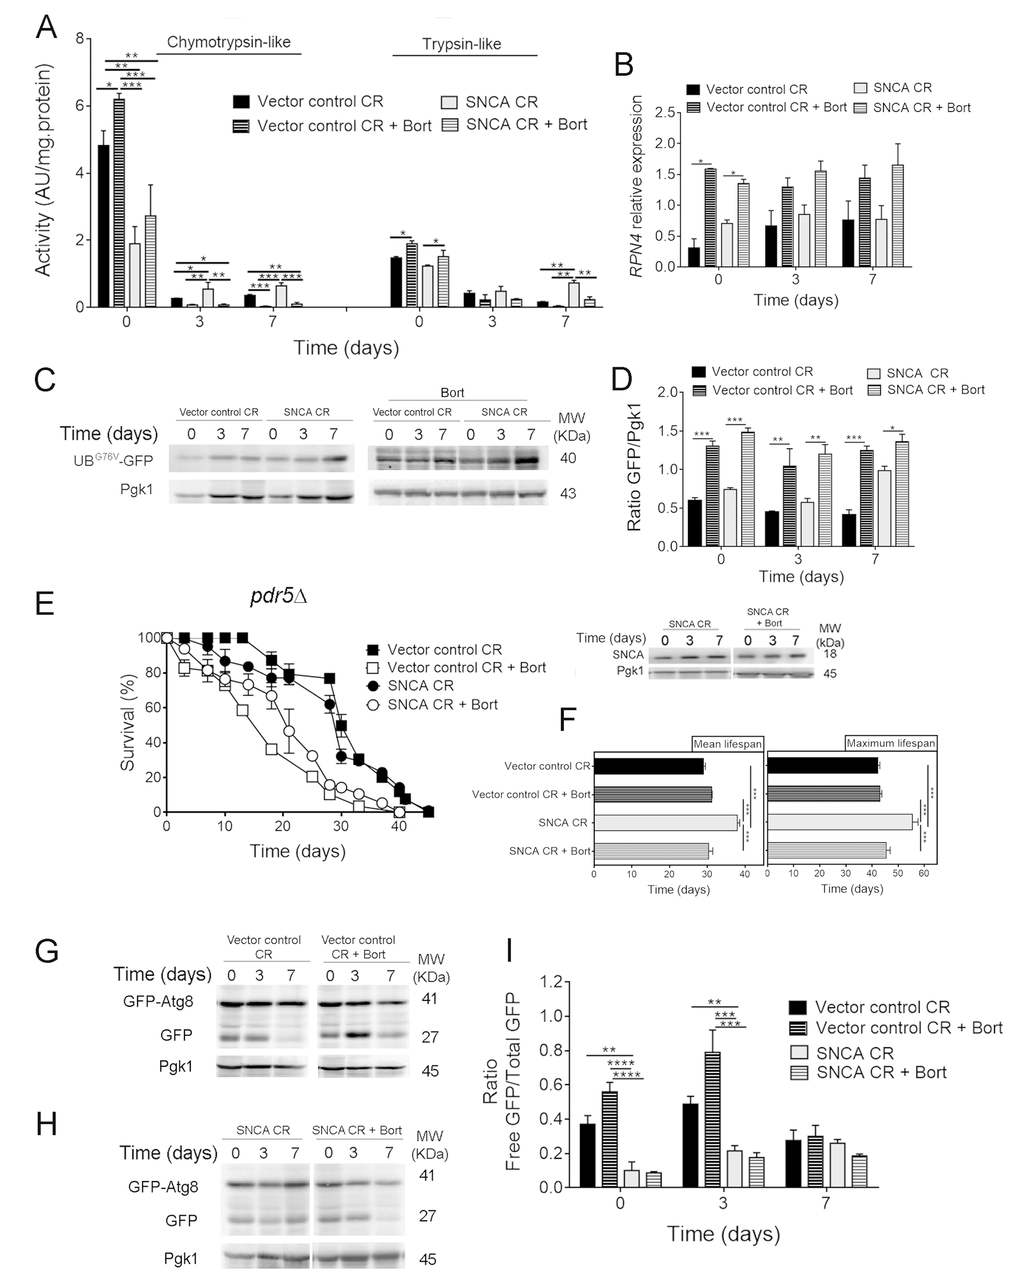
Figure 3. Pharmacological inhibition of the ubiquitin-proteasome system activity decreases lifespan of α-synuclein (SNCA)-expressing cells grown under caloric restriction but has no major impact on autophagy. (A) Chymotrypsin- and trypsin like activities. The assay was normalized to the total protein amount. Significance was determined by two-way ANOVA (*p≤0.05, **p≤0.01, ***p≤0.001) between cells grown under CR (0.5% glucose) conditions expressing vector control or SNCA in the presence or absence of bortezomib (Bort). (B) RPN4 mRNA relative expression levels as described in the legend of Figure 1. (C) UPS activity measured by monitoring the ubiquitin/proteasome-dependent proteolysis of the short-lived protein UBG76V-GFP. GFP was detected by Western blotting using a GFP-specific antibody. (D) Graphical representation of GFP/Pgk1 obtained by densitometric analysis. Statistical significance represented in (B) and (D) was determined by Student's t-test (*p≤0.05, **p≤0.01, ***p≤0.001) comparing caloric restricted vector control or SNCA-expressing cells in the presence or absence of Bort. (E) Chronological lifespan (CLS) and SNCA levels of pdr5Δ cells expressing SNCA grown under CR conditions, in the presence or absence of Bort. (F) Mean (50% survival) and maximum (10% survival) lifespans determined from curve fitting of the survival data from CLS. Significance was determined by two-way ANOVA (***p≤0.001) between cells grown under CR conditions expressing vector control or SNCA in the presence or absence of Bort. Autophagy flux assessed by the GFP-Atg8 processing assay (immunoblotting analysis with antibody against GFP) of caloric restricted cells expressing vector control (G) or SNCA (H) in the absence or presence of Bort. Blots represented in (G) are from the same gel, as in (H). (I) Densitometric analysis of the ratio between the free GFP versus the total GFP. Bands were quantified by Quantity One software. Significance of the data was determined by two-way ANOVA (**p≤0.01, ***p≤0.001, ****p≤0.0001) between cells grown under CR conditions expressing vector control or SNCA in the presence or absence of Bort. Data represents mean ± SEM of at least three biological independent replicas. The error bars represent the standard error of the mean (SEM).
Inhibition of UPS activity either with bortezomib (Fig. 3) or MG132 (data not shown) resulted in a shorter CLS, corresponding to decreased mean and maximum lifespans, of SNCA-expressing cells under CR conditions when compared to vector control expressing cells (Fig. 3E and 3F). These results indicate that UPS is also an important component of CR-mediated longevity. Autophagy was also evaluated in caloric restricted SNCA-expressing cells in the presence of proteasome inhibitors. Notably, the results obtained for autophagy, showed that proteasome inhibition has no major impact on autophagy flux in SNCA-expressing cells under CR conditions (Fig. 3G, 3H and 3I).
UPS activity was also genetically inhibited by deletion of UMP1 or RPN4. UMP1 deletion causes incorrect assembly of the 20S proteasome and reduced ubiquitin-mediated proteolysis [36], while RPN4 is a transcriptional regulator of the 26S proteasome [37]. Both mutants were confirmed to have impaired UPS activity (data not shown). The comparison of the mean and maximum lifespans of RPN4 and UMP1 cells expressing vector control or SNCA with the correspondent wild type cells revealed that genetic abrogation of UPS activity reduces CR-mediated extension of CLS (Fig. 4A and 4B). These results are in agreement with the observations made with pharmacological inhibition of UPS (Figure 3), pointing, once again, UPS as a relevant factor of CR-mediated longevity. Regarding autophagy, the results showed that genetic inhibition of UPS activity, by abrogation of RPN4 or UMP1, does not have a major impact on autophagy flux of caloric restricted cells expressing SNCA (Fig. 4C, 4D and 4E), as the pharmacological inhibition of UPS activity (Fig. 3).
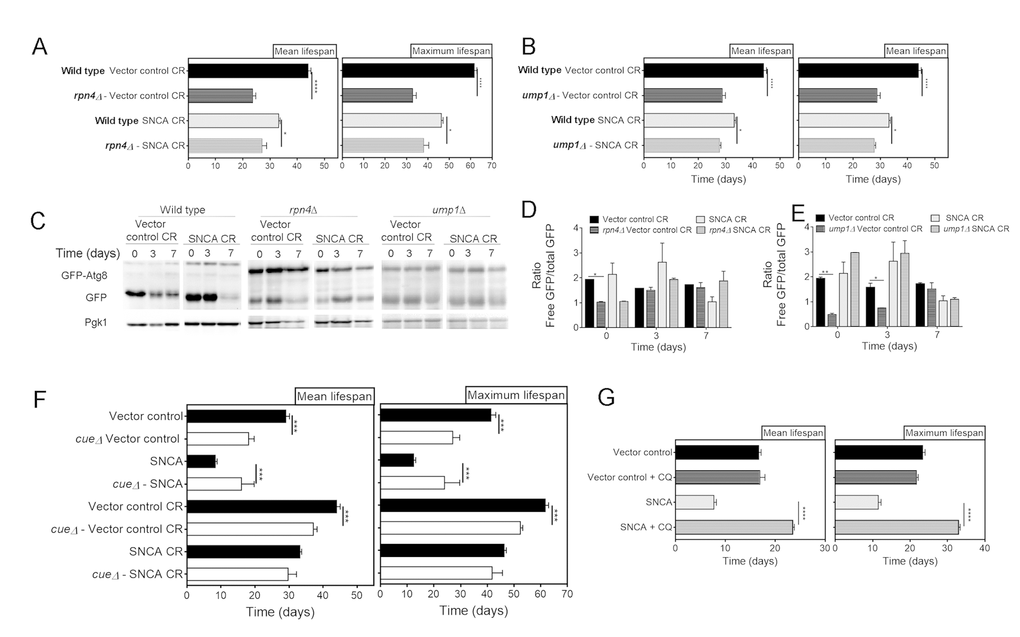
Figure 4. Genetic inhibition of the ubiquitin-proteasome system activity decreases lifespan of α-synuclein (SNCA)-expressing cells grown under caloric restriction conditions but has no major impact on autophagy. Mean (50% survival) and maximum (10% survival) lifespans determined from curve fitting of the survival data from CLS of caloric restricted vector control and SNCA expressing wild type cells compared with RPN4 (A) and UMP1 (B) deleted cells. (C) Autophagy flux assessed by the GFP-Atg8 processing assay (immunoblotting analysis with antibody against GFP) of wild type, rpn4Δ and ump1Δ caloric restricted cells expressing vector control or SNCA. Blots from same strain were run in the same gel. Densitometric analysis of the ratio between the free GFP versus the total GFP of rpn4Δ (D) and ump1Δ (E) cells. Data from wild type cells is repeated in (D) and (E) for easier interpretation. Bands were quantified by Quantity One software. (F) Mean and maximum lifespans determined from curve fitting of the survival data from CLS of wild type and cue5Δ cells expressing the vector control or SNCA in normal (2% glucose) or CR (0.5% glucose) growth conditions. (G) Mean and maximum lifespans determined from curve fitting of the survival data from CLS of wild type cells expressing the vector control or SNCA in the absence or presence of chloroquine (CQ). Significance was determined by Student's t-test (*p≤0.05, **p≤0.01, ***p≤0.001, ****p≤0.0001) comparing wild type with each mutant strain in the same conditions. For (G) the comparison was done between vector control or SNCA-expressing cells in the presence or absence of CQ. Data represents mean ± SEM of at least three biological independent replicas. The error bars represent the standard error of the mean (SEM).
Autophagy has an important role on the regulation of proteasome homeostasis by proteophagy, a mechanism dependent on the ubiquitin receptor Cue5, which recognizes inactivated ubiquitylated proteasomes [38]. To elucidate the role of proteophagy on the crosstalk between UPS and autophagy in caloric restricted SNCA-expressing cells, we have used CUE5 deleted cells. The CLS analysis of wild type and cue5Δ cells expressing SNCA revealed a significant increase of mean and maximum lifespans of cue5Δ cells (Fig. 4F). However, under CR conditions this effect was abrogate and no differences were observed between the mean and maximum lifespans of wild type and cue5Δ cells expressing SNCA (Fig. 4F). As previously described [38], cue5Δ cells display decreased autophagy flux (data not shown). The results obtained with cue5Δ and wild type cells treated with CQ and/or under CR conditions (Fig. 2, 4F and 4G), suggest that the maintenance of autophagy at homeostatic levels, both in normal growth or CR conditions, is beneficial for UPS activity and reduces SNCA toxicity.
Discussion
Maintenance of proteostasis and “cleansing” of misfolded proteins is mainly promoted by two proteolytic systems: the ubiquitin-proteasome system (UPS) and lysosomal degradation pathways, particularly autophagy. During aging, both systems are target of extensive alterations culminating in loss of proteostasis that is further potentiated by the accumulation of proteins prone to aggregation such as SNCA [18].
Caloric restriction (CR) is a powerful non-genetic manipulation known to extend lifespan in a number of aging models and is also known to delay or rescue toxicity in synucleinopathies models [19-25]. In spite of the recognized role of the UPS and autophagy proteolytic systems in the beneficial effects of CR, the crosstalk between them remains poorly understood. The data presented herein investigated this crosstalk by individually inhibiting both proteolytic systems in an aging cellular model for synucleinopathies. The results obtained indicate that CR-promoted beneficial effects on aged SNCA-expressing cells are dependent on both UPS and autophagy, in agreement with previous observations in other aging models [27-29,39,40]. The dependency of CR-mediated longevity on proteolytic systems is confirmed by data showing a shorter chronological lifespan when each of these proteolytic systems, UPS and autophagy, is inhibited. Importantly, crosstalk and coordinated regulation of UPS and autophagy are observed when autophagy is pharmacologically inhibited resulting in an increase of UPS functioning. Autophagy inhibition and CR-mediated enhancement of UPS in SNCA-expressing cells are associated with an increase of both chymotrypsin- and trypsin-like activities, while in the literature, a central role in the protein degradation by proteasome is assigned mainly to chymotrypsin-like activity [41,42].
The coordinated regulation of UPS and autophagy seems to be required for protein homeostasis and consequently longevity extension [33,43,44]. The results presented show that pharmacological or genetic inhibition of proteosome in SNCA-expressing cells under CR was not compensated with enhancement of autophagy. This observation seems to contradict the literature showing that autophagy is stimulated to compensate for UPS inhibition [33,43,44]. In stationary phase yeast cells, proteasomes, mainly localized in the nucleus, are translocated to cytosol forming protective proteasome storage granules (PSGs) [45-49]. In yeast PSGs protect proteasomes from autophagic degradation upon carbon starvation [50]. During chronological aging, yeast cells expressing SNCA experience carbon starvation and also an impairment of UPS activity (Fig. 1). Thus, although dysfunctional proteasomes could be degraded by proteophagy [38], degradation is affected because chronological aged cells lack carbon source and thus form PSGs. Our results herein presented show that deletion of the proteophagy selective receptor CUE5 protects SNCA-expressing cells increasing CLS (Fig. 4F). In addition, CR does not have any effect on the CLS of cue5Δ cells expressing SNCA (Fig. 4F). Adding to these findings our previous observations on the impairment of UPS and the drastic increase of autophagy in aged SNCA-expressing cells [34], it is tempting to speculate that the protective effects of CR on SNCA-expressing cells are partially dependent on the inhibition of proteophagy and early protective formation of PSGs. This hypothesis needs further investigations.
Overall, our data suggest that in proteotoxic stress conditions, the CR-mediated beneficial effects are associated with increased UPS activity accompanied by the maintenance of autophagy at homeostatic levels. Furthermore, although under CR conditions inhibition of each proteolytic activity leads to reduced longevity, the maintenance of autophagy at homeostatic levels appears to be the central pathway underlying rescue from SNCA-mediated toxicity.
Materials and Methods
Strains and media
The yeast strains and plasmids used in this study are listed in Table 1. Cell stocks were maintained in YEPD agar medium containing 0.5% yeast extract, 1% peptone, 2% agar, and 2% glucose. All experiments were performed in synthetic complete (SC) medium containing glucose as a carbon source and 0.67% yeast nitrogen base without amino acids (Difco Laboratories) supplemented with excess amino acids and bases for which the strains were auxotrophic (50 μg/mL histidine, 50 μg/mL lysine, 100 μg/mL methionine, 300 μg/mL leucine and 100 μg/mL uracil).
Table 1. Strains and plasmids used in this study.
| Yeast Strain | Genotype | ||
| BY4741 | MATa his3Δ1 lys2Δ0 met15Δ0 ura3Δ0 | ||
|---|---|---|---|
| BY4741 pdr5Δ | MATa his3D1 leu2D0 met15D0 ura3D0 pdr5::kanMX4 | ||
| BY4741 ump1Δ | MATa his3D1 leu2D0 met15D0 ura3D0 ump1::kanMX4 | ||
| BY4741 rpn4Δ | MATa his3D1 leu2D0 met15D0 ura3D0 rpn4::kanMX4 | ||
| BY4741 cue5Δ | MATa his3D1 leu2D0 met15D0 ura3D0 cue5::kanMX4 | ||
| Plasmids | Type of Plasmid | Source | |
| pYX222-SNCA | 2µ | [34] | |
| pRS416-GFPAtg8 | 2µ | [21] | |
| pYES2-Ub-G76V-GFP | 2µ | Addgene | |
Chronological lifespan assays
To perform the chronological lifespan (CLS) assays cells were grown on synthetic liquid media with 2% and 0.5% glucose for regular media and caloric restriction conditions, respectively. Overnight cultures were grown in SC medium containing the two different concentrations of glucose and then inoculated into flasks containing medium with the same concentration of glucose at a volume ratio of 1:3. These cultures were then incubated at 26 °C with shaking at 150 rpm. Cultures reached stationary phase 2-3 days later, and this was considered day 0 of CLS. Survival was assessed by counting colony-forming units (CFUs) after 2 days of incubation of culture aliquots at 26 °C on YEPD agar plates beginning at day 0 of CLS (when viability was considered to be 100%) and then again, every 2-3 days until less than 0.01% of the cells in the culture were viable.
Mean (50% survival) and maximum (10% survival) lifespans were determined from curve fitting of the survival data (from pair-matched, pooled experiments) with the statistical software Prism (GraphPad Software).
To block autophagy, 50 µg/µl chloroquine (CQ), or to inhibit UPS activity, 30 µM bortezomib or 50 µM MG132, were added to the culture medium at day 0 of CLS.
Total protein extraction and western blotting
For detection of protein levels by western blot, total cellular extracts were collected at specific time points and extracted as previously described [51]. Briefly, cells were pre-treated with 2 M lithium acetate for 5 min at room temperature. After lithium acetate removal, 0.4 M NaOH were added for 5 min on ice. Next, the cells were resuspended in SDS-PAGE sample buffer and boiled for 5 min. Total protein quantification was performed with the RC DC protein assay (Bio-Rad) and processed according to the manufacturer’s instructions. Of total protein, 20 μg were resolved on a 12% SDS gel and transferred to a nitrocellulose membrane during 7 min at 25V in Trans-Blot Turbo transfer system. Membranes were blocked with tris buffered saline (TBS) with 0.1% Tween 20 (TBST) containing 5% skim milk, followed by incubation with primary antibodies against: anti-SNCA (1:1000, Sigma); anti-GFP (1:5000; Abcam), anti-mono and polyubiquitination conjugated (1:1000; Enzo) and anti-PGK (1:5000; Invitrogen) in TBST containing 1% BSA and primary antibody. After washing with TBS, the membranes were incubated with the respective secondary antibody, HRP-conjugated anti-rabbit IgG, anti-mouse IgG or anti-goat IgG at a dilution of 1:5000 in 1% skim milk. Protein levels were detected after incubation with SuperSignal West Femto Maximum Sensitivity Substrate (Thermo Scientific) or Clarity Western ECL Substrate (Bio-Rad). Digital images of the western blotting were obtained in a ChemiDoc XRS System (Bio-Rad) with Quantity One (Bio-Rad) software.
mRNA expression analysis by qRT-PCR
The quantitative mRNA expression analysis was performed according to the MIQE guidelines (Minimum information for publication of quantitative real-time PCR Experiments [52]). Briefly, quantitative real-time PCR (qPCR) was used to measure the mRNA transcripts of the RPN4 gene (FW: AAGGAAACCAGCAAAATCATC; RV: TTTCTAATGTGCCGTTTTCAT) and RPN5 gene (FW: TGGCATTTGGTGGAGAAGCT; RV: ATGTTTCCGTCTGGCTCTCC as described in [38]). Three reference genes (ACT1-actin (FW: GATCATTGCTCCTCCAGAA; RV: ACTTGTGGTGAACGATAGAT), PDA1-alpha subunit of pyruvate dehydrogenase (FW: TGACGAACAAGTTGAATTAGC; RV: TCTTAGGGTTGGAGTTTCTG) and TDH2-isoform 2 of glyceraldehyde-3-phosphate dehydrogenase (FW: CCGCTGAAGGTAAGTTGA; RV: CGAAGATGGAAGAGTTAGAGT)) were selected due to their stable expression and were tested in same experimental conditions allowing expression normalization.
Yeast samples for qPCR quantification were centrifuged (4,500 rpm, 4°C, 5 min) and the pellets were immediately stored at -80°C until RNA extraction. The RNA extraction was carried out as previously described [52]. The RNA quality was assessed by agarose gel electrophoresis. Total RNA (300 ng) was reverse-transcribed into cDNA in a 20 μL reaction mixture using the iScript cDNA synthesis kit. Then, 22.5 ng of cDNA of each sample was tested in duplicate in a 96-well plate (Bio-Rad), in a 20 μL reaction mixture using the SsoFast Evagreen Supermix kit (Bio-Rad) and processed according to the manufacturer’s instructions in a CFX96™ Real Time System (Bio-Rad). A blank (no template control) was also incorporated in each assay. The thermocycling program consisted of one hold at 95°C for 1 min, followed by 39 cycles of 15 min at 95°C, 20 s at 57°C and 20 s at 72°C. After completion of these cycles, melting-curve data were collected to verify PCR specificity, contamination and the absence of primer dimers. The PCR efficiency of each primer pair was evaluated by the dilution series method using a mix of sample cDNAs as the template and was determined from calibration curves using the formula 10(-1/slope). Relative expression levels were determined with efficiency correction, which considers differences in the efficiencies between target and reference genes, using the gene expression module of the CFX manager Software (Bio-Rad).
Proteasome catalytic activity
“Proteasome-Glo TM Cell-Based Assays” (Promega) was used to measure the proteolytic activity of the UPS. This luminescent assay measures the chymotrypsin- and trypsin-like activities associated with the proteasome. Proteasome-Glo Cell-Based Reagents were both prepared and equilibrated at 22°C for 30 min before use. The luminescence was measured in a luminometer “Fluoroskan Ascent FL” by ThermoScientific. About 1x10⁶ cells were plated in a 96-well opaque plate at a volume of 100 µl together with “Proteasom-Glo TM Cell-Based Assays” (100 µl). The assay plates were equilibrated at 22 °C, and after incubation during 5 to 30 min, a luminescent signal was obtained. Protein concentration was used to normalize proteasome activity.
Monitoring autophagy by GFP-Atg8 processing assay
To perform this assay, cells were transformed with the plasmid pRS416-GFPAtg8 with fusion gene under the control of the ATG8 endogenous promoter [53,54]. GFP N-terminally tagged to Atg8 is delivered to the vacuole and as GFP is more resistant to degradation than Atg8, bulk autophagy results in the accumulation of free GFP in the vacuole. The ratio between free GFP and total GFP is used as a readout for the autophagic flux. GFP-Atg8 and free GFP are detectable by Western blotting using a GFP-specific antibody (see section Total protein extraction and western blotting). The ratio between free GFP and total GFP is used as a readout for the autophagic flux. Immunoblot bands were quantified by densitometric analysis using the Quantity One software.
Statistical treatment of data
The results shown are mean values and standard error of the mean of at least three independent assays. Statistical analyses were determined using two-way ANOVA or Student's t-test as indicated in the figure legends. A p-value of less than 0.05 was considered as a significant difference.
Acknowledgements
BSM and HP are supported by fellowships from the Fundação para a Ciência e Tecnologia (FCT, Portugal) (SFRH/BPD/90533/2012 and SFRH/BD/133087/2017, respectively).
Conflicts of Interest
The authors report no conflicts of interest in this work.
Funding
This work was developed under the scope of the project NORTE-01-0145-FEDER-000013, supported by the Northern Portugal Regional Operational Programme (NORTE 2020), under the Portugal 2020 Partnership Agreement, through the European Regional Development Fund (FEDER).
References
- 1. Lashuel HA, Overk CR, Oueslati A, Masliah E. The many faces of α-synuclein: from structure and toxicity to therapeutic target. Nat Rev Neurosci. 2013; 14:38–48. https://doi.org/10.1038/nrn3406 [PubMed]
- 2. Jackson MP, Hewitt EW. Cellular proteostasis: degradation of misfolded proteins by lysosomes. Essays Biochem. 2016; 60:173–80. https://doi.org/10.1042/EBC20160005 [PubMed]
- 3. Ebrahimi-Fakhari D, Cantuti-Castelvetri I, Fan Z, Rockenstein E, Masliah E, Hyman BT, McLean PJ, Unni VK. Distinct roles in vivo for the ubiquitin-proteasome system and the autophagy-lysosomal pathway in the degradation of α-synuclein. J Neurosci. 2011; 31:14508–20. https://doi.org/10.1523/JNEUROSCI.1560-11.2011 [PubMed]
- 4. Xilouri M, Brekk OR, Stefanis L. α-Synuclein and protein degradation systems: a reciprocal relationship. Mol Neurobiol. 2013; 47:537–51. https://doi.org/10.1007/s12035-012-8341-2 [PubMed]
- 5. Fussi N, Höllerhage M, Chakroun T, Nykänen NP, Rösler TW, Koeglsperger T, Wurst W, Behrends C, Höglinger GU. Exosomal secretion of α-synuclein as protective mechanism after upstream blockage of macroautophagy. Cell Death Dis. 2018; 9:757. https://doi.org/10.1038/s41419-018-0816-2 [PubMed]
- 6. Webb JL, Ravikumar B, Atkins J, Skepper JN, Rubinsztein DC. Alpha-Synuclein is degraded by both autophagy and the proteasome. J Biol Chem. 2003; 278:25009–13. https://doi.org/10.1074/jbc.M300227200 [PubMed]
- 7. Zabrocki P, Pellens K, Vanhelmont T, Vandebroek T, Griffioen G, Wera S, Van Leuven F, Winderickx J. Characterization of alpha-synuclein aggregation and synergistic toxicity with protein tau in yeast. FEBS J. 2005; 272:1386–400. https://doi.org/10.1111/j.1742-4658.2005.04571.x [PubMed]
- 8. Lee IH, Kim HY, Kim M, Hahn JS, Paik SR. Dequalinium-induced cell death of yeast expressing alpha-synuclein-GFP fusion protein. Neurochem Res. 2008; 33:1393–400. https://doi.org/10.1007/s11064-008-9598-8 [PubMed]
- 9. Sharma N, Brandis KA, Herrera SK, Johnson BE, Vaidya T, Shrestha R, Debburman SK. alpha-Synuclein budding yeast model: toxicity enhanced by impaired proteasome and oxidative stress. J Mol Neurosci. 2006; 28:161–78. https://doi.org/10.1385/JMN:28:2:161 [PubMed]
- 10. Petroi D, Popova B, Taheri-Talesh N, Irniger S, Shahpasandzadeh H, Zweckstetter M, Outeiro TF, Braus GH. Aggregate clearance of α-synuclein in Saccharomyces cerevisiae depends more on autophagosome and vacuole function than on the proteasome. J Biol Chem. 2012; 287:27567–79. https://doi.org/10.1074/jbc.M112.361865 [PubMed]
- 11. Tenreiro S, Reimão-Pinto MM, Antas P, Rino J, Wawrzycka D, Macedo D, Rosado-Ramos R, Amen T, Waiss M, Magalhães F, Gomes A, Santos CN, Kaganovich D, Outeiro TF. Phosphorylation modulates clearance of alpha-synuclein inclusions in a yeast model of Parkinson’s disease. PLoS Genet. 2014; 10:e1004302. https://doi.org/10.1371/journal.pgen.1004302 [PubMed]
- 12. Sampaio-Marques B, Ludovico P. Sirtuins and proteolytic systems: implications for pathogenesis of synucleinopathies. Biomolecules. 2015; 5:735–57. https://doi.org/10.3390/biom5020735 [PubMed]
- 13. Chu CT. Diversity in the regulation of autophagy and mitophagy: lessons from Parkinson’s disease. Parkinsons Dis. 2011; 2011:789431. https://doi.org/10.4061/2011/789431 [PubMed]
- 14. Lim KL, Tan JM. Role of the ubiquitin proteasome system in Parkinson’s disease. BMC Biochem. 2007 (Suppl 1); 8:S13. https://doi.org/10.1186/1471-2091-8-S1-S13 [PubMed]
- 15. Ebrahimi-Fakhari D, McLean PJ, Unni VK. Alpha-synuclein’s degradation in vivo: opening a new (cranial) window on the roles of degradation pathways in Parkinson disease. Autophagy. 2012; 8:281–83. https://doi.org/10.4161/auto.8.2.18938 [PubMed]
- 16. Ebrahimi-Fakhari D, Wahlster L, McLean PJ. Protein degradation pathways in Parkinson’s disease: curse or blessing. Acta Neuropathol. 2012; 124:153–72. https://doi.org/10.1007/s00401-012-1004-6 [PubMed]
- 17. Stefanis L, Larsen KE, Rideout HJ, Sulzer D, Greene LA. Expression of A53T mutant but not wild-type alpha-synuclein in PC12 cells induces alterations of the ubiquitin-dependent degradation system, loss of dopamine release, and autophagic cell death. J Neurosci. 2001; 21:9549–60. https://doi.org/10.1523/JNEUROSCI.21-24-09549.2001 [PubMed]
- 18. Ott C, Grune T. Protein oxidation and proteolytic signalling in aging. Curr Pharm Des. 2014; 20:3040–51. https://doi.org/10.2174/13816128113196660709 [PubMed]
- 19. Fontana L, Partridge L. Promoting health and longevity through diet: from model organisms to humans. Cell. 2015; 161:106–18. https://doi.org/10.1016/j.cell.2015.02.020 [PubMed]
- 20. Duan W, Mattson MP. Dietary restriction and 2-deoxyglucose administration improve behavioral outcome and reduce degeneration of dopaminergic neurons in models of Parkinson’s disease. J Neurosci Res. 1999; 57:195–206. https://doi.org/10.1002/(SICI)1097-4547(19990715)57:2<195::AID-JNR5>3.0.CO;2-P [PubMed]
- 21. Guedes A, Ludovico P, Sampaio-Marques B. Caloric restriction alleviates alpha-synuclein toxicity in aged yeast cells by controlling the opposite roles of Tor1 and Sir2 on autophagy. Mech Ageing Dev. 2017. 161:270–76. https://doi.org/10.1016/j.mad.2016.04.006 [PubMed]
- 22. Jadiya P, Chatterjee M, Sammi SR, Kaur S, Palit G, Nazir A. Sir-2.1 modulates ‘calorie-restriction-mediated’ prevention of neurodegeneration in Caenorhabditis elegans: implications for Parkinson’s disease. Biochem Biophys Res Commun. 2011; 413:306–10. https://doi.org/10.1016/j.bbrc.2011.08.092 [PubMed]
- 23. Maswood N, Young J, Tilmont E, Zhang Z, Gash DM, Gerhardt GA, Grondin R, Roth GS, Mattison J, Lane MA, Carson RE, Cohen RM, Mouton PR, et al. Caloric restriction increases neurotrophic factor levels and attenuates neurochemical and behavioral deficits in a primate model of Parkinson’s disease. Proc Natl Acad Sci USA. 2004; 101:18171–76. https://doi.org/10.1073/pnas.0405831102 [PubMed]
- 24. Mladenovic A, Perovic M, Tanic N, Petanceska S, Ruzdijic S, Kanazir S. Dietary restriction modulates alpha-synuclein expression in the aging rat cortex and hippocampus. Synapse. 2007; 61:790–94. https://doi.org/10.1002/syn.20427 [PubMed]
- 25. Vartiainen S, Aarnio V, Lakso M, Wong G. Increased lifespan in transgenic Caenorhabditis elegans overexpressing human alpha-synuclein. Exp Gerontol. 2006; 41:871–76. https://doi.org/10.1016/j.exger.2006.05.005 [PubMed]
- 26. Klaips CL, Jayaraj GG, Hartl FU. Pathways of cellular proteostasis in aging and disease. J Cell Biol. 2018; 217:51–63. https://doi.org/10.1083/jcb.201709072 [PubMed]
- 27. da Cunha FM, Demasi M, Kowaltowski AJ. Aging and calorie restriction modulate yeast redox state, oxidized protein removal, and the ubiquitin-proteasome system. Free Radic Biol Med. 2011; 51:664–70. https://doi.org/10.1016/j.freeradbiomed.2011.05.035 [PubMed]
- 28. Lee CK, Klopp RG, Weindruch R, Prolla TA. Gene expression profile of aging and its retardation by caloric restriction. Science. 1999; 285:1390–93. https://doi.org/10.1126/science.285.5432.1390 [PubMed]
- 29. Carrano AC, Liu Z, Dillin A, Hunter T. A conserved ubiquitination pathway determines longevity in response to diet restriction. Nature. 2009; 460:396–99. https://doi.org/10.1038/nature08130 [PubMed]
- 30. Karpov DS, Osipov SA, Preobrazhenskaia OV, Karpov VL. Rpn4p is a positive and negative transcriptional regulator of the ubiquitin-proteasome system. Mol Biol (Mosk). 2008; 42:518–25. [PubMed]
- 31. Chen Q, Thorpe J, Keller JN. Alpha-synuclein alters proteasome function, protein synthesis, and stationary phase viability. J Biol Chem. 2005; 280:30009–17. https://doi.org/10.1074/jbc.M501308200 [PubMed]
- 32. Nam T, Han JH, Devkota S, Lee HW. Emerging Paradigm of Crosstalk between Autophagy and the Ubiquitin-Proteasome System. Mol Cells. 2017; 40:897–905. https://doi.org/10.14348/molcells.2017.0226 [PubMed]
- 33. Pandey UB, Nie Z, Batlevi Y, McCray BA, Ritson GP, Nedelsky NB, Schwartz SL, DiProspero NA, Knight MA, Schuldiner O, Padmanabhan R, Hild M, Berry DL, et al. HDAC6 rescues neurodegeneration and provides an essential link between autophagy and the UPS. Nature. 2007; 447:859–63. https://doi.org/10.1038/nature05853 [PubMed]
- 34. Sampaio-Marques B, Felgueiras C, Silva A, Rodrigues M, Tenreiro S, Franssens V, Reichert AS, Outeiro TF, Winderickx J, Ludovico P. SNCA (α-synuclein)-induced toxicity in yeast cells is dependent on sirtuin 2 (Sir2)-mediated mitophagy. Autophagy. 2012; 8:1494–509. https://doi.org/10.4161/auto.21275 [PubMed]
- 35. Collins GA, Gomez TA, Deshaies RJ, Tansey WP. Combined chemical and genetic approach to inhibit proteolysis by the proteasome. Yeast. 2010; 27:965–74. https://doi.org/10.1002/yea.1805 [PubMed]
- 36. Ramos PC, Höckendorff J, Johnson ES, Varshavsky A, Dohmen RJ. Ump1p is required for proper maturation of the 20S proteasome and becomes its substrate upon completion of the assembly. Cell. 1998; 92:489–99. https://doi.org/10.1016/S0092-8674(00)80942-3 [PubMed]
- 37. Xie Y, Varshavsky A. RPN4 is a ligand, substrate, and transcriptional regulator of the 26S proteasome: a negative feedback circuit. Proc Natl Acad Sci USA. 2001; 98:3056–61. https://doi.org/10.1073/pnas.071022298 [PubMed]
- 38. Marshall RS, McLoughlin F, Vierstra RD. Autophagic Turnover of Inactive 26S Proteasomes in Yeast Is Directed by the Ubiquitin Receptor Cue5 and the Hsp42 Chaperone. Cell Reports. 2016; 16:1717–32. https://doi.org/10.1016/j.celrep.2016.07.015 [PubMed]
- 39. Jia K, Levine B. Autophagy is required for dietary restriction-mediated life span extension in C. elegans. Autophagy. 2007; 3:597–99. https://doi.org/10.4161/auto.4989 [PubMed]
- 40. Madeo F, Zimmermann A, Maiuri MC, Kroemer G. Essential role for autophagy in life span extension. J Clin Invest. 2015; 125:85–93. https://doi.org/10.1172/JCI73946 [PubMed]
- 41. Chen P, Hochstrasser M. Autocatalytic subunit processing couples active site formation in the 20S proteasome to completion of assembly. Cell. 1996; 86:961–72. https://doi.org/10.1016/S0092-8674(00)80171-3 [PubMed]
- 42. Heinemeyer W, Fischer M, Krimmer T, Stachon U, Wolf DH. The active sites of the eukaryotic 20 S proteasome and their involvement in subunit precursor processing. J Biol Chem. 1997; 272:25200–09. https://doi.org/10.1074/jbc.272.40.25200 [PubMed]
- 43. Milani M, Rzymski T, Mellor HR, Pike L, Bottini A, Generali D, Harris AL. The role of ATF4 stabilization and autophagy in resistance of breast cancer cells treated with Bortezomib. Cancer Res. 2009; 69:4415–23. https://doi.org/10.1158/0008-5472.CAN-08-2839 [PubMed]
- 44. Wu WK, Cho CH, Lee CW, Wu YC, Yu L, Li ZJ, Wong CC, Li HT, Zhang L, Ren SX, Che CT, Wu K, Fan D, et al. Macroautophagy and ERK phosphorylation counteract the antiproliferative effect of proteasome inhibitor in gastric cancer cells. Autophagy. 2010; 6:228–38. https://doi.org/10.4161/auto.6.2.11042 [PubMed]
- 45. Laporte D, Salin B, Daignan-Fornier B, Sagot I. Reversible cytoplasmic localization of the proteasome in quiescent yeast cells. J Cell Biol. 2008; 181:737–45. https://doi.org/10.1083/jcb.200711154 [PubMed]
- 46. Chowdhury M, Enenkel C. Intracellular Dynamics of the Ubiquitin-Proteasome-System. F1000 Res. 2015; 4:367. https://doi.org/10.12688/f1000research.6835.1 [PubMed]
- 47. Lee HY, Cheng KY, Chao JC, Leu JY. Differentiated cytoplasmic granule formation in quiescent and non-quiescent cells upon chronological aging. Microb Cell. 2016; 3:109–19. https://doi.org/10.15698/mic2016.03.484 [PubMed]
- 48. Yedidi RS, Fatehi AK, Enenkel C. Proteasome dynamics between proliferation and quiescence stages of Saccharomyces cerevisiae. Crit Rev Biochem Mol Biol. 2016; 51:497–512. https://doi.org/10.1080/10409238.2016.1230087 [PubMed]
- 49. Gu ZC, Wu E, Sailer C, Jando J, Styles E, Eisenkolb I, Kuschel M, Bitschar K, Wang X, Huang L, Vissa A, Yip CM, Yedidi RS, et al. Ubiquitin orchestrates proteasome dynamics between proliferation and quiescence in yeast. Mol Biol Cell. 2017; 28:2479–91. https://doi.org/10.1091/mbc.e17-03-0162 [PubMed]
- 50. Marshall RS, Vierstra RD. Proteasome storage granules protect proteasomes from autophagic degradation upon carbon starvation. eLife. 2018; 7:7. https://doi.org/10.7554/eLife.34532 [PubMed]
- 51. Zhang T, Lei J, Yang H, Xu K, Wang R, Zhang Z. An improved method for whole protein extraction from yeast Saccharomyces cerevisiae. Yeast. 2011; 28:795–98. https://doi.org/10.1002/yea.1905 [PubMed]
- 52. Bustin SA, Benes V, Garson JA, Hellemans J, Huggett J, Kubista M, Mueller R, Nolan T, Pfaffl MW, Shipley GL, Vandesompele J, Wittwer CT. The MIQE guidelines: minimum information for publication of quantitative real-time PCR experiments. Clin Chem. 2009; 55:611–22. https://doi.org/10.1373/clinchem.2008.112797 [PubMed]
- 53. Cheong H, Klionsky DJ. Biochemical methods to monitor autophagy-related processes in yeast. Methods Enzymol. 2008; 451:1–26. https://doi.org/10.1016/S0076-6879(08)03201-1 [PubMed]
- 54. Klionsky DJ, Abdelmohsen K, Abe A, Abedin MJ, Abeliovich H, Acevedo Arozena A, Adachi H, Adams CM, Adams PD, Adeli K, Adhihetty PJ, Adler SG, Agam G, et al. Guidelines for the use and interpretation of assays for monitoring autophagy (3rd edition). Autophagy. 2016; 12: 1-222.