


Introduction
Calorie restriction (CR) is a feeding regimen that increases longevity in organisms from yeast to primates [1]. The mechanisms of CR are not well known: multiple physiological and metabolic changes induced by CR have been reported and several signaling pathways are proposed mediators of CR effects. CR inhibits the activity of the mechanistic target of rapamycin (mTOR) [2,3]. mTOR is a kinase, which operates as two distinct complexes with different downstream targets and physiological functions, mTORC1 and mTORC2 [4,5]. Genetic or pharmacological inhibition of mTORC1 signaling leads to increased lifespan. It was proposed that high activity of mTORC1 is a major driving force of aging, while the suppression of mTOR contributes to many benefits of CR, including lifespan extension [6]. The suppression of mTORC1 activity by CR was demonstrated in several model organisms such as yeast, nematodes and flies, at the same time, studies conducted in mammals have not yet arrived at a consensus. Some observed suppression of mTORC1 signaling upon CR [7], while others detected no suppression and even induction in mTORC1 activity [8]. mTORC2 is also implicated in the control of aging, however, much less is known about its exact role in aging and the effect of CR on mTORC2 activity.
The activity of mTORC1 and mTORC2 is regulated by nutrients, hormones and growth factors [4]. In mammals, mTORC1 activity increases after feeding and reduces during fasting. We and others have recently reported that the activity of mTORC1 significantly oscillates during the day, and that this activity might be under the control of internal circadian clocks [9–14], in turn mTORC1 regulates the circadian clock by phosphorylating clock transcriptional factor BMAL1 [15,16]. BMAL1 was also implicated in the control of mTORC2 activity [17]. Circadian clocks are a network of interconnected molecular oscillators that generate 24-hour rhythms in gene expression and cell signaling, which is ultimately translated into the rhythms in behavior and physiology [18]. These rhythms contribute to the synchronization of metabolic processes in organisms with a periodic environment. Interestingly, CR and biological clocks might be interconnected: CR affects circadian rhythms in behavior, chromatin modifications and gene expression, and some of circadian clock proteins are involved in the CR mechanism [13,19–23]. During the caloric restriction procedure in mammals, food is provided once per day, at the same time every day. Animals are subject to a relatively short feeding period (3-4 hours), during which all outside nutrients are received, followed by a fasting period during which stored resources are consumed. mTOR signaling is known to respond to feeding and fasting [4,5], therefore the time of feeding and the time of tissue collection affect the mTOR complexes activity, and it might be critical for the correct interpretation of CR effects on mTOR signaling. The present study assayed activity of mTORC1 and mTORC2 across a daily cycle in wild type and circadian clock mutant mice. We found, in agreement with our expectation, that the CR effects on mTOR signaling are time-of-day dependent and some clock proteins might be involved in the response of mTOR complexes to CR.
Results
CR regulates daily rhythms in mTORC1 activity in the liver
To assess the effect of CR on mTOR signaling, we compared daily rhythms mTORC1 and mTORC2 activities in the liver of mice that were subject to 30% CR for 2 months (CR group) with the activities in the liver of mice that had Ad Libitum (AL group) access to the food. CR mice received the food at ZT14 (two hours after light was off, ZT0 is the time when light is on and ZT12 is the time when light is off). We and others previously reported that feeding CR mice at ZT14 (or ZT12) did not significantly shift the phases of expression of core circadian clock genes [13,19–23] in the liver.
mTORC1 activity was assayed based on the phosphorylation of ribosomal protein S6 on S235/236 sites (S6 is not a direct target but it is often used as a surrogate marker of mTORC1 activity) [4,5] in the liver of wild type mice. First, we found significant variation in mTORC1 activity across the day for both AL and CR groups. As expected the activity was low during light phase the rest/fasting period and high during activity/feeding period (Figure 1A). The statistically significant effect of the diet on S6 phosphorylation was observed at ZT10, ZT14 (downregulation by CR) and ZT18 (upregulation by CR), at three other times the difference did not reach significance. Thus, we found that the effect of CR on mTORC1 activity depends on the time of the day. We also assayed the S6 phosphorylation in the liver of circadian mutant Bmal1-/- and Cry1,2-/- mice [24–26] under the same AL and CR conditions. For both mutant CR groups the levels of S6 phosphorylation were reduced during rest/fasting period similar to the effect of CR on wild type mice and it was induced at ZT14 in Cry1,2-/- mice but not in in Bmal1-/- mice. Thus, the circadian clock proteins BMAL1 and CRYs are not required for CR mediated down regulation of mTORC1 activity during rest/fasting period.
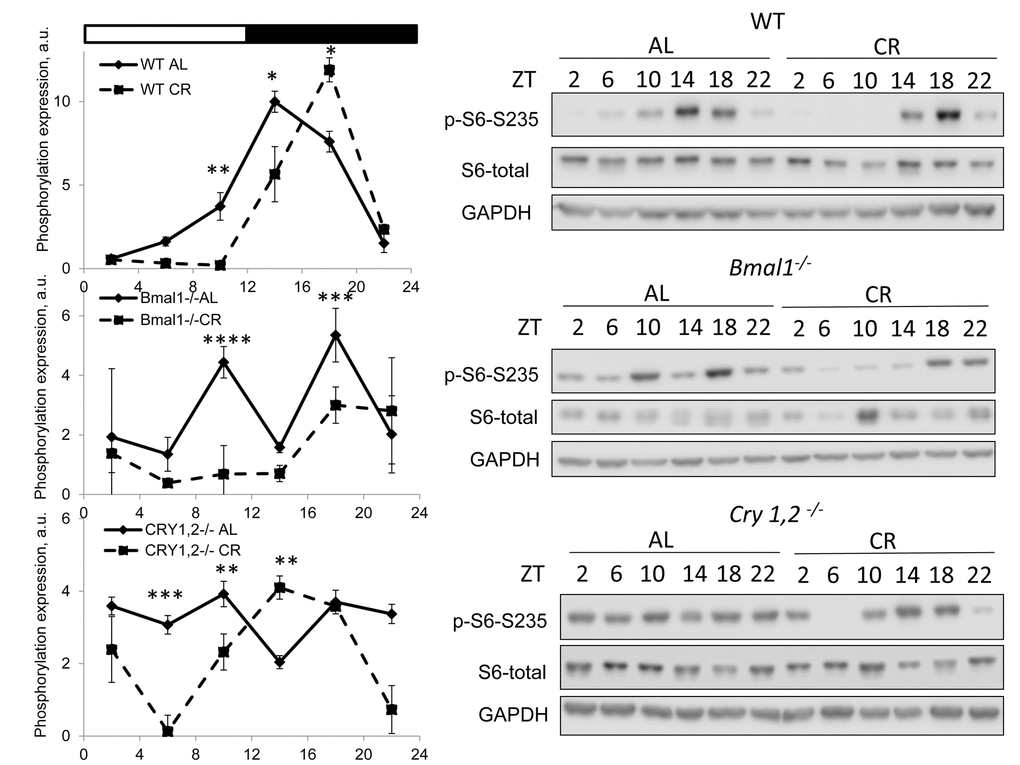
Figure 1. CR affects TORC1 activity across the day independently from BMAL1 and CRYs. Activity of mTORC1 in the liver of mice on AL and CR diets was assayed through phosphorylation of ribosomal protein S6 on Ser235/236. Representative WBs and quantification of diurnal rhythms in phosphorylation of S6 in wild type mice (upper panels), Bmal1-/- mice (middle panels) and Cry1,2-/- mice (lower panels). (AL) – black diamonds, black solid line, 30% caloric restriction (CR) – black squares and solid black lines. Two-way repeated ANOVA were used for statistical analysis, * - statistically significant difference (p<0.05) between diets (three male mice were used for every time point in both groups). Light and dark bars on the top of the figure represent light and dark phase of the day. ZT0 is the time when light is on and ZT12 is the time when light is off. Food for CR group was provided at ZT14. On the day of tissue collection at ZT14 tissues were harvested before mice received the food.
CR regulates daily rhythms in mTORC2 activity in the liver
We assayed mTORC2 activity through phosphorylation of its downstream target AKT on S473 [27]. Results are presented on Figure 2. Similar to the mTORC1, the activity of mTORC2 was different at different times on both diets. Phosphorylation of AKT-S473 was high in the liver of wild type mice at ZT14-18 for AL group and it was high at ZT14-22 and ZT6 for CR group. The difference between diets was significant at ZT22, the phosphorylation of AKT was higher in the liver of CR mice. Thus, CR affected the activities of mTORC1 and mTORC2 differently, by decreasing the mTORC1 activity at several times and increasing the mTORC2 activity in wild type mice. AKT phosphorylation also demonstrated strong daily fluctuation in the liver of AL Bmal1-/- mice with high level at ZT10-18. In contrast to the effect in wild type mice CR did not induce mTORC2 activity but resulted in significant reduction at ZT10-14. mTORC2 responded differently to CR in the liver Cry1,2-/- mice: the phosphorylation of AKT-S473 was reduced at ZT6/ZT10 and increased at ZT14/ZT18. Thus, circadian clock protein BMAL1 but not CRYs is important for the CR mediated induction in mTORC2 activity.
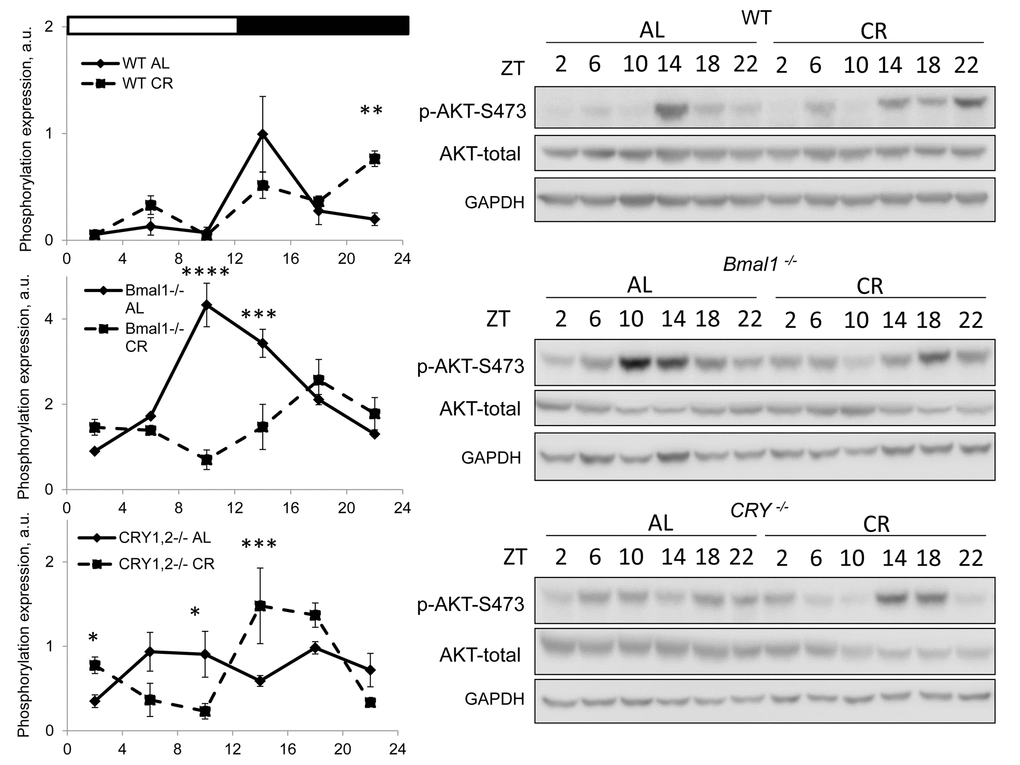
Figure 2. CR effect on TORC2 activity is time of the day and BMAL1 dependent. Activity of mTORC2 in the liver of mice on AL and CR diets was assayed through phosphorylation of AKT on S473. Representative WBs and quantification of diurnal rhythms in phosphorylation of AKT in wild type mice (upper panels), Bmal1-/- mice (middle panels) and Cry1,2-/- mice (lower panels). (AL) – black diamonds, black solid line, 30% caloric restriction (CR) – black squares and dashed black lines. Two-way repeated ANOVA were used for statistical analysis, * - statistically significant difference (p<0.05) between diets (three male mice were used for every time point in both groups). Light and dark bars on the top of the figure represent light and dark phase of the day. ZT0 is the time when light is on and ZT12 is the time when light is off. Food for CR group was provided at ZT14. On the day of tissue collection at ZT14 tissues were harvested before mice received the food.
TORC2-dependent phosphorylation of AKT stimulates the kinase activity, and we decided to check the effect of CR on the phosphorylation of PRAS40 at S246, it is known that this site is phosphorylated by AKT [28]. We assayed the phosphorylation in wild type and mutant mice under both diets (Figure 3). PRAS40 phosphorylation was increased in wild type at ZT22 and was reduced in the liver of Bmal1-/- at ZT10 and ZT14. The phosphorylation was increased at ZT18 and decreased at ZT10 in Cry1,2-/- mice. Thus, we observed a good correlation between AKT and PRAS40 phosphorylation.
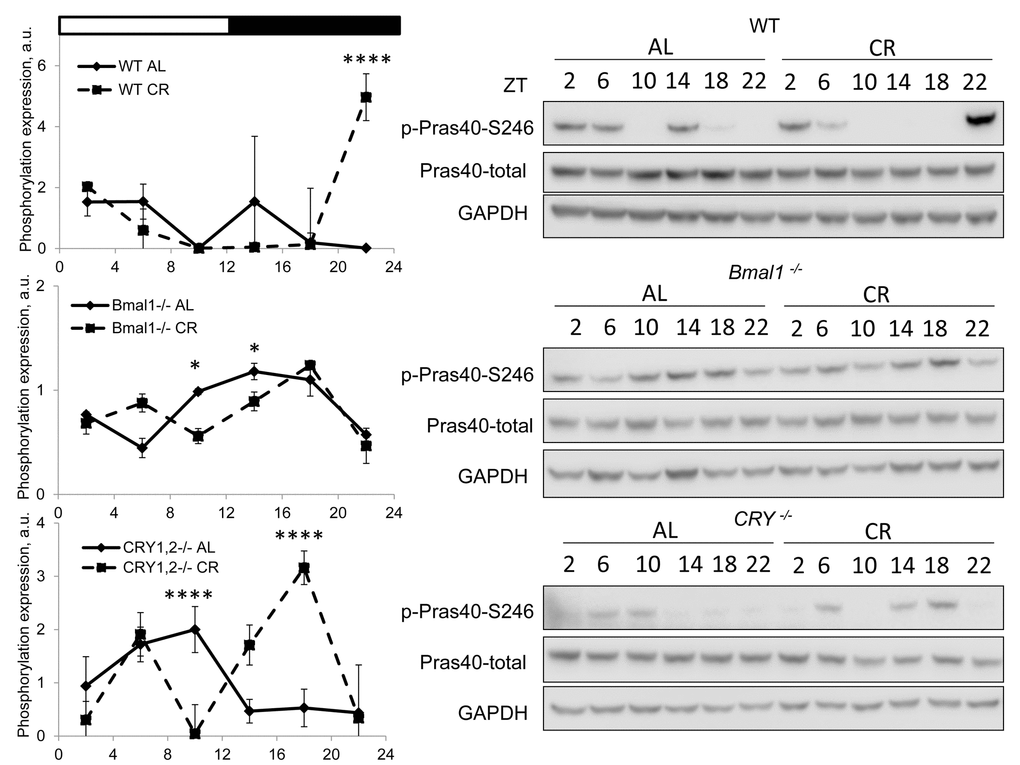
Figure 3. CR effect on AKT activity is time of the day and BMAL1 dependent. Activity of AKT in the liver of mice on AL and CR diets was assayed through phosphorylation of PRAS on S246. Representative WBs and quantification of diurnal rhythms in phosphorylation of PRAS in wild type mice (upper panels), Bmal1-/- mice (middle panels) and Cry1,2-/- mice (lower panels). (AL) – black diamonds, black solid line, 30% caloric restriction (CR) – black squares and dashed black lines. Two-way repeated ANOVA was used for statistical analysis, * - statistically significant difference (p<0.05) between diets (three male mice were used for every time point in both groups). Light and dark bars on the top of the figure represent light and dark phases of the day. ZT0 is the time when light is on and ZT12 is the time when light is off. Food for CR group was provided at ZT14. On the day of tissue collection at ZT14 tissues were harvested before mice receive the food.
Discussion
We reported here that CR affected daily changes in mTORC1 and mTORC2 activity in the liver. mTOR plays an important role in the control of metabolism and aging. High mTORC1 activity promotes aging and suppression of mTORC1 increases longevity. mTORC2 might also be involved in the control of longevity but, in contrast to mTORC1, it might be a positive regulator of longevity [29]. Changes in mTORC1 activity are implicated in the mechanism of CR [30]. It was previously reported that CR affects activity of mTORC1: data in invertebrate model organisms are consistent [31] but published results in the rodents were not in agreement with each other [7,8]. Our data might provide an explanation to this discrepancy, indeed, depending on the time of the analysis, CR might result in decreased, increased or no changes in activity of mTORC1. Little is known about the influence of CR on mTORC2 activity. We found the effect of CR on mTORC2 signaling was also time-of-day dependent.
It is important to mention that feeding is a regulator of mTOR activity and CR can change a feeding pattern, therefore, some of the observed effects can be due to the changes in the feeding. It is also well documented that phases of clock gene expression in the liver are strongly affected by time of the feeding [32]. Feeding profile of wild type mice on AL and CR diets was recently carefully recorded [23], AL mice consumed the food predominantly during the dark phase with maximum consumption between ZT14 and ZT18. In our study we provided the food for CR group at ZT14, and mice consumed most of the food between ZT14 and ZT18. Therefore, we expect that selected feeding schedule will disturb the circadian clock in the liver in most minimal way. Indeed, as it was reported, feeding CR mice at ZT14 [19,20] or at ZT12 [13] has minimal or no effect on phases of clock gene expression in the liver. Thus, we concluded that feeding at ZT14 is the most appropriate time to study the effect of CR in wild type mice. The behavior of circadian clock mutant mice is rhythmic under 12:12 light/dark cycle, but feeding behavior might be affected by clock disruption, therefore, different pattern of mTOR activity between wild type and mutants under AL might be due to the difference in the feeding profile, but under CR diets all wild type and mutants have the same feeding profile, they consumed the food between ZT14 and ZT18. However, the daily profiles of mTORC1 and mTORC2 activities under CR were not identical between wild type and mutants: for example, the peak of mTORC1 under CR was observed at ZT18 in wild type, at ZT18 in Bmal1-/- and at ZT14 in Cry1,2-/- mice; mTORC2 activity was high at ZT22 in wild type, intermediate in Bmal1-/- and low in Cry1,2-/- mice. Together that suggests that the change in feeding pattern is not the only regulator of CR induced effects on mTOR signaling.
Difference in the amount of the food consumption between wild type and mutants might be another contributing factor. There is no significant difference in food consumption between wild type Bmal1-/- mice [20], while Cry1,2-/- mice consume about 15% less food [33]. We compared total daily activity of mTORC1 and mTORC2 under CR and AL. We found that average activity of mTORC1 was reduced in all three genotypes and average activity of mTORC2 was increased in wild type, reduced in Bmal1-/- and did not changed in Cry1,2-/- mice. Thus, the difference in the response of mTOR complexes to CR between wild type and mutants cannot be explained through the difference in total food intake: wild type and Bmal1-/- mice have the same food intake but different responses.
mTORC1 and mTORC2 share the same catalytic subunit, the TOR kinase [4,5]. It was postulated that the TOR kinase is a limiting factor and complexes compete for it [34]. In addition, the complexes regulate each other activity through phosphorylation of the complexes components [35,36]. We used JTK analysis to assay if the activities of mTOR complexes have circadian rhythms. The result of rhythms analysis is presented in Supplementary Table 1. mTORC1 activity was rhythmic for wild type at both diets, both mutants were arrhythmic under AL and Bmal1-/- became rhythmic under CR, while Cry1,2-/- did not. mTORC2 activity was rhythmic under AL in wild type and Bmal1-/- mice, it lost the rhythms in wild type under CR but it was still rhythmic in Bmal1-/- mice. The peaks in mTORC1 and mTORC2 activities coincided at ZT14 for AL wild type mice, while mTORC1 peaked at ZT 16 and mTORC2 peaked at ZT 20 (Supplementary Table 1) in CR wild type mice. Thus, under CR the peaks in mTORC1 and mTORC2 activities were temporally separated in wild type mice. No such temporal separation between peaks was observed in circadian clock mutants: the peaks are at ZT 18 (mTORC1) and ZT 20 (mTORC2) in the liver of Bmal1-/- mice and at ZT18 (for both) in the liver of Cry1,2-/-mice. Interestingly, at wildness, animals do not have continuous access to the food and our data suggest that intact circadian clock is necessary for temporal separation of the peaks in mTORC1 and mTORC2 activities under conditions of limited nutrients supply.
Based on the presented data, we proposed the following hypothesis: the balance between the complexes established under AL feeding was changed by CR and shifted toward mTORC2. Circadian clock and circadian clock proteins contributed to this shift through compartmentalization of mTORC1 and mTORC2 activities in time. The effect of CR was further compromised in Bmal1-/- mice, suggesting that BMAL1 has some clock independent functions in CR. Indeed, CR regulated expression and activity of the clock transcriptional factor BMAL1 is necessary for the regulation of CR-controlled signaling pathways and for the full benefits of CR. Interestingly, while Bmal1-/- mice demonstrate multiple metabolic abnormalities as well as accelerated aging and reduced lifespan [37], this phenotype can be partially reversed by treatment with pharmacological inhibitor of mTOR activity – rapamycin [10]. BMAL1 is a negative regulator of mTORC1 [10,14] and a positive regulator of mTORC2 [17] activities under AL, according to our findings BMAL1 was important for the up regulation of mTORC2 and was not important for the down regulation of mTORC1 under CR. In summary, we report differential regulation of mTORC1 and mTORC2 by CR and involvement of the circadian clock in this regulation. These results encourage further studies on the role of biological clocks and clock proteins in CR and open an opportunity to use clock mechanisms to improve or even mimic CR.
Methods
Animals
Wild type and circadian mutant mice were on C57BL/6J background. Bmal1-/- and Cry1,2-/- mice were previously described [24,25]. Animals were maintained on a 12:12 light:dark cycle with lights on at 7:00 am, and fed 18% protein rodent diet (Harlan). Ad libitum (AL) group had unrestricted access to food. Animals on Caloric restriction (CR) diet received their food once per day at ZT14. CR was started at 3 months of age. Animals were on 30% CR for two months before tissue collection. All groups had unrestricted access to water. All tissue collection experiments were performed for 5-month-old wild type, Bmal1-/- and Cry1,2-/- mice. All animal studies were conducted in accordance with the regulations of the Committee on Animal Care and Use at Cleveland State University.
Analysis of protein phosphorylation and expression
Analysis of protein expression was performed on liver tissues collected every four hours around the clock and stored at -80oC. For quantitative analysis, liver samples were run individually to estimate variability between biological replicates. For a representative WB, liver lysates from three different mice were pooled together for each time point. Lysates were prepared with lysis buffer with Protease/Phosphatase Inhibitor Cocktail (Cell Signaling Technology, Beverly, MA, USA) using a sonicator. Protein concentration was determined using Bradford protein assay kit. Protein loading was checked by Ponceau staining. List of primary antibodies is in Supplementary Table 2. Probing the same membranes with anti-GAPDH antibodies was used for normalization of the signal. Images were obtained with LI-COR, Lincoln, NE, quantification was performed with the Image Studio Lite version 5.2 software.
Statistical analysis
At least 3 animals for every time point, for each feeding type and for each genotype were used for all experiments. Data are shown as average +/- standard deviation. IBM SPSS Statistics 20 and GraphPad software packages were used for analysis. The effect of diet (AL versus CR) and time of day were tested for significance with two-way repeated ANOVA corrected for multiple comparison using Bonferroni. P<0.05 was considered as statistically significant difference.
Conflicts of Interest
The authors of this paper declare no conflicts of interest.
Funding
This work was supported by NIH grants 1R01AG039547 and funds from GRHD CSU.
References
- 1. Anton S, Leeuwenburgh C. Fasting or caloric restriction for healthy aging. Exp Gerontol. 2013; 48:1003–05. https://doi.org/10.1016/j.exger.2013.04.011 [PubMed]
- 2. Tucci P. Caloric restriction: is mammalian life extension linked to p53? Aging (Albany NY). 2012; 4:525–34. https://doi.org/10.18632/aging.100481 [PubMed]
- 3. Pan H, Finkel T. Key proteins and pathways that regulate lifespan. J Biol Chem. 2017; 292:6452–60. https://doi.org/10.1074/jbc.R116.771915 [PubMed]
- 4. Saxton RA, Sabatini DM. mTOR Signaling in Growth, Metabolism, and Disease. Cell. 2017; 168:960–76. https://doi.org/10.1016/j.cell.2017.02.004 [PubMed]
- 5. González A, Hall MN. Nutrient sensing and TOR signaling in yeast and mammals. EMBO J. 2017; 36:397–408. https://doi.org/10.15252/embj.201696010 [PubMed]
- 6. Saraswat K, Rizvi SI. Novel strategies for anti-aging drug discovery. Expert Opin Drug Discov. 2017; 12:955–66. https://doi.org/10.1080/17460441.2017.1349750 [PubMed]
- 7. Moore T, Beltran L, Carbajal S, Strom S, Traag J, Hursting SD, DiGiovanni J. Dietary energy balance modulates signaling through the Akt/mammalian target of rapamycin pathways in multiple epithelial tissues. Cancer Prev Res (Phila). 2008; 1:65–76. https://doi.org/10.1158/1940-6207.CAPR-08-0022 [PubMed]
- 8. Sharma N, Castorena CM, Cartee GD. Tissue-specific responses of IGF-1/insulin and mTOR signaling in calorie restricted rats. PLoS One. 2012; 7:e38835. https://doi.org/10.1371/journal.pone.0038835 [PubMed]
- 9. Khapre RV, Patel SA, Kondratova AA, Chaudhary A, Velingkaar N, Antoch MP, Kondratov RV. Metabolic clock generates nutrient anticipation rhythms in mTOR signaling. Aging (Albany NY). 2014; 6:675–89. https://doi.org/10.18632/aging.100686 [PubMed]
- 10. Khapre RV, Kondratova AA, Patel S, Dubrovsky Y, Wrobel M, Antoch MP, Kondratov RV. BMAL1-dependent regulation of the mTOR signaling pathway delays aging. Aging (Albany NY). 2014; 6:48–57. https://doi.org/10.18632/aging.100633 [PubMed]
- 11. Jouffe C, Cretenet G, Symul L, Martin E, Atger F, Naef F, Gachon F. The circadian clock coordinates ribosome biogenesis. PLoS Biol. 2013; 11:e1001455. https://doi.org/10.1371/journal.pbio.1001455 [PubMed]
- 12. Cornu M, Oppliger W, Albert V, Robitaille AM, Trapani F, Quagliata L, Fuhrer T, Sauer U, Terracciano L, Hall MN. Hepatic mTORC1 controls locomotor activity, body temperature, and lipid metabolism through FGF21. Proc Natl Acad Sci USA. 2014; 111:11592–99. https://doi.org/10.1073/pnas.1412047111 [PubMed]
- 13. Sato S, Solanas G, Peixoto FO, Bee L, Symeonidi A, Schmidt MS, Brenner C, Masri S, Benitah SA, Sassone-Corsi P. Circadian Reprogramming in the Liver Identifies Metabolic Pathways of Aging. Cell. 2017; 170:664–677.e11. https://doi.org/10.1016/j.cell.2017.07.042 [PubMed]
- 14. McGinnis GR, Tang Y, Brewer RA, Brahma MK, Stanley HL, Shanmugam G, Rajasekaran NS, Rowe GC, Frank SJ, Wende AR, Abel ED, Taegtmeyer H, Litovsky S, et al. Genetic disruption of the cardiomyocyte circadian clock differentially influences insulin-mediated processes in the heart. J Mol Cell Cardiol. 2017; 110:80–95. https://doi.org/10.1016/j.yjmcc.2017.07.005 [PubMed]
- 15. Lipton JO, Yuan ED, Boyle LM, Ebrahimi-Fakhari D, Kwiatkowski E, Nathan A, Güttler T, Davis F, Asara JM, Sahin M. The circadian protein BMAL1 regulates translation in response to S6K1-mediated phosphorylation. Cell. 2015; 161:1138–51. https://doi.org/10.1016/j.cell.2015.04.002 [PubMed]
- 16. Lipton JO, Boyle LM, Yuan ED, Hochstrasser KJ, Chifamba FF, Nathan A, Tsai PT, Davis F, Sahin M. Aberrant Proteostasis of BMAL1 Underlies Circadian Abnormalities in a Paradigmatic mTOR-opathy. Cell Reports. 2017; 20:868–80. https://doi.org/10.1016/j.celrep.2017.07.008 [PubMed]
- 17. Zhang D, Tong X, Arthurs B, Guha A, Rui L, Kamath A, Inoki K, Yin L. Liver clock protein BMAL1 promotes de novo lipogenesis through insulin-mTORC2-AKT signaling. J Biol Chem. 2014; 289:25925–35. https://doi.org/10.1074/jbc.M114.567628 [PubMed]
- 18. Mohawk JA, Green CB, Takahashi JS. Central and peripheral circadian clocks in mammals. Annu Rev Neurosci. 2012; 35:445–62. https://doi.org/10.1146/annurev-neuro-060909-153128 [PubMed]
- 19. Patel SA, Velingkaar N, Makwana K, Chaudhari A, Kondratov R. Calorie restriction regulates circadian clock gene expression through BMAL1 dependent and independent mechanisms. Sci Rep. 2016; 6:25970. https://doi.org/10.1038/srep25970 [PubMed]
- 20. Patel SA, Chaudhari A, Gupta R, Velingkaar N, Kondratov RV. Circadian clocks govern calorie restriction-mediated life span extension through BMAL1- and IGF-1-dependent mechanisms. FASEB J. 2016; 30:1634–42. https://doi.org/10.1096/fj.15-282475 [PubMed]
- 21. Katewa SD, Akagi K, Bose N, Rakshit K, Camarella T, Zheng X, Hall D, Davis S, Nelson CS, Brem RB, Ramanathan A, Sehgal A, Giebultowicz JM, et al. Peripheral Circadian Clocks Mediate Dietary Restriction-Dependent Changes in Lifespan and Fat Metabolism in Drosophila. Cell Metab. 2016. 23:143–154. https://doi.org/10.1016/j.cmet.2015.10.014 [PubMed]
- 22. Solanas G, Peixoto FO, Perdiguero E, Jardí M, Ruiz-Bonilla V, Datta D, Symeonidi A, Castellanos A, Welz PS, Caballero JM, Sassone-Corsi P, Muñoz-Cánoves P, Benitah SA. Aged Stem Cells Reprogram Their Daily Rhythmic Functions to Adapt to Stress. Cell. 2017; 170:678–692.e20. https://doi.org/10.1016/j.cell.2017.07.035 [PubMed]
- 23. Acosta-Rodríguez VA, de Groot MH, Rijo-Ferreira F, Green CB, Takahashi JS. Mice under Caloric Restriction Self-Impose a Temporal Restriction of Food Intake as Revealed by an Automated Feeder System. Cell Metab. 2017; 26:267–277.e2. https://doi.org/10.1016/j.cmet.2017.06.007 [PubMed]
- 24. Bunger MK, Wilsbacher LD, Moran SM, Clendenin C, Radcliffe LA, Hogenesch JB, Simon MC, Takahashi JS, Bradfield CA. Mop3 is an essential component of the master circadian pacemaker in mammals. Cell. 2000; 103:1009–17. https://doi.org/10.1016/S0092-8674(00)00205-1 [PubMed]
- 25. Vitaterna MH, Selby CP, Todo T, Niwa H, Thompson C, Fruechte EM, Hitomi K, Thresher RJ, Ishikawa T, Miyazaki J, Takahashi JS, Sancar A. Differential regulation of mammalian period genes and circadian rhythmicity by cryptochromes 1 and 2. Proc Natl Acad Sci USA. 1999; 96:12114–19. https://doi.org/10.1073/pnas.96.21.12114 [PubMed]
- 26. Okamura H, Miyake S, Sumi Y, Yamaguchi S, Yasui A, Muijtjens M, Hoeijmakers JH, van der Horst GT. Photic induction of mPer1 and mPer2 in cry-deficient mice lacking a biological clock. Science. 1999; 286:2531–34. https://doi.org/10.1126/science.286.5449.2531 [PubMed]
- 27. Manning BD, Toker A. AKT/PKB Signaling: navigating the Network. Cell. 2017; 169:381–405. https://doi.org/10.1016/j.cell.2017.04.001 [PubMed]
- 28. Dennis MD, Kimball SR, Jefferson LS. Mechanistic target of rapamycin complex 1 (mTORC1)-mediated phosphorylation is governed by competition between substrates for interaction with raptor. J Biol Chem. 2013; 288:10–19. https://doi.org/10.1074/jbc.M112.402461 [PubMed]
- 29. Lamming DW, Sabatini DM. A radical role for TOR in longevity. Cell Metab. 2011; 13:617–18. https://doi.org/10.1016/j.cmet.2011.05.006 [PubMed]
- 30. Kennedy BK, Lamming DW. The Mechanistic Target of Rapamycin: The Grand ConducTOR of Metabolism and Aging. Cell Metab. 2016; 23:990–1003. https://doi.org/10.1016/j.cmet.2016.05.009 [PubMed]
- 31. Kapahi P, Kaeberlein M, Hansen M. Dietary restriction and lifespan: lessons from invertebrate models. Ageing Res Rev. 2017; 39:3–14. https://doi.org/10.1016/j.arr.2016.12.005 [PubMed]
- 32. Damiola F, Le Minh N, Preitner N, Kornmann B, Fleury-Olela F, Schibler U. Restricted feeding uncouples circadian oscillators in peripheral tissues from the central pacemaker in the suprachiasmatic nucleus. Genes Dev. 2000; 14:2950–61. https://doi.org/10.1101/gad.183500 [PubMed]
- 33. Chaudhari A, Gupta R, Patel S, Velingkaar N, Kondratov R. Cryptochromes regulate IGF-1 production and signaling through control of JAK2-dependent STAT5B phosphorylation. Mol Biol Cell. 2017; 28:834–42. https://doi.org/10.1091/mbc.e16-08-0624 [PubMed]
- 34. Bracho-Valdés I, Moreno-Alvarez P, Valencia-Martínez I, Robles-Molina E, Chávez-Vargas L, Vázquez-Prado J. mTORC1- and mTORC2-interacting proteins keep their multifunctional partners focused. IUBMB Life. 2011; 63:896–914. https://doi.org/10.1002/iub.558 [PubMed]
- 35. Huang J, Manning BD. A complex interplay between Akt, TSC2 and the two mTOR complexes. Biochem Soc Trans. 2009; 37:217–22. https://doi.org/10.1042/BST0370217 [PubMed]
- 36. Sancak Y, Thoreen CC, Peterson TR, Lindquist RA, Kang SA, Spooner E, Carr SA, Sabatini DM. PRAS40 is an insulin-regulated inhibitor of the mTORC1 protein kinase. Mol Cell. 2007; 25:903–15. https://doi.org/10.1016/j.molcel.2007.03.003 [PubMed]
- 37. Kondratov RV, Kondratova AA, Gorbacheva VY, Vykhovanets OV, Antoch MP. Early aging and age-related pathologies in mice deficient in BMAL1, the core componentof the circadian clock. Genes Dev. 2006; 20:1868–73. https://doi.org/10.1101/gad.1432206 [PubMed]