


Introduction
Skin is the largest organ of human body and its physiological changes are affected by intrinsic or extrinsic factors [1,2]. Aging is a biological process which occurs to every individual from the moment of one’s birth and it is one of “the factor” that causes changes in skin. In addition, among various factors, ultraviolet (UV) light is the most well-known extrinsic factor which enhances skin aging [1]. Majority of the organs are located internally in human body, however, in case of skin, it holds both sides of the coin; some parts are UV protected and some other parts are UV exposed.
There are a few previous studies regarding the aging-related gene expression changes in skin. Glass et al. examined the gene expression changes with age in various human tissues including skin [3]. They only suggested that a significant proportion of aging-related changes in gene expression profile are tissue specific. Furthermore, Yang et al. studied the aging-related gene expression alteration in multiple tissues [4]. However, in their study, skin did not show the aging-related changes. In addition, Kaisers et al. also reported that the aging-related gene expression changes were not displayed in skin [5]. Conversely, a study done by Kimball et al. demonstrated a few changes due to aging in skin [6]. In their study, down-regulated mitochondrial function was illustrated as one of the signatures of aged skin. Additionally, increased cytokine production and immune responses with aging were also described.
As mentioned above, although there are a few studies on the aging-related gene expression changes in skin, the results are still debatable. Moreover, a large-scale study on the gene expression changes of skin tissue according to UV exposure has not been reported yet. Therefore, elucidating the consequences of intrinsic- and photo-aging in transcriptomic level will expand our understanding on skin aging.
In the present study, we used RNA sequencing data of skin from Genotype-Tissues Expression (GTEx) project [7,8]. GTEx database provided a large number of transcriptome data of skin samples from two different origins, suprapubic (UV protected) and lower leg (UV exposed), which enabled us to identify the transcriptomic shift of skin tissues due to UV exposure and aging.
Results
DEG analysis of gene expression changes upon UV exposure
Principle component analysis revealed clear transcriptomic difference between suprapubic and lower leg tissues, possibly due to UV exposure (Figure 1A). Moreover, DEGs between two groups also showed the evident distinction of two tissues in transcriptome level (Figure 1B). Down-regulated DEGs included IL6 and IL33, which are involved in wound heading [9–11], in addition to several histone genes such as HIST2HBF, HIST1H2AE, HIST1H1C, HIST1H2BG, HIST1H2BD, and HIST2H2AA3. The down-regulation of histone genes by external stimuli, which corresponds to our result, was previously reported [12]. This might suggest the decreased histone genes in lower leg was affected by chronic UV exposure. In addition, HOXB13, plays a role in fetal skin development and cutaneous regeneration [13], and several matrix metalloproteinase (MMP) genes including MMP3, MMP13, MMP2, MMP8, and MMP10 were elevated in lower leg. In relation to MMP genes, their up-regulation in photo-damaged skin is well-reported event which induces collagen fragmentation [1,14].
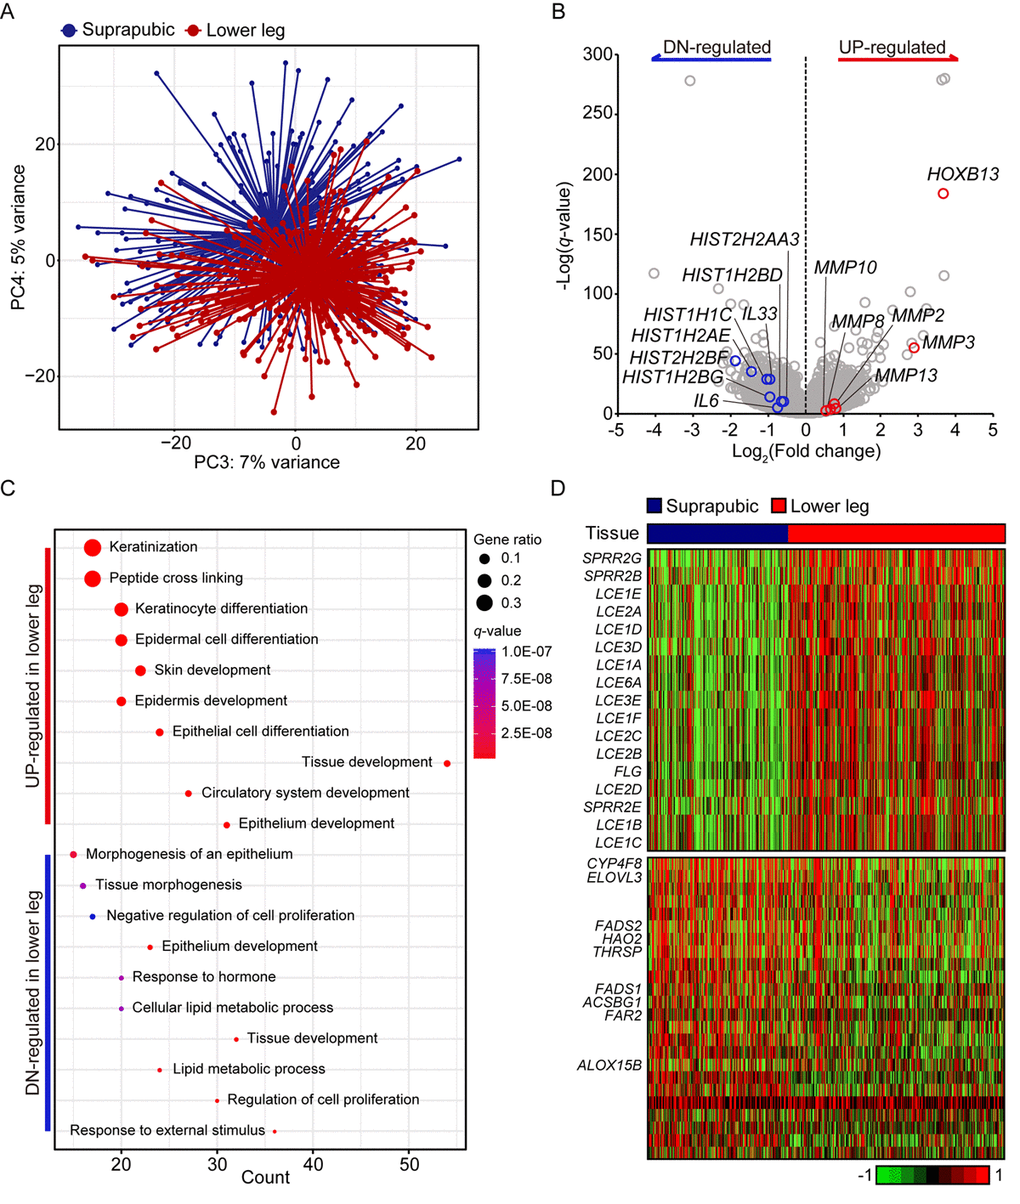
Figure 1. Transcriptome analysis of lower leg (UV exposed) and suprapubic (UV protected) skin samples. (A) Distinct separation of two groups was observed with principal component analysis. (B) Differentially expressed genes were displayed on the volcano plot. A few notable genes were marked. (C) Using differentially expressed genes, enriched pathways were shown in dot plot. Top 10 the most enriched pathways were used. Gene ratio = no. of genes that were enriched on the given pathway/ total no. of genes on the given gene set. q-value illustrated the significance. (D) Gene expression profiles of epidermal differentiation complex component genes (upper panel) and lipid metabolic process related genes (lower panel).
Using pathway enrichment analysis, the functional characteristics of up- and down-regulated genes were discovered (Figure 1C). Especially for the up-regulated genes, they were mostly enriched in skin/tissue development. In epidermis, a gene complex called the epidermal differentiation complex (EDC) regulates skin barrier function and it is composed of small proline-rich (SPRR) proteins, late cornified envelope (LCE) proteins, S100 family, and S100 fused type protein (SFTP) family [15]. SPRR genes were initially identified as UV responsive genes and LCE genes share the same property [16]. Here, 13 LCE genes were increased as well as three SPRR genes and one SFTP family gene upon UV exposure (Figure 1D).
In case of down-regulated DEGs, they were mainly enriched in ‘response to external stimulus’, ‘regulation of cell proliferation’, and ‘lipid metabolic process’. Some of lipid metabolic genes discovered in our analysis were also reported as declined genes in patients with psoriatic (ACSBG1, ALOX15B, ELOVL3, FADS1, FADS2, and THRSP) [17] or atopic dermatitis (CYP4F8, ELOVL3, FADS1, FADS2, FAR2, and HAO2) [18] (Figure 1D). Additionally, LCE3D, SPRR2B, and SPRR2G which were reported as up-regulated in psoriatic skin were also significantly increased in UV exposed lower leg in our analysis [17]. These results might suggest the increased susceptibility to skin disorders with UV exposure.
Gene co-expression network changes by UV exposure
Based on the above results, we hypothesized that UV exposure induces dramatic gene expression changes in skin, hence, performed in-depth subsequent comparison analysis between suprapubic and lower leg using WGCNA. Transcriptome profile was analyzed with constructed gene co-expressed networks that represent biologically related genes.
We identified 17 modules with UV exposure, eight statistically significant modules were constructed, and top 10 most correlated genes from each module are listed on Supplemental Table 1. The most significant module, tan (R = -0.26 and Bonferroni-corrected P = 3.6E-09), showed down-regulation with UV exposure (Figure 2A). Tan module was related to ‘oxidative phosphorylation’, ‘protein localization’, and ‘organonitrogen compound biosynthetic/metabolic processes’ (Figure 2B). ‘Oxidative phosphorylation’ included numerous genes associated with mitochondrial function such as NADH dehydrogenase (e.g. NDUFA1 and NDUFB1) and ATP synthase (e.g. ATP5C1), and cytochrome c oxidase (e.g. COX6C and COX7C). Moreover, organonitrogen compound related pathways contained genes associated with mitochondrial ribosomal proteins (e.g. MRPL22 and MRPL52). Down-regulation of such genes may represent declined mitochondrial function which is previously reported as one of the signatures of aging across multiple human tissues [4,6,19]. To elucidate this phenomenon further, we analyzed mitochondrial DNA (mtDNA) copy number changes as it is closely linked with mitochondrial biogenesis [20]. Since mtRNA expression and mtDNA copy number are highly correlated [19,21], we estimated mtDNA copy number using mtRNA expression. As a result, UV induced mtDNA copy number defect was discovered (Figure 2C, Mann Whitney test P < 0.001). Additionally, a trend of decrement was observed with aging in both tissues (suprapubic: P for trend < 0.001 and lower leg: P for trend = 0.029).
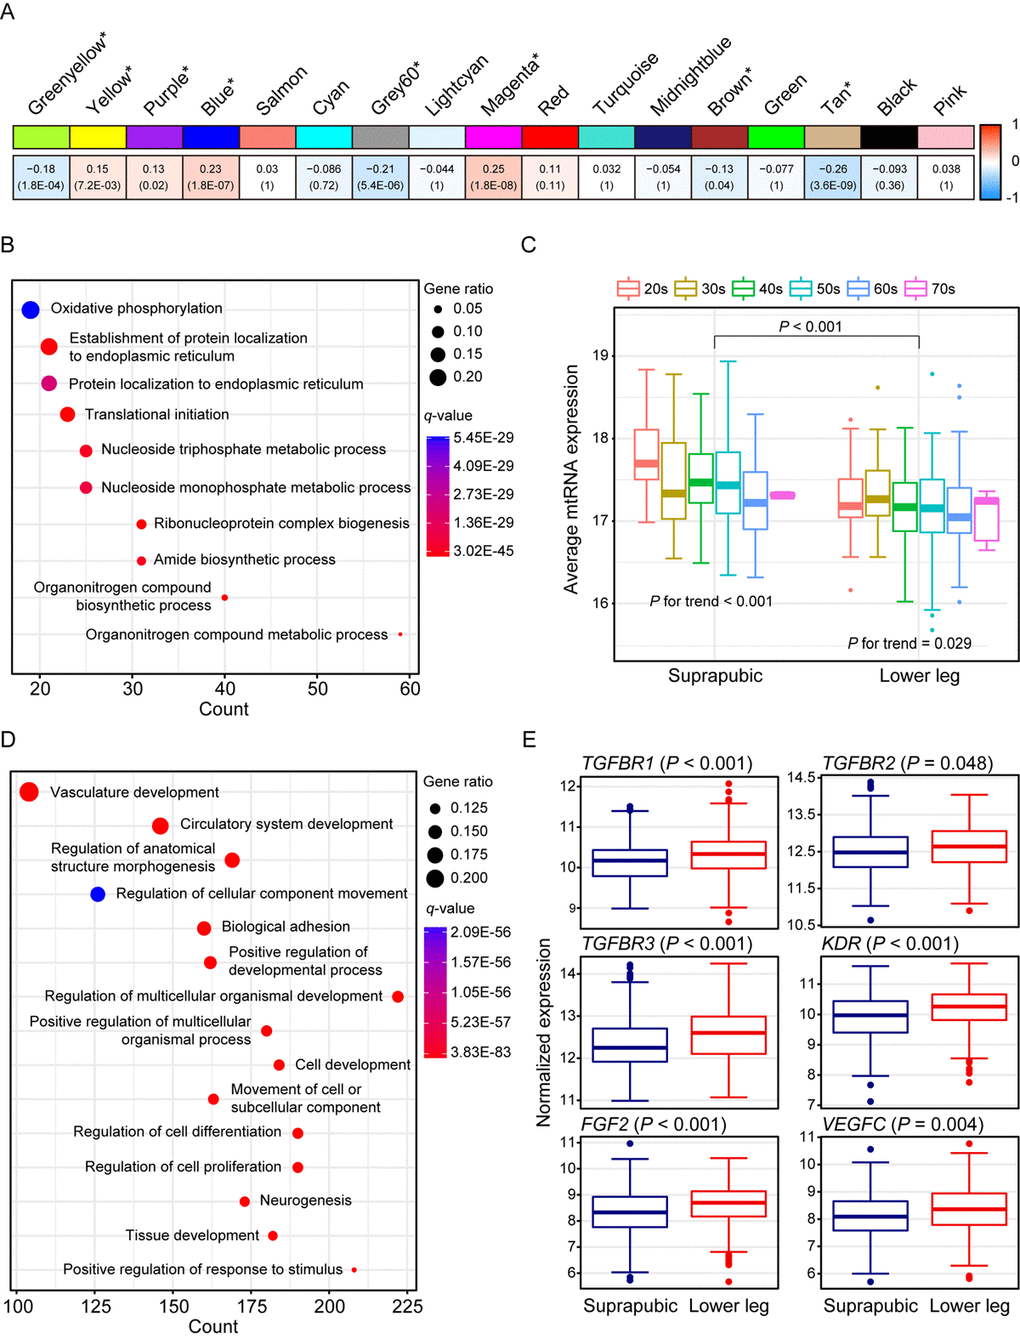
Figure 2. Weighted gene co-expression network analysis using all samples. (A) Module trait relationship of constructed modules. The statistically significant modules were marked with asterisk. The correlation values and Bonferroni-corrected P-values (in the bracket) were marked. (B) Pathway enrichment result for tan module. Top 10 the most enriched pathways were shown. (C) Estimated mitochondrial DNA copy number using mitochondrial RNA (mtRNA) expression level. Both tissues showed down-regulation of average mtRNA expression with aging (suprapubic: P for trend < 0.001 and lower leg: P for trend = 0.025). (D) Pathway enrichment result for blue module. Top 15 the most enriched pathways were used. (E) Relative gene expression levels of six angiogenesis related genes from blue module.
There were three other significantly down-regulated modules with UV exposure: grey60 (R = -0.21 and Bonferroni-corrected P = 5.4E-06), greenyellow (R = -0.18 and Bonferroni-corrected P = 1.8E-04), and brown (R = -0.13 and Bonferroni-corrected P = 0.04) (Supplemental Figure 1). Genes from grey60 module were mostly enriched with lipid metabolic related processes and showed decrement which was also observed in previous results [22,23]. In particular, top 10 most correlated genes from Grey60 included three fatty acid related genes such as FADS2, ELOVL3, and FADS1 (Supplemental Table 1). Down-regulated ‘cellular response to stress’, ‘RNA/mRNA process’, ‘protein localization’, and ‘cell cycle’ were also exhibited.
The second most correlated module, magenta (R = 0.25 and Bonferroni-corrected P = 1.8E-08), was associated with ‘skin development’, ‘keratinocyte differentiation’, and ‘keratinization’ (Supplemental Figure 1). In parallel with results from DEG analysis, many EDC components were elevated including LCE genes. LCE proteins function in the last step of cornification [15] and the cornified cells consist degraded organelles and eventually get detached from the skin layer [24–26]. The altered cornified envelope by UV exposure may induce a reduced barrier function of skin. Moreover, FLG2, one of well-known EDC genes, is found as top 10 most correlated genes (Supplemental Table 1) which again emphasized that genes from magenta module contributes to skin development pathway.
Wrinkle is the most well-known characteristic of aged skin and it is reported that angiogenesis is closely associated with its generation [27–30]. Blue module (R = 0.23 and Bonferroni-corrected P = 1.8E-07) was enriched with various biological processes including ‘vasculature development’, ‘circulatory system development’, and ‘regulation of anatomical structure morphogenesis’ (Figure 2D). Several genes that are involved in angiogenesis including FGF2, KDR, TGFBR1, TGFBR2, TGFBR3, and VEGFC were significantly increased in lower leg relative to suprapubic (Figure 2E).
In addition, yellow (R = 0.15 and Bonferroni-corrected P = 7.2E-03) and purple (R = 0.13 and Bonferroni-corrected P = 0.02) also displayed up-regulation in lower leg (Supplemental Figure 1). Many collagen genes were included in up-regulated modules including blue, yellow and purple. Collagen is a well-known component of skin layer and plays an important role in skin structure and, usually, collagen degradation is frequently observed in photo-damaged skin [31]. However, in our analysis, increment of those genes was exhibited, thus, we could assume that increased collagen genes can also alter skin structure upon UV exposure as well as degraded collagen genes [32] (Supplemental Table 3).
Aging associated gene expression changes in UV exposed skin
We also presented photo-aging signatures by performing WGCNA using only lower leg skin samples and 21 aging-related modules were constructed and four of them were statistically significant (Figure 3A). In addition, the top 10 genes with the highest connectivity from four significant modules are listed on Supplemental Table 2. The most correlated module was tan (R = -0.29, Bonferroni-corrected P = 1.1E-06) and it was mainly enriched with wound healing related pathways including ‘heparan sulfate proteoglycan biosynthetic process’, ‘wound healing’, and ‘response to wounding’ (Figure 3B). Heparan sulfate is a type of glycosaminoglycans, a group of long-chain carbohydrates with high molecular weight, that are sulfated [33] and proteoglycans play crucial roles in regulating several physiological processes including wound healing [34]. We found three genes, EXTL3, NDST1, and XYLT1, that were involved in ‘heparan sulfate proteoglycan biosynthetic process’ displayed decrement with aging in both tissues (Figure 3C). In particular, NDTS1 was one of top 10 most correlated genes found in this module (Supplemental Table 2). Also, there were nine genes discovered that were enriched in ‘wound healing’ and ‘response to wounding’ (Figure 3D). Those genes were also found in modules which were associated with aging in suprapubic (red and yellow modules; Supplemental Figure 2).
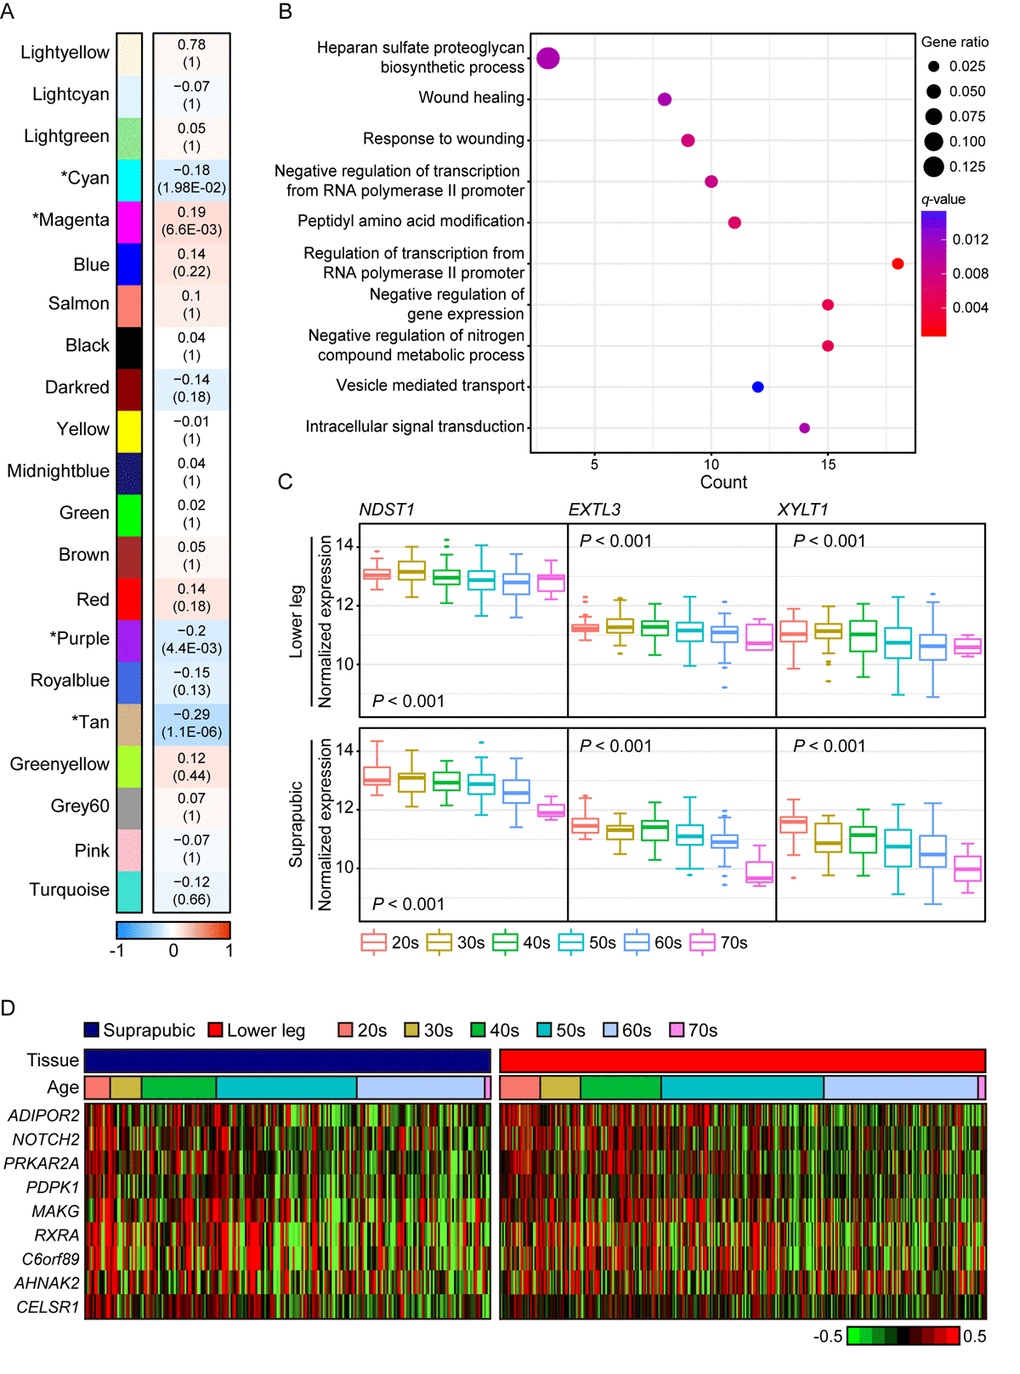
Figure 3. The common gene expression changes with aging in suprapubic and lower leg tissues. (A) Module trait relationship of constructed modules from lower leg. The statistically significant modules were marked with asterisk. The correlation values and Bonferroni-corrected P-values (in the bracket) were marked. (B) Pathway enrichment analysis of tan module. Top 10 the most enriched pathways were used. (C) The changes in gene expression level of three genes that play a role in heparan sulfate proteoglycan biosynthetic process in both tissues were shown. (D) Heatmap displays the expression level of nine genes that play a role in wound healing process in both tissues.
In purple module (R = -0.2 and Bonferroni-corrected P = 4.4E-03), ‘skin/tissue development’, ‘lipid metabolic process’, and ‘regulation of water loss via skin’ were found (Figure 4A). Lipid metabolism and prevention of water loss are known to have roles in skin barrier function and often influenced by aging [35,36]. Genes involved in lipid metabolism such as ERBB3, LIPK, LIPN, SGPL1, and SMPD3 were decreased with aging as well as several water loss regulation genes including ABCA12, CLDN1, FLG, FLG2, and GBA (Figure 4B). Aforementioned genes were not found in statistically significant aging-related module in suprapubic (yellow, salmon, and pink modules; Supplemental Figure 2). In addition, 12 LCE genes were detected as down-regulated with aging (Supplemental Figure 3). However, from suprapubic, those genes were enriched in salmon module which did not change statistically significant with aging (Supplemental Figure 2).
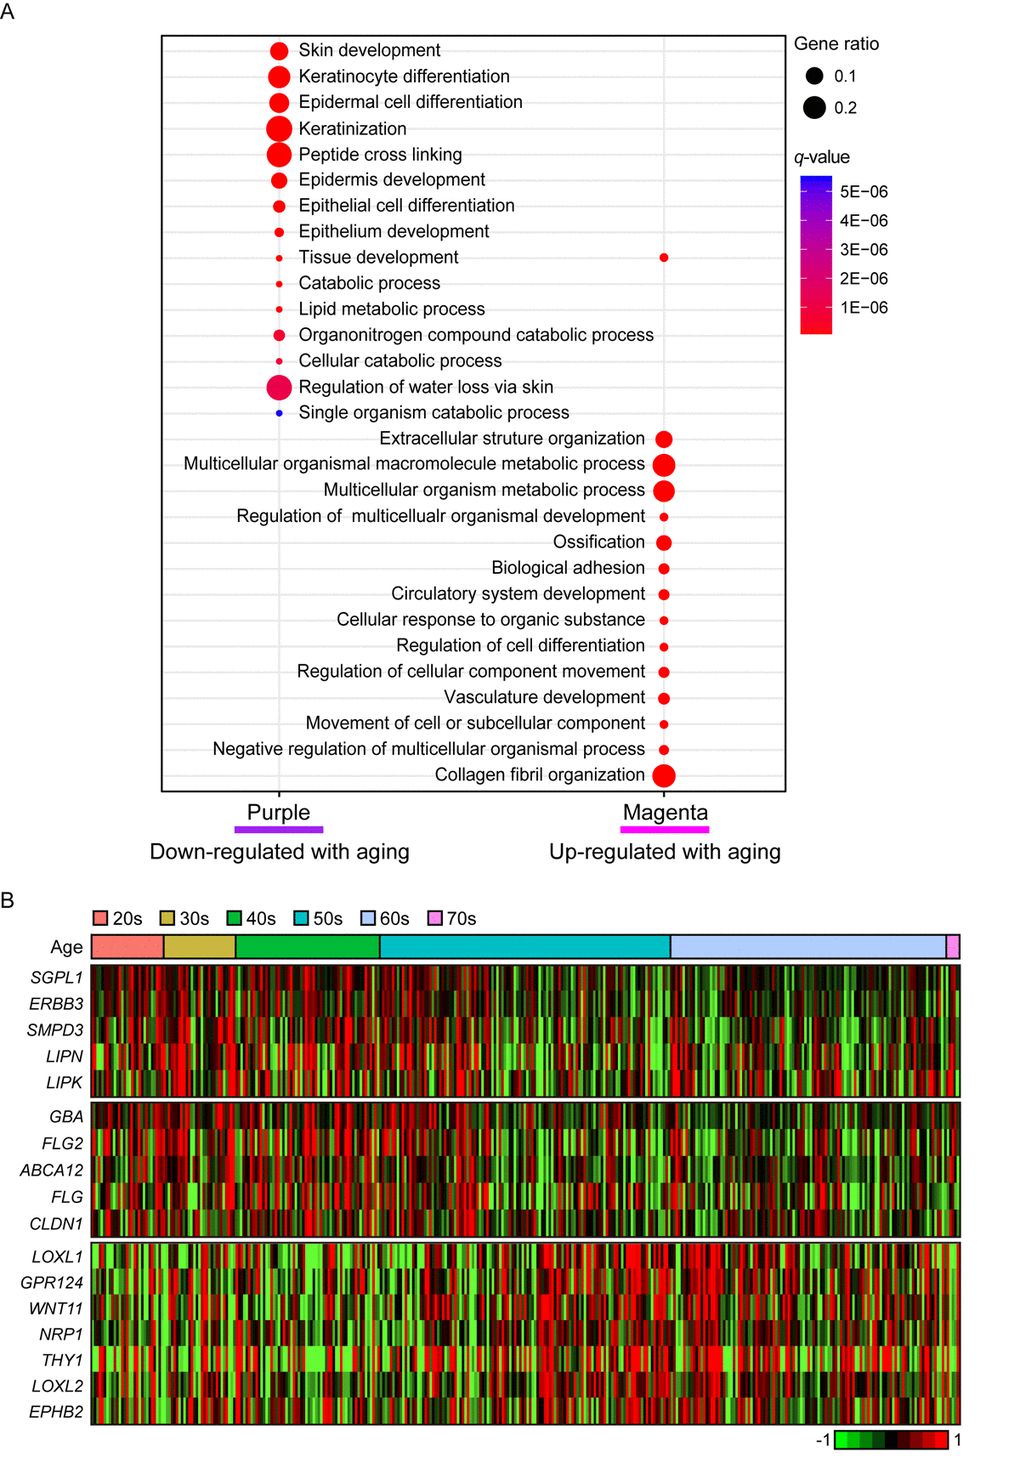
Figure 4. The gene expression alterations that are specific to lower leg. (A) Pathway enrichment analysis of purple and magenta modules. Top 15 the most enriched pathways were used. (B) Heatmap displays the gene expression changes with aging involved in lipid metabolism (top), water loss regulation via skin (middle), and vasculature development (bottom) in lower leg.
Moreover, magenta module (R = 0.19 and Bonferroni-corrected P = 6.6E-03) was up-regulated with aging (Figure 4A). Intriguingly, ‘vasculature development’, which also showed increment with UV exposure, may be related to wrinkle generation, displayed aging-related up-regulation in lower leg. Well-known angiogenesis genes including NRP1, LOXL1 and THY1 were enriched in this pathway (Figure 4B) [37–41]. Especially, THY1 and LOXL1 were found as top 10 most correlated genes in magenta module (Supplemental Table 2). However, the same pathway did not show clear down-regulation in suprapubic (darkred, turquoise, and tan; Supplemental Figure 2). Also, in magenta, collagen related pathways were found, for instance ‘extracellular structure organization’ [42] (Figure 4A). Here, a number of collagen genes including COL5A1, COL6A1, and COL13A1 were elevated which was only observed in lower leg, not in suprapubic (Supplemental Table 4).
Lastly, genes from cyan module (R = -0.18 and Bonferroni-corrected P = 1.98E-02) were decreased with aging in lower leg. ‘Molting cycle’, ‘skin/epidermis development’, and ‘aging’ were enriched and 69% of total analyzed keratin genes were discovered in this module (Supplemental Figure 4 and Supplemental Table 5). Those keratin genes were also found in tan module (R = -0.09, Bonferroni-corrected P = 1), constructed from suprapubic, however they did not show significant elevation with aging.
Discussion
Every organ experiences aging in various ways. Skin aging can be categorized into three groups, intrinsic, photo, and hormonal aging [43–45]. In recent years, the interests in revealing the cause of aging in transcriptome level and how to prevent aging are increasing [3–6,46–48]. In the present study, we primarily focused on finding the consequences of intrinsic- and photo-aging of skin. Currently, there are several studies defined the consequence of acute UV exposure using in vivo or in vitro system whereas there are not many studies on finding the effect of chronic UV exposure, especially by using human tissue samples [27,49–51]. Thus, performing in-depth analysis using human skin samples enables us to describe actual biological changes by UV exposure, hence may help to utilize the findings in our day-to-day life.
In our analyses, down-regulated lipid metabolism and up-regulated vasculature development were highlighted as the characteristics of photo-aged skin. Moreover, decreased mitochondrial biogenesis and wound healing process were found as features of aged skin. In addition to aging, we elucidated the traits of sun exposed skin and discovered increased expression of EDC genes and MMP genes upon UV exposure.
Aging induces the decline of various body functions and lipid metabolism is one of them [52]. There are a few reported studies describing the correlation between decreased lipid metabolism with skin aging [22,23]. Lipid metabolism contributes to the protective function of skin and impaired lipid metabolism compromises the barrier function of the skin [35,53]. In our result, ‘lipid metabolic process’ was remarkably decreased with photo-aging. Especially, genes that have role in epidermal barrier function including LIPN, LIPK, and SMPD3 showed dramatic decreased with photo-aging [24].
The consequences of photo-aging are usually characterized by morphological changes including wrinkle formation or by histological changes in connective tissues [29,30,54,55]. Increased wrinkle formation is the most common phenomenon of aging [56]. In order to generate more wrinkles, vasculature structures are needed to develop. Numerous reports suggested that angiogenesis plays a significant role in inducing wrinkle formation in photo-damaged skin [28,49,54,57,58]. In our result, we discovered that ‘vasculature development’ was increased with photo-aging. Genes that functions critically in this process including TGFBR1, TGFBR2, TGFBR3, KDR, FGF2, and VEGFC showed a trend of increment with photo-aging.
The trait of aged tissue can be described by showing declined mitochondrial biogenesis [59]. For several decades, many scientists suggested the involvement of mitochondria in aging process by showing mitochondrial dysfunction or mtDNA damage with aging [60–62]. In this study, we also demonstrated the correlative data displaying decreased mtDNA copy number with aging in UV-protected and -exposed skin. A clear trend of decrement was exhibited with aging which supported previous studies.
Another decreased biological process due to aging in skin was ‘wound healing’. The correlation between weakened wound healing process and aging was previously reported [33,63–65]. In particular, an in vivo study demonstrated that the rate of wound healing was delayed 20% to 60% with aging [63]. Here, we illustrated the decrement of wound healing related genes including ADIPOR2, NOTCH2, PRKAR2A, PDPK1, MAKG, RXRA, C6orf89, AHNAK2, and CELSR1 with photo-aging together with intrinsic-aging. Moreover, three key genes, NDST1, EXTL3, and XYLT1, that play roles in ‘heparan sulfate proteoglycan biosynthetic process’ which is involved in wound healing also exhibited decrease with aging in UV-protected and -exposed skin which strengthened our result.
In addition, we identified the increased expression level of EDC genes in photo-damaged skin which play an important role in epidermis maturation [16,66]. Jackson et al. described that group 3 LCE genes showed magnificent elevation upon acute UV exposure, especially LCE3C which also displayed similar trend in our analysis. We have also presented that increased levels of many EDC genes including LCEs, SPRRs, and FLG with UV exposure. Additionally, it is well-known that several MMP genes are up-regulated in photo-damaged skin [14,67]. Quan et al. and Waldera et al. showed increment of MMP genes with UV exposure such as MMP2/3/9/11 and MMP1/3/10/14, respectively. These findings corresponded to our result as MMP2, MMP3, MMP8, MMP10, and MMP13 also displayed increased expression level in photo-damaged skin. Increased expression of MMP genes disrupt collagen structure in skin which then leads to impaired skin condition [68]. Interestingly, in our result, a few collagen genes showed up-regulation which suggests that there are a lot more to explore in regards to collagen synthesis and aging.
The era of big data has opened its chapter and biological research using big data can strengthen the outcome in various ways. Sometimes, in experimental research, an experiment is usually performed targeting single or a small number of genes only. Assigning a small number of genes to in-depth study may miss the fact that the functional result of assigned genes might be involved in more than one pathway. As much as the validation of a gene’s biological function is important, transcriptome research, especially with co-expression network analysis, allows us to investigate a group of genes with similar function that regulate a biological pathway in question. Therefore, with aid of experimental data, we believe that our study may further expand the understating of human aging process and facilitate the development of therapeutic targets for skin rejuvenation.
Materials and Methods
Study subjects
GTEx database (V6 release) provided 606 skin samples from suprapubic (n = 250) and lower leg (n = 356) [7,8]. The age groups are from 20s to 70s and they are from both genders and all skin tissue samples were obtained by rapid autopsy from donors. Among them, 22 samples with hair or hair follicles were disregarded to the analysis. Also, seven samples with solar elastosis were eliminated to the analysis to focus on the gene expression changes of normal skin. Therefore, 228 suprapubic and 349 lower leg samples were used (Table 1).
Table 1. Sample information.
| Tissue type | 20s | 30s | 40s | 50s | 60s | 70s | Total |
| Suprapubic (UV protected) | 14 (6.14%) | 18 (7.89%) | 42 (18.42%) | 79 (34.65%) | 72 (31.58%) | 3 (1.32%) | 228 |
| Lower leg (UV exposed) | 29 (8.31%) | 29 (8.31%) | 58 (16.62%) | 117 (33.52%) | 111 (31.81%) | 5 (1.43%) | 349 |
Differentially expressed gene analysis
We discovered differentially expressed genes (DEGs) using DESeq2 [69]. Here, genes with q-value < 0.05, |Log2(fold-change)| ≥ 0.6, and baseMean ≥ 100 were determined as DEGs. Multiple testing was performed by Benjamini-Hochberg method [70].
Weighted gene co-expression network analysis
Weighted gene co-expression network analysis (WGCNA) identified the associations of the gene expression changes in skin with UV exposure status or aging [71]. The variance stabilizing transformed expression values from DESeq2 were used for the analysis [69,72]. Briefly, pairwise correlations between the expression of each gene were used to construct modules which denote the co-expression network. The module eigengene is characterized as the first principal component of each module. To identify the relationship between the modules and the clinical characteristics, the correlations between module eigengenes and clinical traits were determined using the Pearson correlation coefficient. For determining the significance of modules generated from WGCNA, Bonferroni-corrected P-values were used [73]. Using module membership (MM) values, which indicate the high intra-module connectivity within each module, top 10 most correlated genes from each module were listed on Supplemental Tables.
Pathway enrichment analysis
The pathway enrichment analysis computed biologically meaningful pathways using the Molecular Signatures Database (MSigDB) version 6.0 [74]. The gene ontology (GO) biological process database from MSigDB was used in this study [74]. To illustrate the pathway enrichment result, clusterProfiler was used [75]. The significance was determined by the color using q-value and the gene ratio stands for the ratio of enriched genes in each gene set.
Mitochondrial DNA copy number estimation
To estimate mitochondrial copy number, 16 mitochondrial genes (MT-RNR1, MT-RNR2, MT-ND1, MT-ND2, MT-CO1, MT-TS1, MT-CO2, MT-ATP8, MT-ATP6, MT-CO3, MT-ND3, MT-ND4, MT-ND4L, MT-ND5, MT-ND6, MT-CYB) with the average mapped reads higher than 100 were subjected to the analysis. We calculated mitochondrial copy number by averaging 16 mitochondrial RNA (mtRNA) expression values. The association between aging and mtRNA expression were measured by one-way ANOVA and test for Linearity using IBM SPSS Statistics Version 23.0.
Supplementary Materials
Author Contributions
JS designed the study. BC and SY performed bioinformatics analysis. JS, BC, and SY wrote the manuscript.
Conflicts of Interest
The authors have no conflict of interest to declare.
References
- 1. Jenkins G. Molecular mechanisms of skin ageing. Mech Ageing Dev. 2002; 123:801–10. https://doi.org/10.1016/S0047-6374(01)00425-0 [PubMed]
- 2. Kohl E, Steinbauer J, Landthaler M, Szeimies RM. Skin ageing. J Eur Acad Dermatol Venereol. 2011; 25:873–84. https://doi.org/10.1111/j.1468-3083.2010.03963.x [PubMed]
- 3. Glass D, Viñuela A, Davies MN, Ramasamy A, Parts L, Knowles D, Brown AA, Hedman AK, Small KS, Buil A, Grundberg E, Nica AC, Di Meglio P, et al, and MuTHER consortium. Gene expression changes with age in skin, adipose tissue, blood and brain. Genome Biol. 2013; 14:R75. https://doi.org/10.1186/gb-2013-14-7-r75 [PubMed]
- 4. Yang J, Huang T, Petralia F, Long Q, Zhang B, Argmann C, Zhao Y, Mobbs CV, Schadt EE, Zhu J, Tu Z, and GTEx Consortium. Synchronized age-related gene expression changes across multiple tissues in human and the link to complex diseases. Sci Rep. 2015; 5:15145. https://doi.org/10.1038/srep15145 [PubMed]
- 5. Kaisers W, Boukamp P, Stark HJ, Schwender H, Tigges J, Krutmann J, Schaal H. Age, gender and UV-exposition related effects on gene expression in in vivo aged short term cultivated human dermal fibroblasts. PLoS One. 2017; 12:e0175657. https://doi.org/10.1371/journal.pone.0175657 [PubMed]
- 6. Kimball AB, Alora-Palli MB, Tamura M, Mullins LA, Soh C, Binder RL, Houston NA, Conley ED, Tung JY, Annunziata NE, Bascom CC, Isfort RJ, Jarrold BB, et al. Age-induced and photoinduced changes in gene expression profiles in facial skin of Caucasian females across 6 decades of age. J Am Acad Dermatol. 2018; 78:29–39.e7. https://doi.org/10.1016/j.jaad.2017.09.012 [PubMed]
- 7. Lonsdale J, Thomas J, Salvatore M, Phillips R, Lo E, Shad S, Hasz R, Walters G, Garcia F, Young N, Foster B, Moser M, Karasik E, et al, and GTEx Consortium. The Genotype-Tissue Expression (GTEx) project. Nat Genet. 2013; 45:580–85. https://doi.org/10.1038/ng.2653 [PubMed]
- 8. Ardlie KG, Deluca DS, Segre AV, Sullivan TJ, Young TR, Gelfand ET, Trowbridge CA, Maller JB, Tukiainen T, Lek M, Ward LD, Kheradpour P, Iriarte B, et al, and GTEx Consortium. Human genomics. The Genotype-Tissue Expression (GTEx) pilot analysis: multitissue gene regulation in humans. Science. 2015; 348:648–60. https://doi.org/10.1126/science.1262110 [PubMed]
- 9. Lin ZQ, Kondo T, Ishida Y, Takayasu T, Mukaida N. Essential involvement of IL-6 in the skin wound-healing process as evidenced by delayed wound healing in IL-6-deficient mice. J Leukoc Biol. 2003; 73:713–21. https://doi.org/10.1189/jlb.0802397 [PubMed]
- 10. Gallucci RM, Sugawara T, Yucesoy B, Berryann K, Simeonova PP, Matheson JM, Luster MI. Interleukin-6 treatment augments cutaneous wound healing in immunosuppressed mice. J Interferon Cytokine Res. 2001; 21:603–09. https://doi.org/10.1089/10799900152547867 [PubMed]
- 11. Kurow O, Frey B, Schuster L, Schmitt V, Adam S, Hahn M, Gilchrist D, McInnes IB, Wirtz S, Gaipl US, Krönke G, Schett G, Frey S, Hueber AJ. Full length Interleukin 33 aggravates radiation-induced skin reaction. Front Immunol. 2017; 8:722. https://doi.org/10.3389/fimmu.2017.00722 [PubMed]
- 12. Su C, Gao G, Schneider S, Helt C, Weiss C, O’Reilly MA, Bohmann D, Zhao J. DNA damage induces downregulation of histone gene expression through the G1 checkpoint pathway. EMBO J. 2004; 23:1133–43. https://doi.org/10.1038/sj.emboj.7600120 [PubMed]
- 13. Stelnicki EJ, Arbeit J, Cass DL, Saner C, Harrison M, Largman C. Modulation of the human homeobox genes PRX-2 and HOXB13 in scarless fetal wounds. J Invest Dermatol. 1998; 111:57–63. https://doi.org/10.1046/j.1523-1747.1998.00238.x [PubMed]
- 14. Quan T, Little E, Quan H, Qin Z, Voorhees JJ, Fisher GJ. Elevated matrix metalloproteinases and collagen fragmentation in photodamaged human skin: impact of altered extracellular matrix microenvironment on dermal fibroblast function. J Invest Dermatol. 2013; 133:1362–66. https://doi.org/10.1038/jid.2012.509 [PubMed]
- 15. Hoffjan S, Stemmler S. On the role of the epidermal differentiation complex in ichthyosis vulgaris, atopic dermatitis and psoriasis. Br J Dermatol. 2007; 157:441–49. https://doi.org/10.1111/j.1365-2133.2007.07999.x [PubMed]
- 16. Jackson B, Tilli CM, Hardman MJ, Avilion AA, MacLeod MC, Ashcroft GS, Byrne C. Late cornified envelope family in differentiating epithelia--response to calcium and ultraviolet irradiation. J Invest Dermatol. 2005; 124:1062–70. https://doi.org/10.1111/j.0022-202X.2005.23699.x [PubMed]
- 17. Gudjonsson JE, Ding J, Li X, Nair RP, Tejasvi T, Qin ZS, Ghosh D, Aphale A, Gumucio DL, Voorhees JJ, Abecasis GR, Elder JT. Global gene expression analysis reveals evidence for decreased lipid biosynthesis and increased innate immunity in uninvolved psoriatic skin. J Invest Dermatol. 2009; 129:2795–804. https://doi.org/10.1038/jid.2009.173 [PubMed]
- 18. Ewald DA, Malajian D, Krueger JG, Workman CT, Wang T, Tian S, Litman T, Guttman-Yassky E, Suárez-Fariñas M. Meta-analysis derived atopic dermatitis (MADAD) transcriptome defines a robust AD signature highlighting the involvement of atherosclerosis and lipid metabolism pathways. BMC Med Genomics. 2015; 8:60. https://doi.org/10.1186/s12920-015-0133-x [PubMed]
- 19. Cho BA, Yoo SK, Song YS, Kim SJ, Lee KE, Shong M, Park YJ, Seo JS. Transcriptome network analysis reveals aging-related mitochondrial and proteasomal dysfunction and immune activation in human thyroid. Thyroid. 2018; 28:656–66. https://doi.org/10.1089/thy.2017.0359 [PubMed]
- 20. Giordano C, Iommarini L, Giordano L, Maresca A, Pisano A, Valentino ML, Caporali L, Liguori R, Deceglie S, Roberti M, Fanelli F, Fracasso F, Ross-Cisneros FN, et al. Efficient mitochondrial biogenesis drives incomplete penetrance in Leber’s hereditary optic neuropathy. Brain. 2014; 137:335–53. https://doi.org/10.1093/brain/awt343 [PubMed]
- 21. Reznik E, Miller ML, Şenbabaoğlu Y, Riaz N, Sarungbam J, Tickoo SK, Al-Ahmadie HA, Lee W, Seshan VE, Hakimi AA, Sander C. Mitochondrial DNA copy number variation across human cancers. eLife. 2016; 5:5. https://doi.org/10.7554/eLife.10769 [PubMed]
- 22. Rogers J, Harding C, Mayo A, Banks J, Rawlings A. Stratum corneum lipids: the effect of ageing and the seasons. Arch Dermatol Res. 1996; 288:765–70. https://doi.org/10.1007/BF02505294 [PubMed]
- 23. Kim EJ, Kim MK, Jin XJ, Oh JH, Kim JE, Chung JH. Skin aging and photoaging alter fatty acids composition, including 11,14,17-eicosatrienoic acid, in the epidermis of human skin. J Korean Med Sci. 2010; 25:980–83. https://doi.org/10.3346/jkms.2010.25.6.980 [PubMed]
- 24. Toulza E, Mattiuzzo NR, Galliano MF, Jonca N, Dossat C, Jacob D, de Daruvar A, Wincker P, Serre G, Guerrin M. Large-scale identification of human genes implicated in epidermal barrier function. Genome Biol. 2007; 8:R107. https://doi.org/10.1186/gb-2007-8-6-r107 [PubMed]
- 25. Lippens S, Denecker G, Ovaere P, Vandenabeele P, Declercq W. Death penalty for keratinocytes: apoptosis versus cornification. Cell Death Differ. 2005 (Suppl 2); 12:1497–508. https://doi.org/10.1038/sj.cdd.4401722 [PubMed]
- 26. Rinnerthaler M, Bischof J, Streubel MK, Trost A, Richter K. Oxidative stress in aging human skin. Biomolecules. 2015; 5:545–89. https://doi.org/10.3390/biom5020545 [PubMed]
- 27. Chung JH, Eun HC. Angiogenesis in skin aging and photoaging. J Dermatol. 2007; 34:593–600. https://doi.org/10.1111/j.1346-8138.2007.00341.x [PubMed]
- 28. Yano K, Oura H, Detmar M. Targeted overexpression of the angiogenesis inhibitor thrombospondin-1 in the epidermis of transgenic mice prevents ultraviolet-B-induced angiogenesis and cutaneous photo-damage. J Invest Dermatol. 2002; 118:800–05. https://doi.org/10.1046/j.1523-1747.2002.01752.x [PubMed]
- 29. Imokawa G. Epithelial-mesenchymal interaction mechanisms leading to the over-expression of neprilysin are involved in the UVB-induced formation of wrinkles in the skin. Exp Dermatol. 2016 (Suppl 3); 25:2–13. https://doi.org/10.1111/exd.13083 [PubMed]
- 30. Hirakawa S, Fujii S, Kajiya K, Yano K, Detmar M. Vascular endothelial growth factor promotes sensitivity to ultraviolet B-induced cutaneous photodamage. Blood. 2005; 105:2392–99. https://doi.org/10.1182/blood-2004-06-2435 [PubMed]
- 31. Varani J, Dame MK, Rittie L, Fligiel SE, Kang S, Fisher GJ, Voorhees JJ. Decreased collagen production in chronologically aged skin: roles of age-dependent alteration in fibroblast function and defective mechanical stimulation. Am J Pathol. 2006; 168:1861–68. https://doi.org/10.2353/ajpath.2006.051302 [PubMed]
- 32. Levakov A, Vucković N, Dolai M, Kaćanski MM, Bozanić S. Age-related skin changes. Med Pregl. 2012; 65:191–95. https://doi.org/10.2298/MPNS1206191L [PubMed]
- 33. McGrath JA, Eady RA. Heparan sulphate proteoglycan and wound healing in skin. J Pathol. 1997; 183:251–52. https://doi.org/10.1002/(SICI)1096-9896(199711)183:3<251::AID-PATH969>3.0.CO;2-H [PubMed]
- 34. Ghatak S, Maytin EV, Mack JA, Hascall VC, Atanelishvili I, Moreno Rodriguez R, Markwald RR, Misra S. Roles of proteoglycans and glycosaminoglycans in wound healing and fibrosis. Int J Cell Biol. 2015; 2015:834893. https://doi.org/10.1155/2015/834893 [PubMed]
- 35. Kruse V, Neess D, Færgeman NJ. The significance of epidermal lipid metabolism in whole-body physiology. Trends Endocrinol Metab. 2017; 28:669–83. https://doi.org/10.1016/j.tem.2017.06.001 [PubMed]
- 36. Luebberding S, Krueger N, Kerscher M. Age-related changes in skin barrier function - quantitative evaluation of 150 female subjects. Int J Cosmet Sci. 2013; 35:183–90. https://doi.org/10.1111/ics.12024 [PubMed]
- 37. Plein A, Fantin A, Ruhrberg C. Neuropilin regulation of angiogenesis, arteriogenesis, and vascular permeability. Microcirculation. 2014; 21:315–23. https://doi.org/10.1111/micc.12124 [PubMed]
- 38. Liu X, Zhao Y, Gao J, Pawlyk B, Starcher B, Spencer JA, Yanagisawa H, Zuo J, Li T. Elastic fiber homeostasis requires lysyl oxidase-like 1 protein. Nat Genet. 2004; 36:178–82. https://doi.org/10.1038/ng1297 [PubMed]
- 39. Liu F, Smith J, Zhang Z, Cole R, Herron BJ. Genetic heterogeneity of skin microvasculature. Dev Biol. 2010; 340:480–89. https://doi.org/10.1016/j.ydbio.2010.02.003 [PubMed]
- 40. Bignon M, Pichol-Thievend C, Hardouin J, Malbouyres M, Bréchot N, Nasciutti L, Barret A, Teillon J, Guillon E, Etienne E, Caron M, Joubert-Caron R, Monnot C, et al. Lysyl oxidase-like protein-2 regulates sprouting angiogenesis and type IV collagen assembly in the endothelial basement membrane. Blood. 2011; 118:3979–89. https://doi.org/10.1182/blood-2010-10-313296 [PubMed]
- 41. Zhou Y, Nathans J. Gpr124 controls CNS angiogenesis and blood-brain barrier integrity by promoting ligand-specific canonical wnt signaling. Dev Cell. 2014; 31:248–56. https://doi.org/10.1016/j.devcel.2014.08.018 [PubMed]
- 42. Shoulders MD, Raines RT. Collagen structure and stability. Annu Rev Biochem. 2009; 78:929–58. https://doi.org/10.1146/annurev.biochem.77.032207.120833 [PubMed]
- 43. Farage MA, Miller KW, Elsner P, Maibach HI. Intrinsic and extrinsic factors in skin ageing: a review. Int J Cosmet Sci. 2008; 30:87–95. https://doi.org/10.1111/j.1468-2494.2007.00415.x [PubMed]
- 44. Phillips TJ, Demircay Z, Sahu M. Hormonal effects on skin aging. Clin Geriatr Med. 2001; 17:661–72. https://doi.org/10.1016/S0749-0690(05)70092-6
- 45. Thornton MJ. Estrogens and aging skin. Dermatoendocrinol. 2013; 5:264–70. https://doi.org/10.4161/derm.23872 [PubMed]
- 46. de Vries M, Faiz A, Woldhuis RR, Postma DS, de Jong TV, Sin DD, Bossé Y, Nickle DC, Guryev V, Timens W, van den Berge M, Brandsma CA. Lung tissue gene-expression signature for the ageing lung in COPD. Thorax. 2017. https://doi.org/ https://doi.org/10.1136/thoraxjnl-2017-210074
- 47. White RR, Milholland B, MacRae SL, Lin M, Zheng D, Vijg J. Comprehensive transcriptional landscape of aging mouse liver. BMC Genomics. 2015; 16:899. https://doi.org/10.1186/s12864-015-2061-8 [PubMed]
- 48. Alfego D, Rodeck U, Kriete A. Global mapping of transcription factor motifs in human aging. PLoS One. 2018; 13:e0190457. https://doi.org/10.1371/journal.pone.0190457 [PubMed]
- 49. Yano K, Kajiya K, Ishiwata M, Hong YK, Miyakawa T, Detmar M. Ultraviolet B-induced skin angiogenesis is associated with a switch in the balance of vascular endothelial growth factor and thrombospondin-1 expression. J Invest Dermatol. 2004; 122:201–08. https://doi.org/10.1046/j.0022-202X.2003.22101.x [PubMed]
- 50. Young AR. Acute effects of UVR on human eyes and skin. Prog Biophys Mol Biol. 2006; 92:80–85. https://doi.org/10.1016/j.pbiomolbio.2006.02.005 [PubMed]
- 51. Matts PJ, Fink B. Chronic sun damage and the perception of age, health and attractiveness. Photochem Photobiol Sci. 2010; 9:421–31. https://doi.org/10.1039/b9pp00166b [PubMed]
- 52. Boireau-Adamezyk E, Baillet-Guffroy A, Stamatas GN. Age-dependent changes in stratum corneum barrier function. Skin Res Technol. 2014; 20:409–15. https://doi.org/10.1111/srt.12132 [PubMed]
- 53. Feingold KR. The outer frontier: the importance of lipid metabolism in the skin. J Lipid Res. 2009 (Suppl ); 50:S417–22. https://doi.org/10.1194/jlr.R800039-JLR200 [PubMed]
- 54. Kawada S, Ohtani M, Ishii N. Increased oxygen tension attenuates acute ultraviolet-B-induced skin angiogenesis and wrinkle formation. Am J Physiol Regul Integr Comp Physiol. 2010; 299:R694–701. https://doi.org/10.1152/ajpregu.00199.2010 [PubMed]
- 55. Nakamura M, Haarmann-Stemmann T, Krutmann J, Morita A. Alternative test models for skin ageing research. Exp Dermatol. 2018; 27:495–500. https://doi.org/10.1111/exd.13519 [PubMed]
- 56. Tsuji T, Yorifuji T, Hayashi Y, Hamada T. Light and scanning electron microscopic studies on wrinkles in aged persons’ skin. Br J Dermatol. 1986; 114:329–35. https://doi.org/10.1111/j.1365-2133.1986.tb02824.x [PubMed]
- 57. Inomata S, Matsunaga Y, Amano S, Takada K, Kobayashi K, Tsunenaga M, Nishiyama T, Kohno Y, Fukuda M. Possible involvement of gelatinases in basement membrane damage and wrinkle formation in chronically ultraviolet B-exposed hairless mouse. J Invest Dermatol. 2003; 120:128–34. https://doi.org/10.1046/j.1523-1747.2003.12021.x [PubMed]
- 58. Li Y, Bi Z, Yan B, Wan Y. UVB radiation induces expression of HIF-1alpha and VEGF through the EGFR/PI3K/DEC1 pathway. Int J Mol Med. 2006; 18:713–19. [PubMed]
- 59. Payne BA, Chinnery PF. Mitochondrial dysfunction in aging: much progress but many unresolved questions. Biochim Biophys Acta. 2015; 1847:1347–53. https://doi.org/10.1016/j.bbabio.2015.05.022 [PubMed]
- 60. Harman D. Aging: a theory based on free radical and radiation chemistry. J Gerontol. 1956; 11:298–300. https://doi.org/10.1093/geronj/11.3.298 [PubMed]
- 61. Birch-Machin MA. The role of mitochondria in ageing and carcinogenesis. Clin Exp Dermatol. 2006; 31:548–52. https://doi.org/10.1111/j.1365-2230.2006.02161.x [PubMed]
- 62. Naidoo K, Hanna R, Birch-Machin MA. What is the role of mitochondrial dysfunction in skin photoaging? Exp Dermatol. 2018; 27:124–28. https://doi.org/10.1111/exd.13476 [PubMed]
- 63. Passaniti A, Taylor RM, Pili R, Guo Y, Long PV, Haney JA, Pauly RR, Grant DS, Martin GR. A simple, quantitative method for assessing angiogenesis and antiangiogenic agents using reconstituted basement membrane, heparin, and fibroblast growth factor. Lab Invest. 1992; 67:519–28. [PubMed]
- 64. Ashcroft GS, Horan MA, Ferguson MW. Aging is associated with reduced deposition of specific extracellular matrix components, an upregulation of angiogenesis, and an altered inflammatory response in a murine incisional wound healing model. J Invest Dermatol. 1997; 108:430–37. https://doi.org/10.1111/1523-1747.ep12289705 [PubMed]
- 65. Gosain A, DiPietro LA. Aging and wound healing. World J Surg. 2004; 28:321–26. https://doi.org/10.1007/s00268-003-7397-6 [PubMed]
- 66. Cabral A, Sayin A, de Winter S, Fischer DF, Pavel S, Backendorf C. SPRR4, a novel cornified envelope precursor: UV-dependent epidermal expression and selective incorporation into fragile envelopes. J Cell Sci. 2001; 114:3837–43. [PubMed]
- 67. Waldera Lupa DM, Kalfalah F, Safferling K, Boukamp P, Poschmann G, Volpi E, Götz-Rösch C, Bernerd F, Haag L, Huebenthal U, Fritsche E, Boege F, Grabe N, et al. Characterization of Skin Aging-Associated Secreted Proteins (SAASP) produced by dermal fibroblasts isolated from intrinsically aged human skin. J Invest Dermatol. 2015; 135:1954–68. https://doi.org/10.1038/jid.2015.120 [PubMed]
- 68. Murphree RW. Impairments in Skin Integrity. Nurs Clin North Am. 2017; 52:405–17. https://doi.org/10.1016/j.cnur.2017.04.008 [PubMed]
- 69. Love MI, Huber W, Anders S. Moderated estimation of fold change and dispersion for RNA-seq data with DESeq2. Genome Biol. 2014; 15:550. https://doi.org/10.1186/s13059-014-0550-8 [PubMed]
- 70. Benjamini Y, Drai D, Elmer G, Kafkafi N, Golani I. Controlling the false discovery rate in behavior genetics research. Behav Brain Res. 2001; 125:279–84. https://doi.org/10.1016/S0166-4328(01)00297-2 [PubMed]
- 71. Langfelder P, Horvath S. WGCNA: an R package for weighted correlation network analysis. BMC Bioinformatics. 2008; 9:559. https://doi.org/10.1186/1471-2105-9-559 [PubMed]
- 72. Lin SM, Du P, Huber W, Kibbe WA. Model-based variance-stabilizing transformation for Illumina microarray data. Nucleic Acids Res. 2008; 36:e11. https://doi.org/10.1093/nar/gkm1075 [PubMed]
- 73. Bland JM, Altman DG. Multiple significance tests: the Bonferroni method. BMJ. 1995; 310:170. https://doi.org/10.1136/bmj.310.6973.170 [PubMed]
- 74. Subramanian A, Tamayo P, Mootha VK, Mukherjee S, Ebert BL, Gillette MA, Paulovich A, Pomeroy SL, Golub TR, Lander ES, Mesirov JP. Gene set enrichment analysis: a knowledge-based approach for interpreting genome-wide expression profiles. Proc Natl Acad Sci USA. 2005; 102:15545–50. https://doi.org/10.1073/pnas.0506580102 [PubMed]
- 75. Yu G, Wang LG, Han Y, He QY. clusterProfiler: an R package for comparing biological themes among gene clusters. OMICS. 2012; 16:284–87. https://doi.org/10.1089/omi.2011.0118 [PubMed]