


Introduction
For thousands of years, humans have pursued increased longevity. However, increasing the longevity of the human population has been unlikely. In recent years, with the increase in social economic levels and an ageing population, the likelihood of an increase in human longevity is gradually increasing and is becoming the focus of people’s attention. As we know, human longevity is determined by both genetic and environmental factors, but its genetics and the environment causes, particularly their interaction mechanism, are still not clear. Therefore, it is necessary to develop the study and obtain supportive data for us to be able to provide inspiration and direction for future research in the field of longevity and anti-aging.
A long-lived population provides a good healthy ageing model for understanding how the body begins to age and the process of ageing. Several previous studies, both cross-sectional and follow-up, investigated long-lived subjects who usually manage to delay major age-related diseases, such as metabolic-related diseases (cardiovascular disease, diabetes, and neurodegeneration disorders); in general, these age-related diseases had high morbidity and mortality, but most centenarians escape these diseases [1–3] and successfully exhibit a healthy ageing state.
The common view is that human longevity is determined by genetic factors. Several Genome-wide association studies (GWAS) in European, North American and Chinese individuals identified some loci associated with longevity, i.e., TOMM40/APOE/APOC1 loci, 5q33.3, IL6 and ANKRD20A9P in recent years [4–6]. With next-generation sequencing (NGS), we have an efficient way to discover the potential causal loci in the search for sequence variants. NGS technology has facilitated the identification of variants and shown that HLA-DQB1*05 and HLA-DQB1*03 were associated with longevity in Japanese individuals [7,8]. Previous studies of longevity genetics found that with increasing age, the contribution of heredity increased [9].
Along with ageing or senescence, the internal environment function of each hierarchy and each system is low and disordered, but there is still a lack of explicit evidence to define the genetically encoded program of ageing that functions to maintain the homeostasis of the human body, i.e., the plasma lipoproteins, in vivo.
The metabolism and balance of plasma lipids are very important to life and physiologic functional turnover. They are also the representative biomarker for cholesterol metabolism and lipid-related diseases such as cardiovascular and cerebrovascular diseases. A number of studies have shown that the plasma lipid levels were controlled by genetic factors and identified some associated variants of lipid levels, both common and rare [10–12]; for example, HLA-DQB1 variations were associated with plasma lipid balance in coronary heart disease risk [13], but there are no reports on genetic variants and plasma lipids associated with healthy longevity.
Therefore, we postulated that longer human survivors, who live to a median age of over 90 years, have a higher number of longevity genetic variants; briefly, ageing and longevity genetic variants serve as important biomarkers to represent the normal plasma lipid homeostasis in the internal environment of extremely elderly individuals. Therefore, based on our longevity cohort study in southern China, we developed a comparative study using a case-control design to detect the relationship between longevity-associated variants and plasma lipid levels in our long-lived individuals in China. Our study aims to suggest that a healthy lipid balance linked to genetic variants in long-lived individuals could play an important part in human longevity, and our data will provide new knowledge to help us understand human longevity and the possible potential applications for anti-aging primary care in social communities of the elderly.
Results
Baseline information in longevity and control subjects
There were significant differences in HDL-c (P=0.003), LDL-c (P=0.010), TG (P=3.052×10⁻⁴) and TC (P=0.012) between centenarians and controls. We detected that HDL-c (P=1.461×10⁻⁷), LDL-c (P=2.128×10⁻⁴) and TC (P=8.181×10⁻⁶) were significantly different between nonagenarians and controls. A comparison of longevity (centenarians and nonagenarians) in samples and controls, revealed that significant differences between HDL-c (P=3.438×10⁻⁹), LDL-c (P=1.269×10⁻⁵), TG (P=0.035) and TC (P=6.522×10⁻⁷) had been found. (Supplementary Table 1)
Identifying the new longevity-associated genetic variations
Whole-exome sequence screening in 100 longevity subjects
By whole exome sequence in 100 longevity subjects involving 74 nonagenarians and 26 centenarians, we compared both genomic differences between long-lived individuals and our genotype database of general Chinese (age <60 years, n=1000), and we primarily identified 2171 possible longevity-associated variants.
Bioinformatic and arrangement analysis
Aligning with GenBank, the analysis of the collection and arrangement of bioinformation based on the LongevityMap database [14] reported possible longevity variants, and we selected 17 genes with 26 variants as our longevity-associated candidate genes (SSupplementary Table 2). A flow chart of the consecutive analysis steps is depicted in Figure 1.
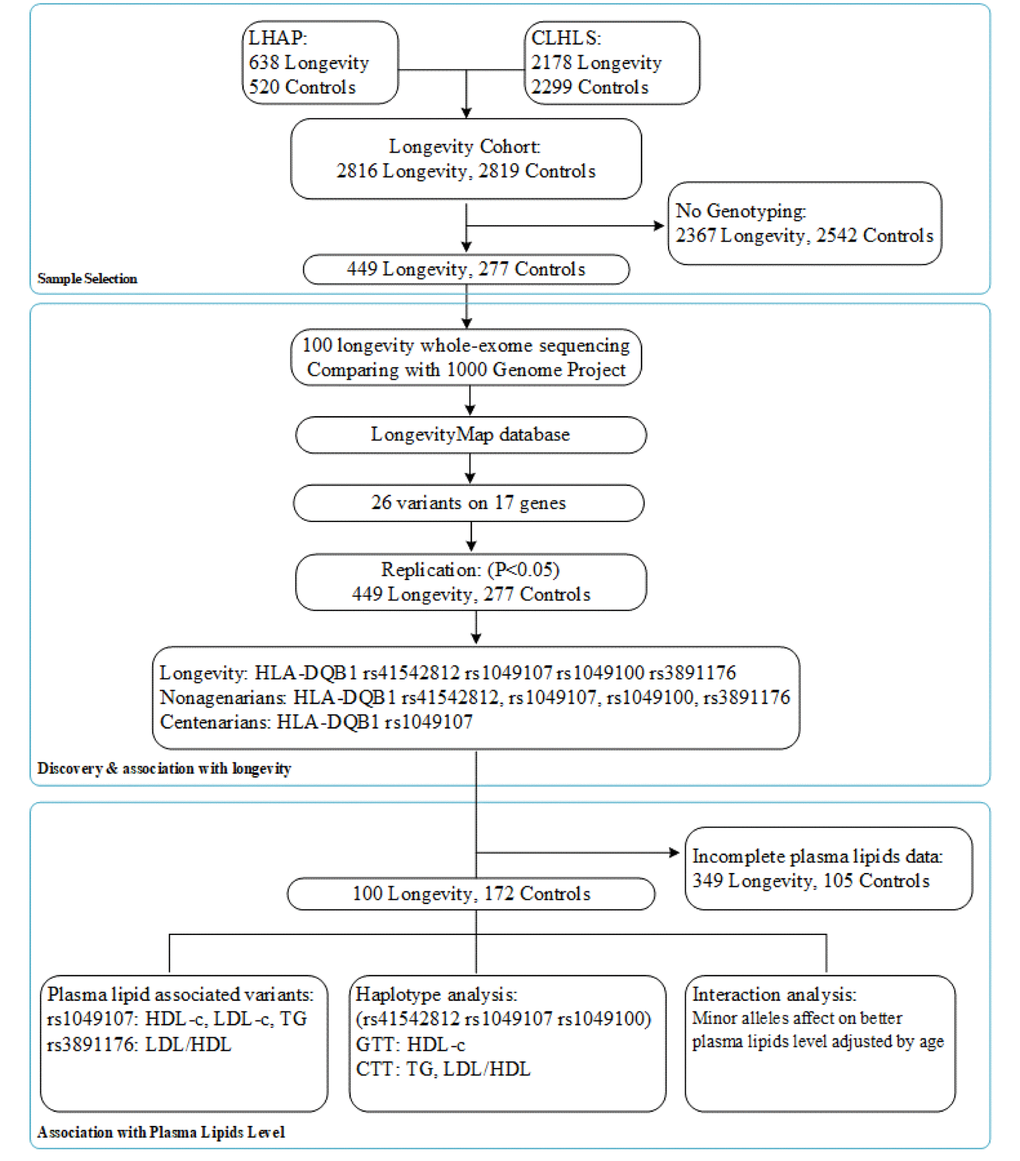
Figure 1. A flow chart of the consecutive analysis steps.
Identified new longevity-associated variants in HLA-DQB1
Through an association study based on genotyping longevity and a local younger population, we identified four genetic variants in HLA-DQB1 as longevity-associated gene variants. Four variants in HLA-DQB1 showed significant difference in allele and genotype frequencies between longevity and controls. These variants include rs41542812, rs1049107, rs1049100 and rs3891176, and this result was detected in a sample set what contained 518 longevities and 277 controls, rs41542812 (Pallele=0.048, Pgenotype=0.003); rs1049107 (Pallele=0.002, Pgenotype=0.007); rs1049100 (Pallele=4.731×10⁻⁴, Pgenotype=0.002); and rs3891176 (Pallele=2.811×10⁻⁸, Pgenotype=4.033×10⁻⁸ (Table 1).
Table 1. Association of variants and longevity.
| Major allele | Minor allele | Major homo | Hetro | Minor home | ||||||
| Case/Control | Case/Control | P | OR | 95%CI | Case/Control | Case/Control | Case/Control | P | ||
| Longevity vs. Controls | rs41542812 | 114/51 | 786/499 | 0.048 | 1.419 | (1.001-2.011) | 364/229 | 56/51 | 29/5 | 0.003 |
| rs1049107 | 199/86 | 653/440 | 0.002 | 1.559 | 1.178-2.064 | 278/190 | 97/60 | 51/13 | 0.007 | |
| rs1049100 | 205/85 | 647/441 | 4.731×10⁻⁴ | 1.644 | 1.242-2.176 | 275/190 | 97/61 | 54/12 | 0.002 | |
| rs3891176 | 248/84 | 600/440 | 2.811×10⁻⁸ | 2.165 | 1.642-2.854 | 253/186 | 94/68 | 77/8 | 4.033×10⁻⁸ | |
| Nonagenarians vs. Controls | rs41542812 | 48/51 | 262/499 | 0.006 | 1.793 | 1.176 -2.732 | 123/229 | 16/51 | 16/5 | 6.652×10⁻⁵ |
| rs1049107 | 85/86 | 203/440 | 1.041×10⁻⁵ | 2.142 | 1.521-3.018 | 90/190 | 60/60 | 31/13 | 5.249×10⁻⁷ | |
| rs1049100 | 89/85 | 199/441 | 9.297×10⁻⁷ | 2.320 | 1.650-3.264 | 88/190 | 23/61 | 33/12 | 9.258×10⁻⁸ | |
| rs3891176 | 151/84 | 141/440 | 3.832×10⁻²⁷ | 5.610 | 4.044-7.782 | 63/186 | 25/68 | 58/8 | 6.193×10⁻²¹ | |
| Centenarians vs. Controls | rs41542812 | 66/51 | 524/499 | 0.287 | 1.232 | 838-1.812 | 242/229 | 40/51 | 13/5 | 0.079 |
| rs1049107 | 114/86 | 450/440 | 0.001 | 1.296 | 0.951-1.766 | 188/190 | 74/60 | 20/13 | 0.317 | |
| rs1049100 | 116/85 | 448/441 | 0.061 | 1.343 | 0.986-1.830 | 187/190 | 74/61 | 21/12 | 0.215 | |
| rs3891176 | 107/84 | 449/440 | 0.166 | 1.248 | 0.911-1.710 | 190/186 | 69/68 | 19/8 | 0.131 |
Identified longevity-associated variation with ageing
We detected that rs41542812 (Pallele=0.006, Pgenotype=6.652×10⁻⁵), rs1049107 (Pallele=1.041×10⁻⁵, Pgenotype=5.249×10⁻⁷), rs1049100 (Pallele=9.297×10⁻⁷, Pgenotype=9.258×10⁻⁸) and rs3891176 (Pallele=3.832×10⁻²⁷, Pgenotype=6.193×10⁻²¹) were associated with nonagenarians. Thus, rs1049107 (Pallele=0.001, Pgenotype=0.317) was associated with centenarians (Table 1; Figure 2).
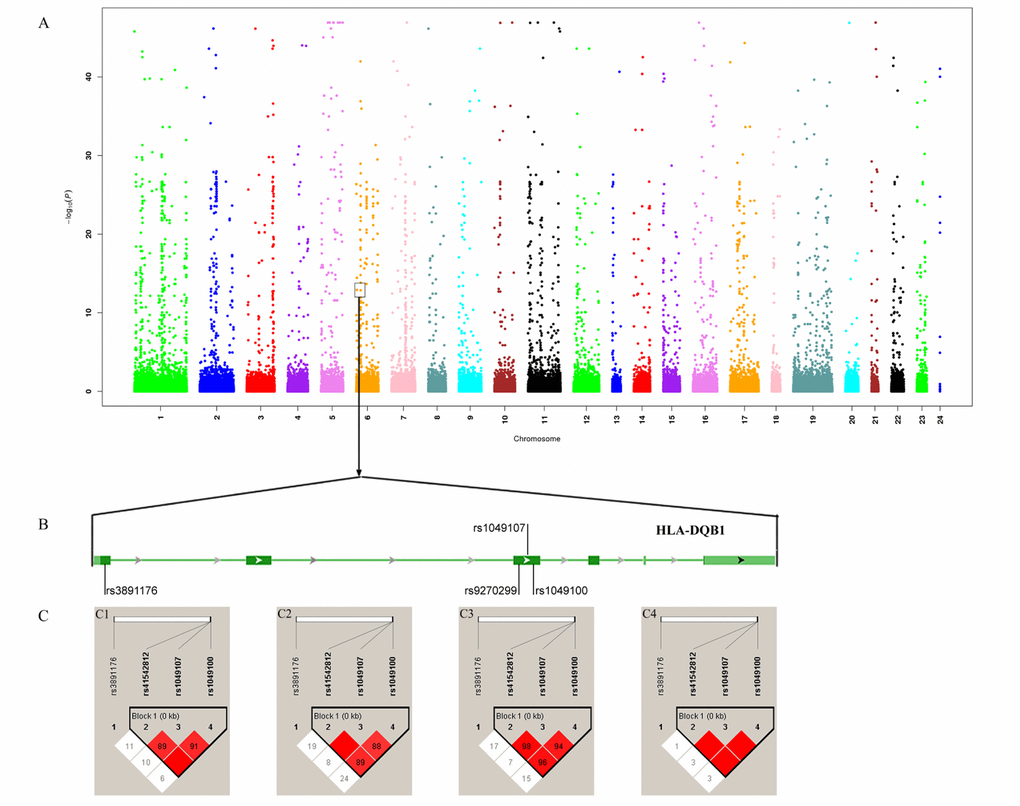
Figure 2. Association analysis identified HLA-DQB1 as longevity-associated gene. (A) Manhattan map of whole-exome sequencing; (B) Four variants in HLA-DQB1; (C) Linkage disequilibrium analysis of four variants. C1 LD map of centenarians; C1 LD map of nonagenarians; C3: LD map of longevity; C4: LD map of controls.
Identified longevity-associated haplotypes
The link disequilibrium analysis detected that there was a block, formed by rs41542812, rs1049107 and rs1049100, on HLA-DQB1 (Figure 2). There were three haplotypes with frequencies >0.03. Compared with the CCC haplotype, the GTT and CTT haplotypes could increase the chance of longevity (P=3.996×10⁹, OR: 4.367, 95%CI: 2.608-7.313; P=1.812×10⁵, OR: 3.677, 95%CI: 1.970-6.865). Comparing between centenarians and controls, the GTT and CTT haplotypes were associated with centenarians (P=3.327×10⁸, OR:6.484, 95%CI:3.128-13.440; and P=0.025, OR:3.373, 95%CI: 1.234-9.216, respectively). In nonagenarians, the GTT and CTT haplotypes would increase the chance to reach a nonagenarian age (P=1.921×10⁶, OR:3.721, 95%CI: 2.116-6.543; and P=3.604×10⁵, OR:3.770, 95%CI: 1.945-7.308, respectively; Supplementary Table 3).
Relationship of longevity-associated variants and plasma lipid homeostasis
For rs1049107, Supplementary Table 4 shows the proportion of participants with different plasma lipid levels, normal or abnormal, and LDL-c/HDL-c ratios ≤2 and those >2, according to the polymorphism genotypes. The rs1049107 T allele was associated with a lower LDL-c/HDL-c ratio (P=0.047, OR: 1.901) in the longevity group.
In HDL-c subgroups of longevity samples, the rs1049107 TT genotype samples and T allele carriers showed a better HDL-c level than did the rs1049107 CC genotype samples (P=0.007, OR: 10.636; P=0.006, OR: 11.277). The normal HDL-c subgroup contained a higher rs1049107 T allele proportion (P=1.458×10⁻⁴, OR: 10.689), but this subgroup also had a lower rs3891176 C allele ratio than the major allele (P=0.013, OR: 0.360).
The combined rs1049107 genotype (TT+CT) in the control group, assuming a dominant effect of the T allele, was associated with a higher LDL-c level (P=1.243×10⁻⁷, OR: 0.098). In longevity group rs1049107 CT and rs1049100 CT, the genotype was associated with a higher TG level (P=9.095×10⁻⁷, OR: 0.025; P=1.799×10⁻⁶, 0.028), but it was opposite in the controls (P=0.004, OR: 11.667; P=0.004, OR: 11.667) compared with major homozygotes.
Overall, the dominant effect of the rs1049107 T allele was associated with a normal HDL-c level (P=0.001, OR: 72.757,95%CI: 4.378-984.360) and a higher TG level (P=0.035, OR: 0.312, 95%CI: 0.105-0.924) in the longevity group and with a higher LDL-c level in controls (P=0.050, OR: 0.383, 95%CI: 0.147-0.999) by a logistic regression analysis.
For the rs3891176 CA genotype, the dominant effect of the variant C allele and rs3891176 C allele were associated with a lower LDL-c/HDL-c ratio (Supplementary Table 3) by a logistic regression analysis, and the dominant effect of the rs3891176 C allele was associated with a lower LDL-c/HDL-c ratio (P=0.034, OR: 2.402, 95%CI: 1.068-5.402). Furthermore, in the longevity group, we detected that major homozygotes of rs3891176 had significantly higher HDL-c levels compared to minor allele carriers (P=0.044) (Table 2).
Table 2. Allele and genotype distribution analysis in different plasma lipids level group.
| Longevity | Control | ||||||||||||
| HDL>1.04 | HDL<=1.04 | P | OR | 95%CI | HDL>1.04 | HDL<=1.04 | P | OR | 95%CI | ||||
| rs41542812 | CC | 59 | 12 | ref | 98 | 29 | ref | ||||||
| GC | 3 | 1 | 0.541 | 0.610 | 0.058-6.377 | 14 | 8 | 0.175 | 0.518 | 0.198-1.356 | |||
| GG | 20 | 1 | 0.285 | 4.068 | 0.497-33.288 | 3 | 0 | 1.000 | 1.212 | 0.13-11.262 | |||
| GG+GC | 23 | 2 | 0.278 | 2.339 | 0.485-11.272 | 17 | 8 | 0.329 | 0.629 | 0.246-1.605 | |||
| CC+GC | 62 | 13 | 0.291 | 0.238 | 0.029-1.939 | 112 | 37 | 1.000 | 0.743 | 0.081-6.858 | |||
| C | 121 | 25 | ref | 210 | 66 | ref | |||||||
| G | 43 | 3 | 0.076 | 2.961 | 0.851-10.306 | 20 | 8 | 0.584 | 0.786 | 0.331-1.867 | |||
| rs1049107 | CC | 44 | 13 | ref | 80 | 24 | ref | ||||||
| CT | 2 | 0 | 0.954 | 0.933 | 0.090-9.702 | 25 | 11 | 0.372 | 0.682 | 0.293-1.584 | |||
| TT | 36 | 1 | 0.007 | 10.636 | 1.327-85.232 | 4 | 0 | 1.000 | 1.543 | 0.172-13.835 | |||
| TT+CT | 38 | 1 | 0.006 | 11.227 | 1.403-89.846 | 29 | 11 | 0.579 | 0.791 | 0.345-1.815 | |||
| CC+CT | 46 | 13 | 0.009 | 0.098 | 0.012-0.787 | 105 | 35 | 1.000 | 0.589 | 0.067-5.210 | |||
| C | 90 | 26 | ref | 185 | 59 | ref | |||||||
| T | 74 | 2 | 1.458×10⁻⁴ | 10.689 | 2.456-46.523 | 33 | 11 | 0.907 | 0.957 | 0.455-2.011 | |||
| rs1049100 | CC | 44 | 9 | ref | 80 | 24 | ref | ||||||
| CT | 1 | 1 | 0.333 | 0.205 | 0.012-3.583 | 25 | 11 | 0.372 | 0.682 | 0.293-1.584 | |||
| TT | 37 | 4 | 0.314 | 1.892 | 0.539-6.646 | 4 | 0 | 1.000 | 1.543 | 0.172-13.835 | |||
| TT+CT | 38 | 5 | 0.460 | 1.555 | 0.479-5.04 | 29 | 11 | 0.579 | 0.791 | 0.345-1.815 | |||
| CC+CT | 45 | 10 | 0.247 | 0.486 | 0.141-1.678 | 105 | 35 | 1.000 | 0.589 | 0.067-5.210 | |||
| C | 89 | 19 | ref | 185 | 59 | ref | |||||||
| T | 75 | 9 | 0.180 | 1.779 | 0.760-4.164 | 33 | 11 | 0.907 | 0.957 | 0.455-2.011 | |||
| rs3891176 | AA | 57 | 7 | ref | 73 | 25 | ref | ||||||
| CA | 11 | 1 | 1.000 | 1.351 | 0.151-12.1 | 28 | 7 | 0.513 | 1.370 | 0.533-3.523 | |||
| CC | 14 | 6 | 0.070 | 0.287 | 0.083-0.987 | 7 | 0 | 0.455 | 2.849 | 0.34-23.893 | |||
| CC+CA | 25 | 7 | 0.219 | 0.439 | 0.139-1.383 | 35 | 7 | 0.253 | 1.712 | 0.676-4.34 | |||
| AA+CA | 68 | 8 | 0.068 | 3.643 | 1.092-12.152 | 101 | 32 | 0.686 | 0.386 | 0.047-3.205 | |||
| A | 125 | 15 | ref | 174 | 57 | ref | |||||||
| C | 39 | 13 | 0.013 | 0.360 | 0.158-0.822 | 42 | 7 | 0.116 | 1.966 | 0.837-4.618 | |||
| LDL<3.12 | LDL>=3.12 | P | OR | 95%CI | LDL<3.12 | LDL>=3.12 | P | OR | 95%CI | ||||
| rs41542812 | CC | 44 | 27 | ref | 105 | 22 | ref | ||||||
| GC | 4 | 0 | 0.406 | 3.111 | 0.345-28.029 | 19 | 3 | 1.000 | 1.327 | 0.361-4.876 | |||
| GG | 15 | 6 | 0.427 | 1.534 | 0.531-4.433 | 3 | 0 | 1.000 | 0.868 | 0.093-8.13 | |||
| GG+GC | 19 | 6 | 0.204 | 1.943 | 0.690-5.472 | 22 | 3 | 0.512 | 1.537 | 0.423-5.587 | |||
| CC+GC | 48 | 27 | 0.526 | 0.711 | 0.247-2.048 | 124 | 25 | ||||||
| C | 92 | 54 | ref | 229 | 47 | ref | |||||||
| G | 34 | 12 | 0.175 | 1.663 | 0.794-3.482 | 25 | 3 | 0.592 | 1.710 | 0.496-5.898 | |||
| rs1049107 | CC | 34 | 23 | ref | 89 | 15 | ref | ||||||
| CT | 2 | 0 | 1.000 | 2.057 | 0.202-20.975 | 28 | 8 | 0.276 | 0.590 | 0.226-1.537 | |||
| TT | 27 | 10 | 0.186 | 1.826 | 0.744-4.483 | 3 | 1 | 0.479 | 0.506 | 0.049-5.188 | |||
| TT+CT | 29 | 10 | 0.136 | 1.962 | 0.804-4.789 | 31 | 9 | 0.244 | 0.581 | 0.231-1.46 | |||
| CC+CT | 36 | 23 | 0.230 | 0.580 | 0.237-1.418 | 117 | 23 | ||||||
| C | 70 | 46 | ref | 206 | 38 | ref | |||||||
| T | 56 | 20 | 0.057 | 1.840 | 0.978-3.461 | 34 | 10 | 0.626 | 1.219 | 0.55-2.703 | |||
| rs1049100 | CC | 32 | 21 | ref | 89 | 15 | ref | ||||||
| CT | 2 | 0 | 1.000 | 2.000 | 0.195-20.486 | 28 | 8 | 0.276 | 0.590 | 0.226-1.537 | |||
| TT | 29 | 12 | 0.297 | 1.586 | 0.665-3.783 | 3 | 1 | 0.479 | 0.506 | 0.049-5.188 | |||
| TT+CT | 31 | 12 | 0.229 | 1.695 | 0.714-4.024 | 31 | 9 | 0.244 | 0.581 | 0.231-1.46 | |||
| CC+CT | 34 | 21 | 0.363 | 0.670 | 0.282-1.591 | 117 | 23 | ||||||
| C | 66 | 42 | ref | 206 | 38 | ref | |||||||
| T | 60 | 24 | 0.135 | 1.591 | 0.863-2.932 | 34 | 10 | 0.626 | 1.219 | 0.55-2.703 | |||
| rs3891176 | AA | 43 | 21 | ref | 79 | 19 | ref | ||||||
| CA | 7 | 5 | 0.741 | 0.684 | 0.194-2.412 | 32 | 3 | 0.139 | 2.565 | 0.71-9.273 | |||
| CC | 13 | 7 | 0.856 | 0.907 | 0.315-2.609 | 4 | 3 | 0.158 | 0.321 | 0.066-1.555 | |||
| CC+CA | 20 | 12 | 0.649 | 0.814 | 0.336-1.974 | 36 | 6 | 0.470 | 1.443 | 0.531-3.918 | |||
| AA+CA | 50 | 26 | 1.000 | 1.036 | 0.368-2.912 | 111 | 22 | ||||||
| A | 93 | 47 | ref | 190 | 41 | ref | |||||||
| C | 33 | 19 | 0.700 | 0.878 | 0.452-1.706 | 40 | 9 | 0.918 | 0.959 | 0.432-2.13 | |||
| TG<1.7 | TG>=1.7 | P | OR | 95%CI | TG<1.7 | TG>=1.7 | P | OR | 95%CI | ||||
| rs41542812 | CC | 58 | 13 | ref | 89 | 38 | ref | ||||||
| GC | 3 | 1 | 0.738 | 0.672 | 0.065-6.993 | 13 | 9 | 0.306 | 0.617 | 0.243-1.565 | |||
| GG | 17 | 4 | 0.939 | 0.953 | 0.275-3.306 | 3 | 0 | 1.000 | 1.733 | 0.188-16.012 | |||
| GG+GC | 20 | 5 | 1.000 | 0.897 | 0.284-2.831 | 16 | 9 | 0.531 | 0.751 | 0.305-1.847 | |||
| CC+GC | 61 | 14 | 0.287 | 0.256 | 0.031-2.090 | 102 | 47 | ||||||
| C | 119 | 27 | ref | 191 | 85 | ref | |||||||
| G | 37 | 9 | 0.871 | 0.933 | 0.403-2.16 | 19 | 9 | 0.883 | 0.939 | 0.408-2.162 | |||
| rs1049107 | CC | 50 | 7 | ref | 70 | 34 | ref | ||||||
| CT | 2 | 11 | 9.095×10⁻⁷ | 0.025 | 0.005-0.140 | 23 | 0 | 0.004 | 11.667 | 1.516-89.79 | |||
| TT | 26 | 0 | 0.153 | 4.235 | 0.503-35.659 | 4 | 13 | 0.001 | 0.149 | 0.045-0.493 | |||
| TT+CT | 28 | 11 | 0.050 | 0.356 | 0.124-1.023 | 27 | 13 | 0.982 | 1.009 | 0.463-2.197 | |||
| CC+CT | 52 | 18 | 0.010 | 0.103 | 0.013-0.814 | 93 | 34 | ||||||
| C | 102 | 25 | ref | 163 | 68 | ref | |||||||
| T | 54 | 11 | 0.643 | 1.203 | 0.550-2.63 | 31 | 26 | 0.020 | 0.497 | 0.275-0.9 | |||
| rs1049100 | CC | 46 | 7 | ref | 70 | 34 | ref | ||||||
| CT | 2 | 11 | 1.799×10⁻⁶ | 0.028 | 0.005-0.152 | 23 | 0 | 0.004 | 11.667 | 1.516-89.79 | |||
| TT | 30 | 0 | 0.146 | 5.277 | 0.628-44.302 | 4 | 13 | 0.001 | 0.149 | 0.045-0.493 | |||
| TT+CT | 32 | 11 | 0.122 | 0.443 | 0.155-1.264 | 27 | 13 | 0.982 | 1.009 | 0.463-2.197 | |||
| CC+CT | 48 | 18 | 0.003 | 0.083 | 0.011-0.653 | 93 | 34 | ||||||
| C | 94 | 25 | ref | 163 | 68 | ref | |||||||
| T | 62 | 11 | 0.306 | 1.499 | 0.688-3.264 | 31 | 26 | 0.020 | 0.497 | 0.275-0.9 | |||
| rs3891176 | AA | 49 | 15 | ref | 65 | 33 | ref | ||||||
| CA | 11 | 1 | 0.442 | 3.367 | 0.401-28.258 | 26 | 9 | 0.385 | 1.467 | 0.617-3.487 | |||
| CC | 18 | 2 | 0.338 | 2.755 | 0.573-13.259 | 5 | 2 | 1.000 | 1.269 | 0.234-6.896 | |||
| CC+CA | 29 | 3 | 0.096 | 2.959 | 0.789-11.099 | 31 | 11 | 0.382 | 1.431 | 0.639-3.201 | |||
| AA+CA | 60 | 16 | 0.347 | 0.417 | 0.087-1.986 | 91 | 42 | ||||||
| A | 109 | 31 | ref | 156 | 75 | ref | |||||||
| C | 47 | 5 | 0.048 | 2.673 | 0.979-7.3 | 36 | 13 | 0.416 | 1.331 | 0.667-2.658 | |||
| TC<5.2 | TC>=5.2 | TC<5.2 | TC>=5.2 | ||||||||||
| rs41542812 | CC | 45 | 26 | ref | 113 | 14 | ref | ||||||
| GC | 4 | 0 | 0.661 | 2.411 | 0.268-21.661 | 19 | 3 | 0.719 | 0.785 | 0.206-2.992 | |||
| GG | 15 | 6 | 0.496 | 1.444 | 0.499-4.181 | 3 | 0 | 0.476 | 0.526 | 0.055-5.026 | |||
| GG+GC | 19 | 6 | 0.250 | 1.830 | 0.649-5.161 | 22 | 3 | 1.000 | 0.909 | 0.241-3.428 | |||
| CC+GC | 49 | 26 | 0.600 | 0.754 | 0.261-2.175 | 132 | 17 | ||||||
| C | 94 | 52 | ref | 245 | 31 | ref | |||||||
| G | 34 | 12 | 0.232 | 1.567 | 0.748-3.286 | 25 | 3 | 1.000 | 1.054 | 0.301-3.697 | |||
| rs1049107 | CC | 36 | 21 | ref | 94 | 10 | ref | ||||||
| CT | 2 | 0 | 1.000 | 1.784 | 0.175-18.222 | 30 | 6 | 0.360 | 0.532 | 0.178-1.586 | |||
| TT | 26 | 11 | 0.477 | 1.379 | 0.568-3.347 | 4 | 0 | 0.502 | 0.579 | 0.062-5.416 | |||
| TT+CT | 28 | 11 | 0.378 | 1.485 | 0.615-3.583 | 34 | 6 | 0.381 | 0.603 | 0.204-1.785 | |||
| CC+CT | 38 | 21 | 0.553 | 0.766 | 0.316-1.853 | 124 | 16 | 0.547 | 1.471 | 0.162-13.352 | |||
| C | 74 | 42 | ref | 218 | 26 | ref | |||||||
| T | 54 | 22 | 0.297 | 35.000 | 0.747-2.6 | 38 | 6 | 0.602 | 0.755 | 0.291-1.957 | |||
| rs1049100 | CC | 34 | 19 | ref | 94 | 10 | ref | ||||||
| CT | 2 | 0 | 1.000 | 1.714 | 0.167-17.6 | 30 | 6 | 0.360 | 0.532 | 0.178-1.586 | |||
| TT | 28 | 13 | 0.674 | 1.204 | 0.507-2.858 | 4 | 0 | 0.502 | 0.579 | 0.062-5.416 | |||
| CC+CT | 36 | 19 | 0.770 | 0.880 | 0.372-2.081 | 124 | 16 | 0.547 | 1.471 | 0.162-13.352 | |||
| TT+CT | 30 | 13 | 0.562 | 1.290 | 0.546-3.046 | 34 | 6 | 0.381 | 0.603 | 0.204-1.785 | |||
| C | 70 | 38 | ref | 218 | 26 | ref | |||||||
| T | 58 | 26 | 0.537 | 1.211 | 0.659-2.225 | 38 | 6 | 0.602 | 0.755 | 0.291-1.957 | |||
| rs3891176 | AA | 41 | 23 | ref | 86 | 12 | ref | ||||||
| CA | 8 | 4 | 1.000 | 1.122 | 0.304-4.135 | 33 | 2 | 0.354 | 2.302 | 0.489-10.845 | |||
| CC | 15 | 5 | 0.365 | 1.683 | 0.542-5.229 | 6 | 1 | 1.000 | 0.837 | 0.093-7.567 | |||
| CC+CA | 23 | 9 | 0.444 | 1.434 | 0.569-3.613 | 39 | 3 | 0.553 | 1.814 | 0.484-6.794 | |||
| AA+CA | 49 | 27 | 0.552 | 0.726 | 0.252-2.089 | 119 | 14 | 0.556 | 1.417 | 0.159-12.636 | |||
| A | 90 | 50 | ref | 205 | 26 | ref | |||||||
| C | 38 | 14 | 0.251 | 1.508 | 0.746-3.047 | 45 | 4 | 0.525 | 1.427 | 0.474-4.291 | |||
| LDL/HDL≤2 | LDL/HDL>2 | P | OR | 95%CI | LDL/HDL | P | OR | 95%CI | |||||
| rs41542812 | CC | 47 | 24 | ref | 71 | 56 | ref | ||||||
| GC | 3 | 1 | 1.000 | 1.532 | 0.151-15.526 | 12 | 10 | 0.906 | 0.946 | 0.381-2.35 | |||
| GG | 14 | 7 | 0.968 | 1.021 | 0.364-2.866 | 2 | 1 | 0.710 | 1.577 | 0.139-17.845 | |||
| GG+CC | 17 | 8 | 0.869 | 1.085 | 0.410-2.873 | 14 | 11 | 0.993 | 1.004 | 0.423-2.381 | |||
| CC+GC | 50 | 25 | 1.000 | 1.000 | 0.358-2.791 | 83 | 66 | 0.705 | 0.629 | 0.056-7.086 | |||
| C | 97 | 49 | ref | 154 | 122 | ref | |||||||
| G | 31 | 15 | 0.905 | 1.044 | 0.515-2.114 | 16 | 12 | 0.891 | 1.056 | 0.482-2.316 | |||
| rs1049107 | CC | 35 | 22 | ref | 61 | 43 | ref | ||||||
| CT | 1 | 1 | 1.000 | 0.629 | 0.037-10.573 | 16 | 20 | 0.140 | 0.564 | 0.263-1.211 | |||
| TT | 28 | 9 | 0.150 | 1.956 | 0.778-4.912 | 2 | 2 | 1.000 | 0.705 | 0.096-5.201 | |||
| TT+CT | 29 | 10 | 0.186 | 1.823 | 0.745-4.461 | 18 | 22 | 0.140 | 0.577 | 0.277-1.203 | |||
| CC+CT | 36 | 23 | 0.208 | 0.503 | 0.201-1.257 | 77 | 53 | 1.000 | 1.453 | 0.198-10.638 | |||
| C | 71 | 45 | ref | 138 | 106 | ref | |||||||
| T | 57 | 19 | 0.047 | 1.901 | 1.003-3.604 | 20 | 24 | 0.173 | 0.640 | 0.336-1.22 | |||
| rs1049100 | CC | 34 | 19 | ref | 61 | 43 | ref | ||||||
| CT | 1 | 1 | 1.000 | 0.559 | 0.033-9.451 | 16 | 20 | 0.140 | 0.564 | 0.263-1.211 | |||
| TT | 29 | 12 | 0.501 | 1.350 | 0.562-3.244 | 2 | 2 | 1.000 | 0.705 | 0.096-5.201 | |||
| TT+CT | 30 | 13 | 0.562 | 1.290 | 0.546-3.046 | 18 | 22 | 0.140 | 0.577 | 0.277-1.203 | |||
| CC+CT | 35 | 20 | 0.466 | 0.724 | 0.304-1.726 | 77 | 53 | 1.000 | 1.453 | 0.198-10.638 | |||
| C | 69 | 39 | ref | 138 | 106 | ref | |||||||
| T | 59 | 25 | 0.355 | 1.334 | 0.724-2.457 | 20 | 24 | 0.173 | 0.640 | 0.336-1.22 | |||
| rs3891176 | AA | 44 | 20 | ref | 49 | 49 | ref | ||||||
| CA | 6 | 6 | 0.209 | 0.455 | 0.130-1.585 | 26 | 9 | 0.013 | 2.889 | 1.228-6.794 | |||
| CC | 14 | 6 | 0.916 | 1.061 | 0.356-3.163 | 4 | 3 | 0.715 | 1.333 | 0.283-6.272 | |||
| CC+CA | 20 | 12 | 0.540 | 0.758 | 0.311-1.844 | 30 | 12 | 0.019 | 2.500 | 1.149-5.442 | |||
| AA+CA | 50 | 26 | 0.795 | 0.824 | 0.283-2.396 | 75 | 68 | 1 | 0.827 | 0.179-3.830 | |||
| A | 94 | 46 | ref | 124 | 107 | ref | |||||||
| C | 34 | 18 | 0.818 | 0.924 | 0.472-1.809 | 34 | 15 | 0.044 | 1.956 | 1.011-3.785 | |||
Analysis of plasma-lipid homeostasis and longevity-associated haplotypes
To analyse the effect of haplotypes on plasma lipids, we divided samples between plasma lipid levels and age. We found that rs41542812, rs1049107 and rs1049100 would form a block in HLA-DQB1 and that the CCC haplotype, which was formed by major alleles, seemed to be a reference. In the centenarian group, we obtained none of the significant haplotypes for four plasma lipid indices. In nonagenarians, the block contained three haplotypes, and the CTT haplotype was associated with a higher LDL-c/HDL-c ratio (P=0.037, OR: 0.301, 95%CI: 0.093-0.969). In the longevity group, the GTT and CTT haplotypes were associated with higher HDL-c levels (P=0.027, OR:4.750, 95%CI: 1.057-21.337; P=0.045, OR:6.667, 95%CI: 0.857-51.883). The CTT haplotype was associated with a higher TG level (P=1.096×10-4=, OR: 0.178, 95%CI: 0.070-0.451), and the CTT haplotype was associated with LDL-c/HDL-c <=2 (P=0.027, OR: 3.403, 95%CI: 1.098-10.544; Supplementary Table 5).
Interaction between longevity-associated variants and internal milieu lipid levels
An interaction analysis between longevity associated variants and internal milieu lipid levels on age detected significant results in a corrected model (R2=0.375, R2Adjusted=0.332). Significant values of rs14917 & rs1491399 (P=0.001), rs1491 & LDL-c/HDL-c (P=0.016), rs927299 & LDL-c/HDL-c (P=0.028), and rs1491 & rs927299 & LDL-c/HDL-c (P=0.031) were detected in this model.
Discussion
Longevity-associated variants and haplotypes identified
Because of the low prevalence of delayed age-related disease, the longevity population was an ideal population to be considered a “real negative control” in human successful healthy ageing and age-related disease. Genetic research about longevity had identify some longevity-associated factors, such as FOXO3A [15,16], SIRT1 [17], APOE [18,19], IL6 and ANKRD20A9P [20]. There had been multiple genetic studies of Chinese longevity, and FOXO3 [21], IGFBP-3 [22], CETP [23], and SIRT1 [24]. Studies in Sardinian centenarians showed the association between HLA-DQB1 and longevity [25,26]. The association between longevity and HLA-DQB1*05 or HLA-DQB1*03 was identified in a Japanese population [7,8]. However, there was no association study about SNPs in HLA-DQB1 and longevity. In this study, we identified four new SNPs in HLA-DQB1, rs41542812 (DQB1*05), rs1049107 (DQB1*03), rs1049100 (DQB1*03) and rs3891176 (DQB1*02), associated with longevity in our cohort (Table 1). Further, we identified that rs41542812, rs1049107, and rs1049100 were closely linked to disequilibrium in one block; that is, the haplotypes GTT and CTT, which significantly increased the chance of longevity (P=3.996×10⁹, OR: 4.367, 95%CI: 2.608-7.313; P=1.812×10⁵, OR: 3.677, 95%CI: 1.970-6.865) to our knowledge have also never been reported before.
In these new longevity-associated variants, we noted through the use of stratified analysis that only rs1049107 was a centenarian-associated variant in long-lived individuals, but the other three variants were associated with both centenarians and nonagenarians (Table 1). This result suggested that the longevity-associated genetic variance seems to increase with ageing, so we observed the variance only in centenarians but not nonagenarians.
Longevity variants associated with lipid homeostasis in LLIs
The main cholesterol-carrying lipoproteins are LDL-c and HDL-c. LDL-c is always considered the bad lipoprotein and can increase CVD and metabolic syndrome risk. In contrast, HDL-c is considered the good lipoprotein and can decrease metabolic-related disease and CVD risk. The importance of the balance of plasma lipids for maintaining health is obvious. The LDL-c/HDL-c ratio is increasingly being considered a valuable tool in CVD-related clinical research. Many variants have been identified as potentially affecting human lipids, as have some longevity-associated variants. The changes in lipid levels in our cohort were consistent with those in previous studies [27–29]. However, evidence for the balance of plasma lipids being controlled by longevity-associated loci is still lacking.
Furthermore, we identified HLA-DQB1 rs1049107, T-carriers (PHDL=0.006, OR: 11.277; PTG=9.095×10⁻⁷, OR: 0.025; PLDL/HDL=0.047, OR: 1.901) and HLA-DQB1 rs1049100, T-carriers (PTG=1.799×10⁻⁶, OR: 0.028) associated with lipid homeostasis in LLIs.
The interaction analysis of longevity variants and lipid levels
The interaction analysis between lipids and genotype results show that HLA-DQB1 longevity variant alleles or haplotype carriers have a trend of better blood lipid levels, thus benefiting healthy longevity in LLIs (Table 3; Supplementary Figure 1). The interaction analysis results suggest that with longevity-associated variants enriched in the longevity population, the plasma lipid levels were better controlled than by adjusting age. They also suggested that it is possible for longevity variants to possess functions to regulate the homeostasis of plasma lipids in the internal environment of LLIs.
Table 3. The effect of variants and lipid levels interaction on long-life (years) in all subjects.
| Source | Type III Sum of Squares | df | Mean Square | F | P |
| Corrected Model | 104143.199 | 32 | 3254.475 | 8.738 | <0.001 |
| 8045.243 | 1 | 8045.243 | 21.602 | <0.001 | |
| rs14917*rs1491399 | 3.124 | 1 | 3993.124 | 10.547 | 0.001 |
| rs1491*LDL/HDL | 2164.922 | 1 | 2164.922 | 5.813 | 0.016 |
| rs927299*LDL/HDL | 2692.908 | 2 | 1346.454 | 3.615 | 0.028 |
| rs1491*rs927299*LDL/HDL | 6703.210 | 8 | 837.901 | 2.136 | 0.031 |
| Error | 173924.649 | 467 | 372.430 | ||
| Total | 2559434.000 | 500 | |||
| Corrected Total | 278067.848 | 499 |
Functional analysis of the new longevity-associated variants in HLA-DQB1
HLA-DQB1 contained 5 exons. Exon 1 encodes the leader peptide, exons 2 and 3 encode the two extracellular protein domains, exon 4 encodes the transmembrane domain, and exon 5 encodes the cytoplasmic tail. All four novel variants in HLA-DQB1 are functional missense mutations. I These four variants, rs41542812 (Gln158His), rs1049107 (Gly157Ser) and rs1049100 (Val148Ile), lays in β chain of HLA-DQB1. Variety in β chain may change the binding site for special antigen, which plays a key role in maintaining internal homeostasis in vivo, such as lipid homeostasis. In addition, rs3891176 (Ala29Ser), located in exon 1, may change the function of the leader peptide and transform the signal that HLA-DQB1 received (Figure 3). Therefore, we first identified the association between longevity and these four variants. oxLDL (oxidized low-density lipoprotein) or LPS bands on HLA-DQB1 of T cell, and stimulate T cell producing cytokines. Cytokines effect on liver cell, and increase or decrease fatty acid metabolism. OxLDL could also bands on LDLR (low-density lipoprotein receptor) or HLA-DQB1 of liver cell. The signal could also change fatty acid metabolism and HDL-c producing of liver cell. With this possible process, plasma lipid homeostasis could affect by HLA-DQB1 variants (Figure 3).
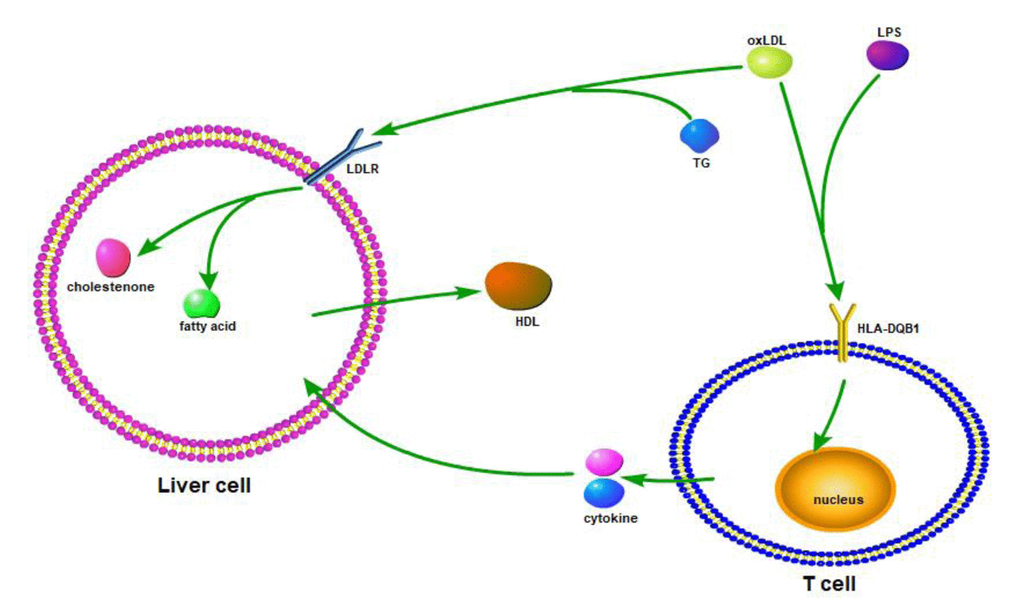
Figure 3. Based on the resource from relevant information on HLA-DQB1 and homeostasis/metabolism phenotype, we draw the possible mechanic or interactive path way.
We speculated that the HLA-DQB1 variants decreased the expression and/or antigen binding function of the HLA Class II antigen DQ protein β chain on the Antigen Presenting Cell (i.e., the macrophage), reduces the cytokines released by T-lymphocytes, thus reducing liver cell synthesis and release of cholesterol, to maintain the balance of cholesterol metabolism in vivo. This theory remains to be studied more in depth to obtain the corresponding evidence.
Findings in this research suggest a possible gene effecting model. HLA-DQB1 affects the longevity through a certain biological pathway, and these pathways could influence the balance of plasma lipids through unknown biological process. Longevity and the balance of plasma lipids could affect each other. A longevity gene could help keep plasma lipids balanced, and a better balance of plasma lipids could promote homeostasis and healthy longevity. However, the mechanisms of longevity and plasma lipid levels are still not clear. Furthermore, a gene associated with longevity and plasma lipid levels could be identified in multiple large longevity populations, and rare or low-frequency variants must receive more attention. The mechanism could be studied in cell or animal models by using new technology, such as Crispr/Cas 9. It would be useful for us to understand the mechanism of longevity and help the wider community achieve healthy ageing.
Methods
Subjects
The current study was based on the Longevity and Health of Aging Population (LHAP) study conducted in Bama County, Guangxi, China, in 2008 and the Chinese Longitudinal Healthy Longevity Survey (CLHLS) during 1997-2015 (Supplementary Table 6).
To investigate the association between genotype and plasma lipid levels, there were 100 long-lived individuals (aged 90-107 years, 32 males, 68 females), and 172 controls (aged 40-65 years, 75 males, 97 females). The longevity group contained 26 centenarians (5 males, 21 females) and 74 nonagenarians (27 males, 47 females). All control subjects lacked longevity history (no lineal family members aged above 85 for three generations). The Ethics Committee of Beijing Hospital, Ministry of Health, approved the study protocol. All participants were informed and provided informed consent in writing. All clinical investigations were conducted according to the principles of the Declarations of Helsinki. Laboratory parameters were recorded, including total cholesterol (TC), triglyceride (TG), high density lipoprotein-cholesterol (HDL-c) and low-density lipoprotein-cholesterol (LDL-c).
Exome target sequencing
We sequenced the segment of exomes using a targeted NGS approach to analyse SNVs (single nucleotide variations) and small insertions and/or deletions (Indels). The design parameters were as follows: 1) the bait length was 120 bp; 2) the bait tiling frequency was 2×; and 3) the human reference genome (GRch37) was used to search the baits. Genomic DNA (3 μg) was used to construct DNA libraries that contained index sequences for identifying DNA samples. The targeted genomic segment was captured with the Agilent Capture kit 39M (Agilent Technologies, Santa Clara, CA, USA) by NGS on the Illumina HiSeq 2500 platform to identify mutations in 100 Bama longevity subjects using 100-bp paired-end reads. Base sequences were aligned to the reference genome (GRch37), and variations SNVs and Indels) were called using the Samtools software and annotated by comparing them with the 1000 Genomes database. The average coverage of each base in the targeted region was 50×, which resulted in ≥90% of the targeted bases being sufficiently covered for variant calling (≥10×). The average coverage was ≥95% at the NGS stage. We compared the data from our 100 LLIs to publicly available genotype data from a CHS (Chinese Han South) population (n = 97) from the 1000 Genome project phase I. We found 115327 SNVs, in total. Of the 115327 SNVs, 84914 were consistent with those in the public SNP database, and 30413 were previously unknown.
Selection of variations
We selected candidate variation from the target sequence dataset using four continuous steps.
1) To minimize error rates and the impact of random sampling variance, at least three reads had to be obtained from both the forward and reverse DNA strands (double-stranded coverage) for all variants that were kept for association tests.
2) Variants located at repeat sequences, including STR (short tandem repeat) or single nucleotide repeat expansions, may be falsely called; thus, we first excluded these possible artificial variants.
3) The Longevity Gene database was downloaded, and all significant genes were screened. All variants of these significant genes were called and compared with the CHS population in the 1000 Genome project to obtain candidate variants with MAF (minor allele frequency) >10% in the 100 Bama longevity subjects compared to those in one public database. Seventeen genes that included 26 variants were selected as candidate longevity-associated genes. Through genotyping based on longevity and local younger populations, four genetic variants in HLA-DQB1 were identified as longevity-associated gene variants (Supplementary Table 1).
Genotyping and quality control for genotyping
The Sanger Sequencing method was used in the genotyping case-control study. To perform genotyping quality control, all associated allele carriers, and 10% of cases and 10% of controls who carried non-risk alleles, were re-genotyped by Sanger sequencing. Sequencing primers are shown in Supplementary Table 7.
Statistical analysis
Genotypes were evaluated for departure from the Hardy–Weinberg equilibrium (HWE) in cases and controls using the chi-squared goodness test. Variants with P < 0.05 were considered to deviate from the HWE. The MAFs of the variants were used as high-risk allele frequencies, and the defined type I error rate was 0.05. The genotype frequencies of the CHS population from the 1000 Genome database were used as the references for selecting candidate SNVs. A t-test was used to analyse the mean difference between the groups. A chi-squared test was used to establish the differences in the distribution of genotype and allele frequencies between the cases and controls. The odds ratio (OR) was used to estimate the strength of association between variables, with the OR and 95% confidence intervals (95%CI). The ORs and 95% CIs were calculated using the SPSS V17.0 software (SPSS; SAS Institute, Cary, NC, USA). A two-sided P value < 0.05 was considered statistically significant.
Conclusions
In this research, we identified four longevity-associated variants in HAL-DQB1, and these variants were associated with different kinds of plasma lipids. Our finding shows that longevity and plasma lipid levels were affected by multiple genes and that internal lipid homeostasis promoted healthy longevity. Further similar studies should be developed in human populations, especially investigating human lifespan and healthy longevity.
Supplementary Materials
Author Contributions
F.Y., XQ. Z, and Ze. Y. designed the study. F. Y. contributed to sample management, exome sequencing and performed the genotyping. J. H., XL. L, L. S, YG. Y, XH. S. YG. Y performed bioinformatics and the statistical analysis. Yi. Z and C. N. contributed CLHLS database. CY. H., ZP. L, ZZ. H, CG. Z, B. Q, SY. C, X. Z, and YQ Z contributed Bama subjects. All authors revised and gave final approval of this manuscript.
Conflicts of Interest
The authors declare no competing financial interests. All financial and material support for this research has no potential conflicts.
Funding
This work was funded by the Natural Science Foundation of Guangxi and China (81400790, 81061120527, 81370445, 81472408, 81571385, 2014GXNSFDA118028, GKZ0991198), funding from National Department Public Benefit Research Foundation by Ministry of Health P. R. China (201302008), and 12th 5 Year National Program from the Chinese Ministry of Scientific Technology (2012BAI10B01, 2015BAI06B03).
References
- 1. Franceschi C, Bonafè M. Centenarians as a model for healthy aging. Biochem Soc Trans. 2003; 31:457–61. https://doi.org/10.1042/bst0310457 [PubMed]
- 2. Hitt R, Young-Xu Y, Silver M, Perls T. Centenarians: the older you get, the healthier you have been. Lancet. 1999; 354:652. https://doi.org/10.1016/S0140-6736(99)01987-X [PubMed]
- 3. Terry DF, Wilcox M, McCormick MA, Lawler E, Perls TT. Cardiovascular advantages among the offspring of centenarians. J Gerontol A Biol Sci Med Sci. 2003; 58:M425–31. https://doi.org/10.1093/gerona/58.5.M425 [PubMed]
- 4. Sebastiani P, Solovieff N, Dewan AT, Walsh KM, Puca A, Hartley SW, Melista E, Andersen S, Dworkis DA, Wilk JB, Myers RH, Steinberg MH, Montano M, et al. Genetic signatures of exceptional longevity in humans. PLoS One. 2012; 7:e29848. https://doi.org/10.1371/journal.pone.0029848 [PubMed]
- 5. Deelen J, Beekman M, Uh HW, Broer L, Ayers KL, Tan Q, Kamatani Y, Bennet AM, Tamm R, Trompet S, Guðbjartsson DF, Flachsbart F, Rose G, et al. Genome-wide association meta-analysis of human longevity identifies a novel locus conferring survival beyond 90 years of age. Hum Mol Genet. 2014; 23:4420–32. https://doi.org/10.1093/hmg/ddu139 [PubMed]
- 6. Newman AB, Walter S, Lunetta KL, Garcia ME, Slagboom PE, Christensen K, Arnold AM, Aspelund T, Aulchenko YS, Benjamin EJ, Christiansen L, D’Agostino RB
Sr , Fitzpatrick AL, et al. A meta-analysis of four genome-wide association studies of survival to age 90 years or older: the Cohorts for Heart and Aging Research in Genomic Epidemiology Consortium. J Gerontol A Biol Sci Med Sci. 2010; 65:478–87. https://doi.org/10.1093/gerona/glq028 [PubMed] - 7. Akisaka M, Suzuki M, Inoko H. Molecular genetic studies on DNA polymorphism of the HLA class II genes associated with human longevity. Tissue Antigens. 1997; 50:489–93. https://doi.org/10.1111/j.1399-0039.1997.tb02904.x [PubMed]
- 8. Akisaka M, Suzuki M. [Okinawa Longevity Study. Molecular genetic analysis of HLA genes in the very old]. Nippon Ronen Igakkai Zasshi. 1998; 35:294–98. https://doi.org/10.3143/geriatrics.35.294 [PubMed]
- 9. Murabito JM, Yuan R, Lunetta KL. The search for longevity and healthy aging genes: insights from epidemiological studies and samples of long-lived individuals. J Gerontol A Biol Sci Med Sci. 2012; 67:470–79. https://doi.org/10.1093/gerona/gls089 [PubMed]
- 10. Wellcome Trust Case Control C, and Wellcome Trust Case Control Consortium. Genome-wide association study of 14,000 cases of seven common diseases and 3,000 shared controls. Nature. 2007; 447:661–78. https://doi.org/10.1038/nature05911 [PubMed]
- 11. Do R, Willer CJ, Schmidt EM, Sengupta S, Gao C, Peloso GM, Gustafsson S, Kanoni S, Ganna A, Chen J, Buchkovich ML, Mora S, Beckmann JS, et al. Common variants associated with plasma triglycerides and risk for coronary artery disease. Nat Genet. 2013; 45:1345–52. https://doi.org/10.1038/ng.2795 [PubMed]
- 12. Lange LA, Hu Y, Zhang H, Xue C, Schmidt EM, Tang ZZ, Bizon C, Lange EM, Smith JD, Turner EH, Jun G, Kang HM, Peloso G, et al, and NHLBI Grand Opportunity Exome Sequencing Project. Whole-exome sequencing identifies rare and low-frequency coding variants associated with LDL cholesterol. Am J Hum Genet. 2014; 94:233–45. https://doi.org/10.1016/j.ajhg.2014.01.010 [PubMed]
- 13. Giger JN, Strickland OL, Weaver M, Taylor H, Acton RT. Genetic predictors of coronary heart disease risk factors in premenopausal African-American women. Ethn Dis. 2005; 15:221–32. [PubMed]
- 14. Budovsky A, Craig T, Wang J, Tacutu R, Csordas A, Lourenço J, Fraifeld VE, de Magalhães JP. LongevityMap: a database of human genetic variants associated with longevity. Trends Genet. 2013; 29:559–60. https://doi.org/10.1016/j.tig.2013.08.003 [PubMed]
- 15. Willcox BJ, Donlon TA, He Q, Chen R, Grove JS, Yano K, Masaki KH, Willcox DC, Rodriguez B, Curb JD. FOXO3A genotype is strongly associated with human longevity. Proc Natl Acad Sci USA. 2008; 105:13987–92. https://doi.org/10.1073/pnas.0801030105 [PubMed]
- 16. Broer L, Buchman AS, Deelen J, Evans DS, Faul JD, Lunetta KL, Sebastiani P, Smith JA, Smith AV, Tanaka T, Yu L, Arnold AM, Aspelund T, et al. GWAS of longevity in CHARGE consortium confirms APOE and FOXO3 candidacy. J Gerontol A Biol Sci Med Sci. 2015; 70:110–18. https://doi.org/10.1093/gerona/glu166 [PubMed]
- 17. Kilic U, Gok O, Erenberk U, Dundaroz MR, Torun E, Kucukardali Y, Elibol-Can B, Uysal O, Dundar T. A remarkable age-related increase in SIRT1 protein expression against oxidative stress in elderly: SIRT1 gene variants and longevity in human. PLoS One. 2015; 10:e0117954. https://doi.org/10.1371/journal.pone.0117954 [PubMed]
- 18. van Bockxmeer FM. ApoE and ACE genes: impact on human longevity. Nat Genet. 1994; 6:4–5. https://doi.org/10.1038/ng0194-4 [PubMed]
- 19. Schächter F, Faure-Delanef L, Guénot F, Rouger H, Froguel P, Lesueur-Ginot L, Cohen D. Genetic associations with human longevity at the APOE and ACE loci. Nat Genet. 1994; 6:29–32. https://doi.org/10.1038/ng0194-29 [PubMed]
- 20. Zeng Y, Nie C, Min J, Liu X, Li M, Chen H, Xu H, Wang M, Ni T, Li Y, Yan H, Zhang JP, Song C, et al. Novel loci and pathways significantly associated with longevity. Sci Rep. 2016; 6:21243. https://doi.org/10.1038/srep21243 [PubMed]
- 21. Sun L, Hu C, Zheng C, Qian Y, Liang Q, Lv Z, Huang Z, Qi K, Gong H, Zhang Z, Huang J, Zhou Q, Yang Z. FOXO3 variants are beneficial for longevity in Southern Chinese living in the Red River Basin: A case-control study and meta-analysis. Sci Rep. 2015; 5:9852. https://doi.org/10.1038/srep09852 [PubMed]
- 22. He YH, Lu X, Yang LQ, Xu LY, Kong QP. Association of the insulin-like growth factor binding protein 3 (IGFBP-3) polymorphism with longevity in Chinese nonagenarians and centenarians. Aging (Albany NY). 2014; 6:944–56. https://doi.org/10.18632/aging.100703 [PubMed]
- 23. Sun L, Hu CY, Shi XH, Zheng CG, Huang ZZ, Lv ZP, Huang J, Wan G, Qi KY, Liang SY, Zhou L, Yang Z. Trans-ethnical shift of the risk genotype in the CETP I405V with longevity: a Chinese case-control study and meta-analysis. PLoS One. 2013; 8:e72537. https://doi.org/10.1371/journal.pone.0072537 [PubMed]
- 24. Huang J, Sun L, Liu M, Zhou L, Lv ZP, Hu CY, Huang ZZ, Zheng CG, Zhou L, Yang Z. [Association between SIRT1 gene polymorphisms and longevity of populations from Yongfu region of Guangxi]. Zhonghua Yi Xue Yi Chuan Xue Za Zhi. 2013; 30:55–59. Association between SIRT1 gene polymorphisms and longevity of populations from Yongfu region of Guangxi [PubMed]
- 25. Scola L, Lio D, Candore G, Forte GI, Crivello A, Colonna-Romano G, Pes MG, Carru C, Ferrucci L, Deiana L, Baggio G, Franceschi C, Caruso C. Analysis of HLA-DRB1, DQA1, DQB1 haplotypes in Sardinian centenarians. Exp Gerontol. 2008; 43:114–18. https://doi.org/10.1016/j.exger.2007.06.007 [PubMed]
- 26. Scola L, Lio D, Crivello A, Candore G, Forte GI, Colonna-Romano G, Pes MG, Carru C, Ferrucci L, Deiana L, Baggio G, Franceschi C, Caruso C. Analysis of HLA-DQA, HLA-DQB frequencies in a group of Sardinian centenarians. Rejuvenation Res. 2006; 9:157–60. https://doi.org/10.1089/rej.2006.9.157 [PubMed]
- 27. Feng J, Zhang J, Liu M, Wan G, Qi K, Zheng C, Lv Z, Hu C, Zeng Y, Gregory SG, Yang Z. Association of mtDNA haplogroup F with healthy longevity in the female Chuang population, China. Exp Gerontol. 2011; 46:987–93. https://doi.org/10.1016/j.exger.2011.09.001 [PubMed]
- 28. Vaarhorst AA, Beekman M, Suchiman EH, van Heemst D, Houwing-Duistermaat JJ, Westendorp RG, Slagboom PE, Heijmans BT, and Leiden Longevity Study (LLS) Group. Lipid metabolism in long-lived families: the Leiden Longevity Study. Age (Dordr). 2011; 33:219–27. https://doi.org/10.1007/s11357-010-9172-6 [PubMed]
- 29. Heijmans BT, Beekman M, Houwing-Duistermaat JJ, Cobain MR, Powell J, Blauw GJ, van der Ouderaa F, Westendorp RG, Slagboom PE. Lipoprotein particle profiles mark familial and sporadic human longevity. PLoS Med. 2006; 3:e495. https://doi.org/10.1371/journal.pmed.0030495 [PubMed]