


Introduction
Telomeres are specialized chromatin structures, which cap chromosome ends and provide chromosome stability. The maintenance of telomeres requires accurate protections against DNA damage response (DDR) that would otherwise permanently stop cell division by checkpoint activation [ataxia telangiectasia mutated (ATM), and ATM- and Rad3-related (ATR) signaling] and lead to end-to-end chromosomal fusions by non-homologous end joining (NHEJ). Another threat to genome integrity stems from the inability of the conventional replication machinery to fully replicate the extremities of parental DNA, erosion compensated for by telomerase or recombination mechanisms [1,2].
To achieve chromosome end protection, telomeres are composed of repetitive DNA sequences that can fold into a terminal loop (t-loop), nucleosomes, the non-coding telomeric repeat-containing RNA (TERRA), the protein complex shelterin, and an ill-defined network of nuclear factors [3]. Shelterin is essential for telomere protection and is composed of six subunits: three bind specifically to telomeric DNA (TRF1, TRF2, and POT1) and three establish protein–protein contacts: RAP1 with TRF2, TIN2 with TRF1 and TRF2, and TPP1 with TIN2 and POT1. Each shelterin subunit appears to have a specific role in telomere protection, i.e., TRF2 blocks ATM signaling and NHEJ, while POT1 blocks ATR signaling [4].
Importantly, telomeres are dynamic structures during development, cancer and aging [5–7]. Indeed, the expression of telomerase is repressed in somatic tissues, leading to a progressive and cumulative telomere shortening with cell division ultimately leading to critically short telomeres triggering DDR and cellular senescence [8]. Therefore, telomeres have emerged as a key driver of aging.
In addition to their role in chromosome end protection, shelterin subunits are able to localize outside telomeric regions, where they can regulate the transcription of genes involved in metabolism, immunity and neurogenesis [9]. This delineates a signaling pathway by which telomeric changes (i.e. telomere shortening) control the ability of their associated factors to regulate transcription throughout the nucleus. This coupling between telomere protection, and tissue-specific transcriptional control might reflect the necessity of tissue homeostasis to rely on ‘fine-tuned’ coordination between telomeric dynamic (reflecting replicative history and the cumulative effects of various types of stress affecting telomere structure), cellular senescence and differentiation [9].
However, although many molecular and animal studies have manipulated the expression levels of shelterin subunits, only a few have examined the organ specificity of shelterin protein expression. We measured here shelterin gene expression levels in various tissues during development and early adulthood of mice and throughout the lifespan of zebrafish. This revealed distinct spatiotemporal regulation patterns of shelterin subunits during development and aging.
Results
Shelterin genes are differentially expressed in mouse tissues
We measured the mRNA levels of mouse shelterin genes (TERF1, TERF2, RAP1, TPP1, TINF2, POT1a, and POT1b) in mouse brains, hearts, livers, and kidneys, commencing on embryonic day 10 (E10), at 2-day intervals up to postnatal day 1 (P1), and then on P7, P21, and P100 (Figure 1). The proliferating cell nuclear antigen (PCNA) gene served as a marker of proliferation in each organ system. In young mice, the relative expression levels of shelterin genes differed among the four tissues evaluated (Figure 1 and Table 1). TPP1 was most prominently expressed in all tissues; whereas TERF2 and RAP1 were more highly expressed than was TINF2 and POT1a/b in the brain but not the heart, liver, or kidney. This differential expression pattern appeared to be established during development. Indeed, we observed downregulation of POT1a/b, unchanged expression of TINF2 and TERF1, and a significant increase in TERF2, RAP1, and TPP1 expression through to adulthood (Figure 1, Table 2). All shelterin components except POT1a were expressed at low levels in the heart, and the POT1a level decreased significantly during adulthood. The levels of TPP1, RAP1, and TERF1 were higher in the liver than in the heart, and POT1a/b expression levels decreased during development. Kidney TPP1 and RAP1 levels were upregulated during adulthood; POT1a/b expression decreased, but no significant changes in the levels of TERF1, TERF2, or TINF2 were observed (Figure 1). As expected, PCNA gene expression decreased significantly through to adulthood in all organs evaluated, indicating that the expression levels of the various shelterin genes were not associated with the proliferative status of the various tissues.
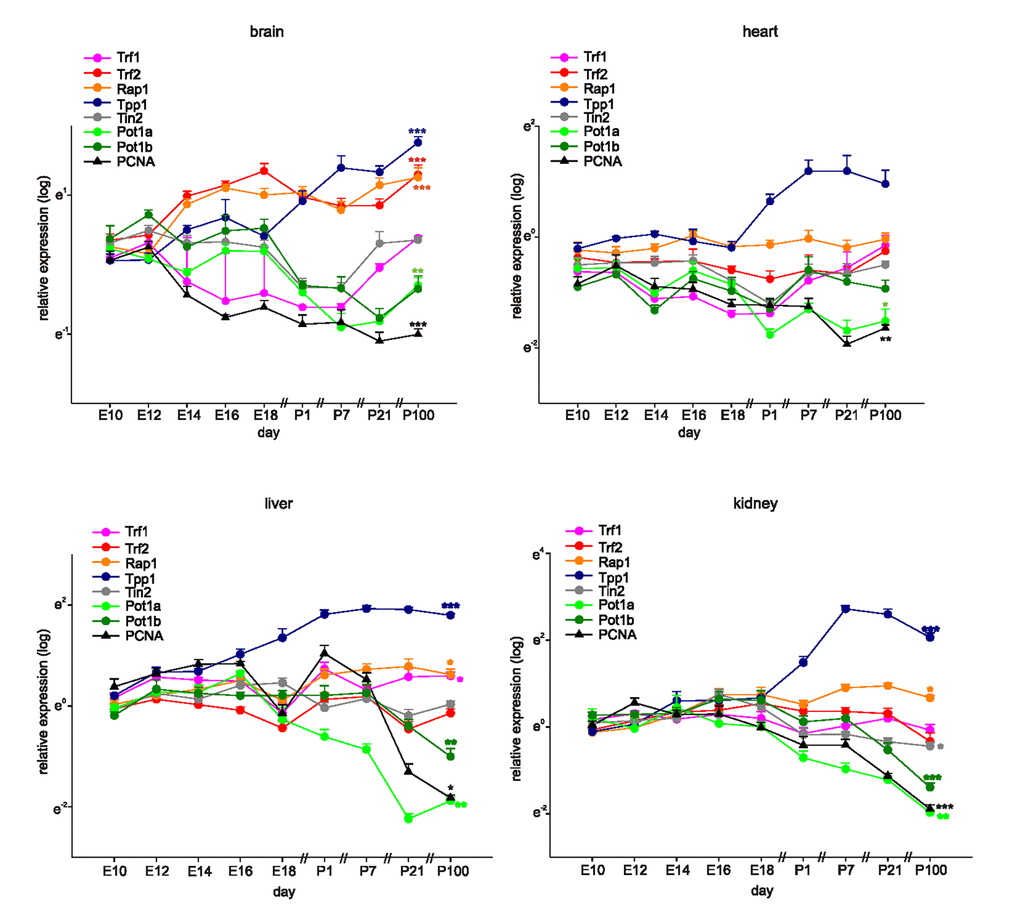
Figure 1. Shelterin components are differentially expressed during development and adulthood. Quantitative RT-PCRs for Shelterin components Trf1, Trf2, Rap1, Tpp1, Tin2, Pot1a, and Pot1b and PCNA as a marker for proliferation in mouse brains, hearts, livers, and kidneys at different time-points of development and in adulthood (n=4 each, the four samples for E10 were each pooled from 7 organs, at E12 and 14 the four samples were pooled from four organs each). Expression of each gene was normalized to the respective Gapdh, actin, and Rplp0 expression. Next, the average of all organs and samples at E10.5 was calculated. Individual samples were then normalized against this average value. Significance was tested between E10 and P100 (adult). Data are mean ± SEM. *p<0.05, **p<0.01, ***p<0.001.
Table 1. Relative expression of shelterin genes.
| Shelterin genes | Mouse E18 | Zebrafish 9 months | |||||||||||||||||||||||||||||||||||||||||||||||||||||||||||||||||||||||||||||||||||||||||||||||||
| Brain | Heart | Liver | Kidney | Brain | Gill | heart | Intestine | Liver | Muscle | Tail | Ovaries | ||||||||||||||||||||||||||||||||||||||||||||||||||||||||||||||||||||||||||||||||||||||||
|---|---|---|---|---|---|---|---|---|---|---|---|---|---|---|---|---|---|---|---|---|---|---|---|---|---|---|---|---|---|---|---|---|---|---|---|---|---|---|---|---|---|---|---|---|---|---|---|---|---|---|---|---|---|---|---|---|---|---|---|---|---|---|---|---|---|---|---|---|---|---|---|---|---|---|---|---|---|---|---|---|---|---|---|---|---|---|---|---|---|---|---|---|---|---|---|---|---|---|---|
| TERF1 | 7 | 7 | +/- | 6 | 2 | 6 | 6 | 3 | 5 | 4 | 4 | 4 | |||||||||||||||||||||||||||||||||||||||||||||||||||||||||||||||||||||||||||||||||||||||
| TERF2(m) TERFA (zf) | 1 | 3 | 7 | 4 | 1 | 5 | 2 | 4 | 4 | 1 | 2 | 5 | |||||||||||||||||||||||||||||||||||||||||||||||||||||||||||||||||||||||||||||||||||||||
| RAP1 | 2 | 2 | 4 | 1 | 4 | 4 | 3 | 2 | 3 | 6 | 5 | 3 | |||||||||||||||||||||||||||||||||||||||||||||||||||||||||||||||||||||||||||||||||||||||
| TINF2 | 5 | 5 | 2 | 5 | 5 | 3 | 5 | 6 | 6 | 2 | 6 | 1 | |||||||||||||||||||||||||||||||||||||||||||||||||||||||||||||||||||||||||||||||||||||||
| TPP1 | 4 | 1 | 1 | 2 | 3 | 1 | 1 | 5 | 2 | 3 | 3 | 6 | |||||||||||||||||||||||||||||||||||||||||||||||||||||||||||||||||||||||||||||||||||||||
| POT1a (m) | 6 | 4 | 6 | 7 | na | ||||||||||||||||||||||||||||||||||||||||||||||||||||||||||||||||||||||||||||||||||||||||||||||
| POT1b (m) | 3 | 6 | 3 | 3 | |||||||||||||||||||||||||||||||||||||||||||||||||||||||||||||||||||||||||||||||||||||||||||||||
| POT1 (zf) | na | 6 | 2 | 4 | 1 | 1 | 5 | 1 | 2 | ||||||||||||||||||||||||||||||||||||||||||||||||||||||||||||||||||||||||||||||||||||||||||
| The relative order of the shelterin subunit expression was ranked from 1 to 7 (mouse) and from 1 to 6 (zebrafish) with 1 being the most expressed. | |||||||||||||||||||||||||||||||||||||||||||||||||||||||||||||||||||||||||||||||||||||||||||||||||||
Table 2. Trend in shelterin gene expression during development, adulthood and aging.
| Shelterin genes | Mouse development and young adulthood | Zebrafish adulthood and aging | |||||||||||||||||||||||||||||||||||||||||||||||||||||||||||||||||||||||||||||||||||||||||||||||||
| Brain | Heart | Liver | Kidney | Brain | Gill | heart | Intestine | Liver | Muscle | Tail | Ovaries | ||||||||||||||||||||||||||||||||||||||||||||||||||||||||||||||||||||||||||||||||||||||||
|---|---|---|---|---|---|---|---|---|---|---|---|---|---|---|---|---|---|---|---|---|---|---|---|---|---|---|---|---|---|---|---|---|---|---|---|---|---|---|---|---|---|---|---|---|---|---|---|---|---|---|---|---|---|---|---|---|---|---|---|---|---|---|---|---|---|---|---|---|---|---|---|---|---|---|---|---|---|---|---|---|---|---|---|---|---|---|---|---|---|---|---|---|---|---|---|---|---|---|---|
| TERF1 | s | s | UP | s | DOWN | DOWN | s | DOWN | s | s | DOWN | DOWN | |||||||||||||||||||||||||||||||||||||||||||||||||||||||||||||||||||||||||||||||||||||||
| TERF2(m) TERFA (zf) | UP | s | s | s | DOWN | DOWN | s | DOWN | s | DOWN | DOWN | DOWN | |||||||||||||||||||||||||||||||||||||||||||||||||||||||||||||||||||||||||||||||||||||||
| RAP1 | UP | s | UP | UP | DOWN | DOWN | s | DOWN | DOWN | DOWN | DOWN | DOWN | |||||||||||||||||||||||||||||||||||||||||||||||||||||||||||||||||||||||||||||||||||||||
| TINF2 | s | s | s | s | DOWN | DOWN | DOWN | s | UP | DOWN | DOWN | DOWN | |||||||||||||||||||||||||||||||||||||||||||||||||||||||||||||||||||||||||||||||||||||||
| TPP1 | UP | s | UP | UP | DOWN | DOWN | DOWN | s | DOWN | DOWN | DOWN | DOWN | |||||||||||||||||||||||||||||||||||||||||||||||||||||||||||||||||||||||||||||||||||||||
| POT1a (m) | DOWN | DOWN | DOWN | DOWN | na | ||||||||||||||||||||||||||||||||||||||||||||||||||||||||||||||||||||||||||||||||||||||||||||||
| POT1b (m) | DOWN | s | DOWN | DOWN | |||||||||||||||||||||||||||||||||||||||||||||||||||||||||||||||||||||||||||||||||||||||||||||||
| POT1 (zf) | na | DOWN | s | DOWN | DOWN | DOWN | s | DOWN | DOWN | ||||||||||||||||||||||||||||||||||||||||||||||||||||||||||||||||||||||||||||||||||||||||||
| UP: the general trend of expression is to increase. | |||||||||||||||||||||||||||||||||||||||||||||||||||||||||||||||||||||||||||||||||||||||||||||||||||
| DOWN: the general trend of expression is to decrease. | |||||||||||||||||||||||||||||||||||||||||||||||||||||||||||||||||||||||||||||||||||||||||||||||||||
| s: stable expression | |||||||||||||||||||||||||||||||||||||||||||||||||||||||||||||||||||||||||||||||||||||||||||||||||||
TRF2 is highly expressed in the mouse neuronal system during both development and adulthood
To evaluate in detail differential TRF2 protein expression during development, we stained mouse tissues for TRF2 during development until young adulthood (i.e., from E10 to P100). TRF2 was highly expressed in all tissues until E16, at which time expression began to decrease in the heart, liver, and kidney but remained high in the brain (Figure 2). This finding is in contrast to what was reported by Cheng et al. [10], who found that TRF2 was not detected in the brain to E18. This may be attributable to technical problems, as the authors used a mouse-derived antibody to examine mouse tissues. In the absence of extensive blocking procedures, this may create false-negative results caused by an enhanced background. During later development and young adulthood, we found that TRF2 expression decreased in the heart, liver, and kidney but remained stable in the brain; the protein was highly expressed in neurons (Figure 3, Supplementary Figure 1). In the heart, TRF2 continued to be expressed in some endothelial cells of the subepicardial vessels, but in the kidney, the expression thereof became restricted to glomerular podocytes and juxtaglomerular cells (Figure 3), in agreement with the recently described angiogenic properties of the protein and its expression regulation by the Wilms’ tumor suppressor WT1 [11].
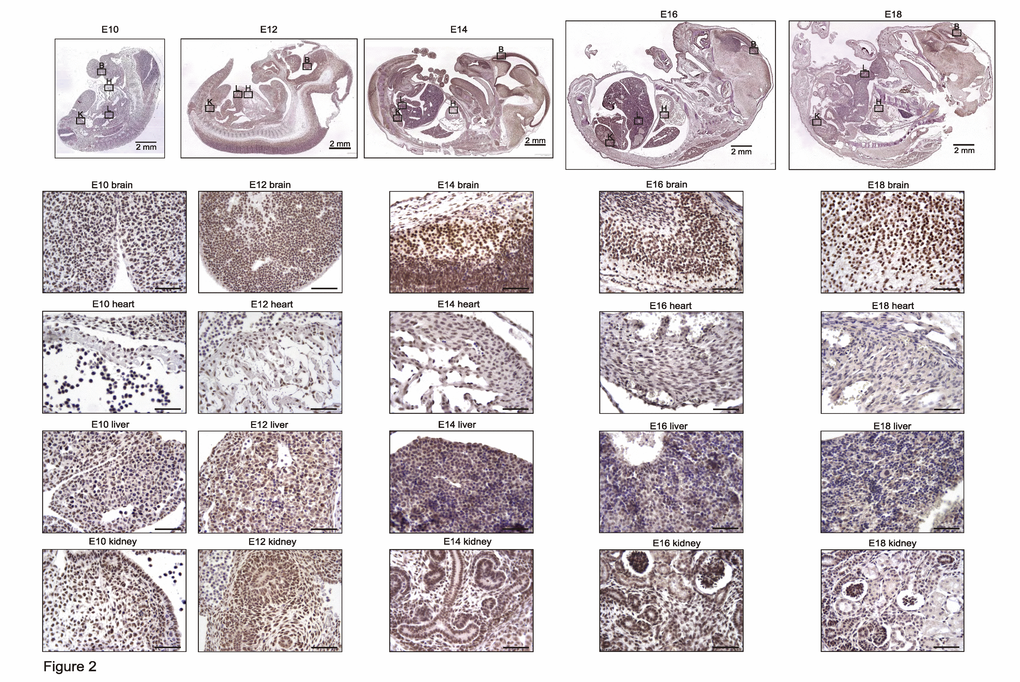
Figure 2. TRF2 is highly and ubiquitously expressed during embryonic development up to E16 and persists afterwards specifically in the brain. Representative photomicrographs of TRF2 immunostaining on sections of mouse embryos (3,3' diaminobenzidine (DAB) substrate, brown, hematoxylin counterstaining) at different stages before birth. B: brain, H: heart, L: liver, K: kidney. Unless otherwise indicated, scale bars represent 50µm.
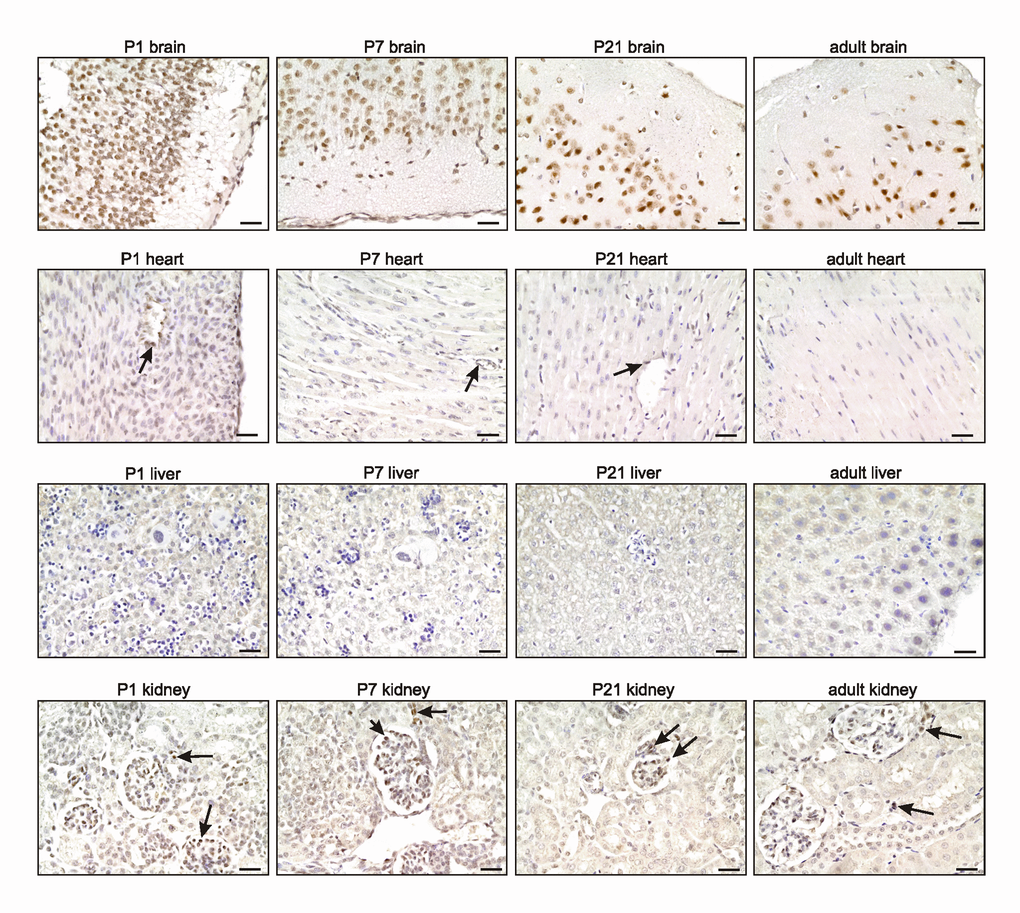
Figure 3. TRF2 expression remains high in the brain during adulthood. Representative photomicrographs of TRF2 immunostaining for the brain, heart, liver, and kidney (3,3' diaminobenzidine (DAB) substrate, brown, hematoxylin counterstaining) at different stages after birth. Note the persistent high expression of TRF2 in neurons of the brain (see also Supplementary Figure S1), the specific expression in subepicardial endothelial cells of the heart, and glomerular podocytes and juxta-glomerular cells of the kidney (arrows). Scale bars indicate 50µm.
The persistent high level of TRF2 expression in the brain during both development and adulthood is in line with previous work showing that TRF2 expression specifically increases upon neural differentiation [12] [10,13]. Such expression was accompanied by production of a brain-specific cytoplasmic form of TRF2, termed TRF2-S, which lacks both the DNA-binding domain and the nuclear localization signal [14] [15]. However, we failed to detect marked cytoplasmic staining of TRF2 in neurons; the staining was predominantly nuclear (Figures 2-3). Overall, the results suggest that the nuclear form of TRF2 plays a key role in brain development and function.
Shelterin genes are differentially expressed in zebrafish tissues throughout lifespan
The subunit composition of zebrafish shelterin is similar to that of humans; the complex is composed of the six subunits TRF1, TRF2 (termed TRFA in zebrafish), RAP1, TIN2, TPP1, and POT1. We determined the relevant mRNA levels in various tissues of 6 female fishes, from the young adult stage (3 months) to aged fish (36 months) (Figure 4). We confirmed tissue identities using specific markers (Supplementary Figure S2). As in the mouse (Figure 1), the relative expression levels of shelterin genes varied among tissues. Thus, the relative levels of TERFA mRNA were highest in brain and muscle and lowest in liver; TPP1 mRNA showed highest expression in the heart and lowest expression in the intestine and ovaries (Figure 4, Table 1). During aging, we observed a trend toward general downregulation of shelterin gene expression (Figure 4, Table 2); this was particularly marked in the brain and ovaries. The relative shelterin gene expression pattern was usually preserved, with the exception of the RAP1, which decreased in mRNA expression more rapidly than did the other shelterin genes in the intestine and the gill.
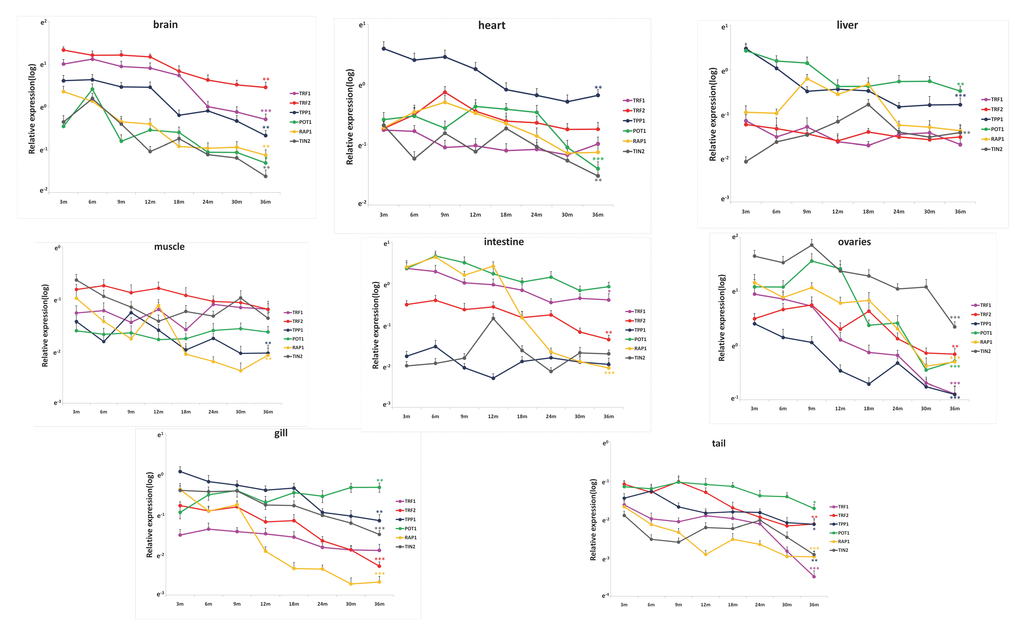
Figure 4. Shelterin genes are differentially expressed during zebrafish life span. Quantitative RT-qPCRs for Shelterin components TRF1, TRF2 (TERFA), RAP1, TPP1, TIN2 and POT1 in zebrafish’s brain, heart, liver, intestine, muscle, gill, tail and ovary at different time-points of life span from 3 month to 36 month (n=6 each). Significance was tested between 3 month and 36 month. Data are mean ± SEM. *p<0.05, **p<0.01, ***p<0.001.
We performed whole-mount in situ hybridization of zebrafish embryos for TERFA mRNA using a cDNA probe (Figure 5). The signal corresponding to TERFA mRNA was present throughout the entire embryo from the blastula (4 hpf) to the gastrula (8 hpf) stage. In contrast, the neuronal marker, Neurog1 [16], was detected only in neuronal tissues and only from 12 hpf to hatching at 72 hpf, whereas the hematopoiesis factor c-MYB was detected only in hematopoietic tissue and then only during the late stages of development [17] (Figure 5). Interestingly, high expression of TERFA mRNA in the nervous system was maintained from the beginning of the somite stage to the time of hindbrain formation (20 hpf) and thereafter (Figure 5). This was also true for Neurog1, at 20 hpf, TERFA mRNA appeared to be expressed prominently in the dorsal root ganglion and midbrain boundary, in the regions of the neural tube that give rise to the neocortex, midbrain, and hindbrain, in the dorsal and ventral spinal cord, and in regions of the peripheral nervous system. These results are in agreement with the quantitative reverse-transcription PCR (qRT-PCR) data on zebrafish tissues (Figure 4) and the specific neuronal staining of TRF2 during mouse development (Figures 2–3 and Supplementary Figure S2). In summary, TRFA expression appears to be ubiquitous during early development but becomes progressively more restricted to neuronal tissues during later stages of development and into young adulthood.
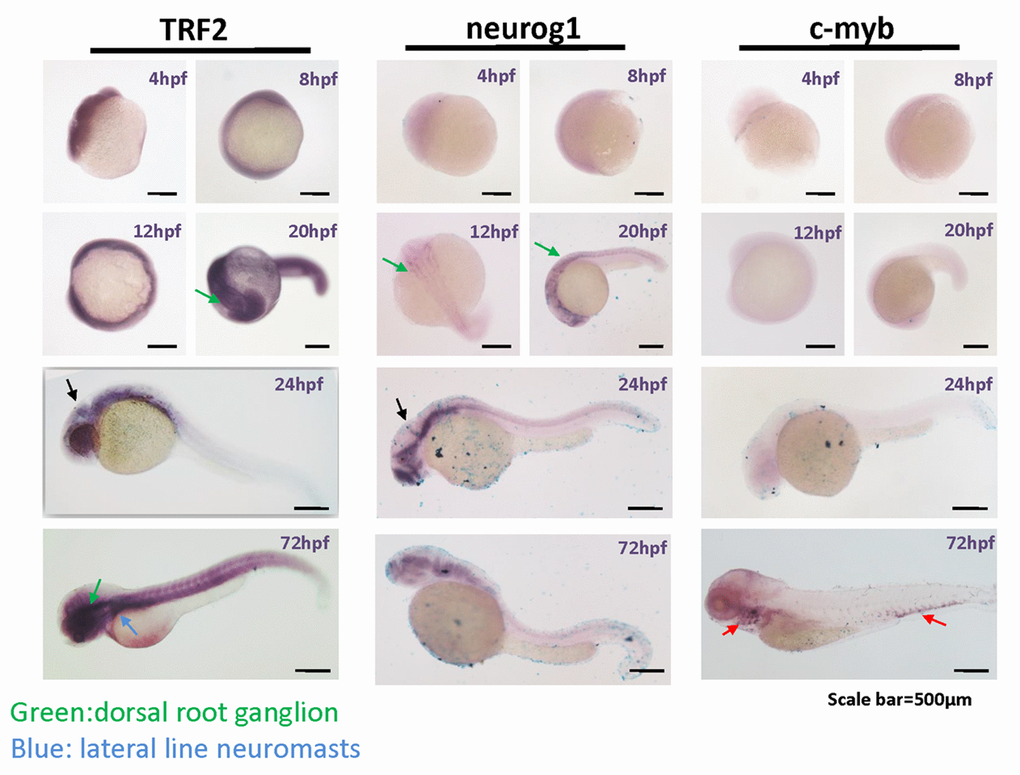
Figure 5. TERFA expression increase since neural development at embryonic stage and remains high in the brain during larval stage development. Representative photomicrographs of whole-mount in situ hybridization of TERFA, Neurog1 and c-MYB mRNA. The RNA probe labelled with DIG was stained in dark blue. The green arrow indicates the dorsal root ganglion neuron and the blue arrow indicates the lateral line neuromasts. The black arrow in 24hpf indicates the midbrain boundary. The red arrow indicates the c-MYB signal marked hematopoietic tissue.
In zebrafish, TERFA specifically regulates the expression of neuronal genes
The above results suggest that TRFA has specific roles in zebrafish nervous system. Indeed, TRFA-compromised zebrafish show early-onset neurodegenerative phenotypes [18]. Moreover, TRF2 downregulation in mammalian neural progenitor and tumour cells alters neuronal differentiation by mechanisms that are distinct from those regulating telomere protection [13,19]. The ability of TRF2 to bind at or close to neuronal genes and to activate their transcription is an attractive mecahnism to explain the extratelomeric roles of TRF2 [9,20,21]. We tested this hypothesis by designing a morpholino antisense oligonucleotide (MO) targeting the TERFA gene and injected this MO into zebrafish embryos at the 1–2-cell stage. Then we tested in the MO-treated embryos the expression by RT-qPCR of eight neuronal genes that are bound by TRF2 in human cells [21]. The expression of four of them was decreased upon TRFA inhibition (Figure 6a). Among them, PPP2R2C encodes a neuronal isoform of the regulatory subunit of Protein Phosphastase 2A (PP2A). We ruled out an off target of the MO against TERFA by showing a rescue of PPP2R2C expression upon co-injection of TERFA mRNA (Figure 6b). Importantly, the expression of other, not neuronal specific, PP2A subunit genes is not TRFA dependent (Figure 6c), highlighting further the neuronal specificity of genes whose expression is regulated by TRFA in zebrafish. Interestingly, these results suggest that the network of neuronal genes regulated by TRF2 is conserved between human and fish.
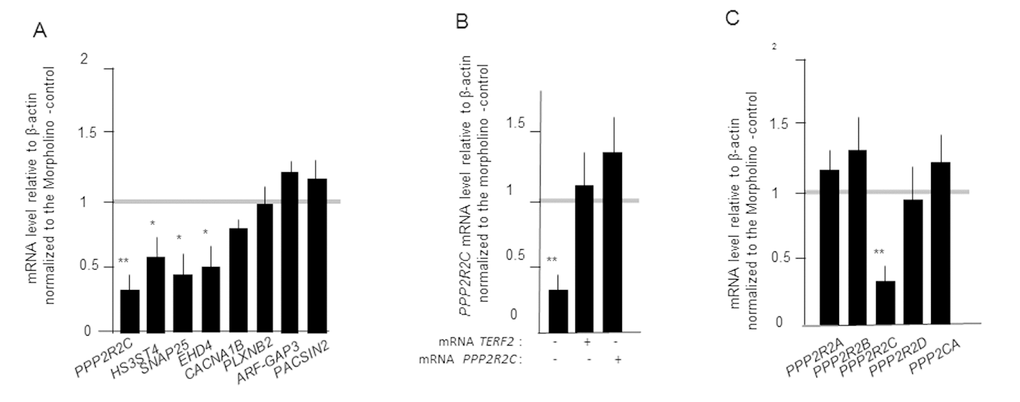
Figure 6. TERFA activates the expression of neuronal gene in zebrafish embryos. (A) Gene expression measured by RT-qPCRs in zebrafish embryos 24h after microinjection of MO targeting TERFA gene. (B) PPP2R2C expression upon co-injection of TERFA mRNA or PPP2R2C mRNA in zebrafish embryos after microinjection of MO targeting TERFA gene. (C) Expression of PP2A subunit genes in zebrafish embryos 24h after microinjection of MO targeting TERFA gene. Each qRT-PCR was repeated three times and the mRNA level of the PP2A genes was expressed relative to β-actin and normalized to the Morpholino -control. Data are mean ± SEM. *p<0.05, **p<0.01, ***p<0.001.
Discussion
We unveil here a tissue-specific shelterin gene expression pattern that is largely conserved between mouse and zebrafish (Table I). In particular, the relative expression level of TPP1 mRNA was high in most mouse and fish tissues, whereas the TERF2/TERFA mRNA levels were specifically elevated in the brain. With the exception of a study on tissue-specific expression of human shelterin genes in response to physiological stress [22], the present study is, to the best of our knowledge, the first to show that shelterin gene expression levels change in a tissue-specific manner during development and aging. We propose that this spatiotemporal expression pattern of shelterin gene expression plays important roles during development, tissue homeostasis, and aging. The fact that TRF2/TRFA is highly expressed in the brain, a tissue of low proliferative activity, indicates that the tissue-specific roles played by TRF2 (and probably other shelterin components) may (at least in part) be independent of the functions in telomere protection. Indeed, we show in zebrafish embryos that TRFA is required to activate the transcription of several neuronal genes.
Our study had certain limitations. First, the tissues evaluated are composed of many different cell types, and thus we cannot clearly conclude whether the changes noted suggest that the more proliferative cell types do not significantly express shelterin genes. Second, most of our significant findings were detected at the mRNA level. However, we found that the TRF2 spatiotemporal expression pattern was identical, both, on the mRNA and the protein level, during mouse development, suggesting that any effects of post-transcriptional regulation may be limited. Overall, our results suggest that important tissue-specific shelterin subcomplexes exist. This is consistent with previous studies on the tissue-specific roles played by TRF2 [13,14] and RAP1 [23] [24]. Consequently, the mechanisms by which shelterin and telomere structures affect cell fate may be more varied than previously thought; specific shelterin subcomplexes may be associated with different cell fates.
The existence of tissue-specific shelterin gene expression may explain the broad contributions made by telomeres and telomerase to normal development and aging, as well as the roles played by dysregulation of telomeres and telomerase in cancer and various other tissue-specific pathologies [6].
Our data form a solid foundation for future studies exploring the physiological role and regulation of the shelterin complex during development and aging. The work raises several questions. How is the spatiotemporal pattern of shelterin gene expression involved in tissue development, renewal, and function? How is shelterin gene expression regulated during development and over the subsequent lifespan? In this context, we have previously shown that the TERF2 gene is a direct target of Wnt/beta-catenin and WT1 in both mouse and human cells [25] [11], suggesting that these signaling pathways play important roles in the spatiotemporal expression of shelterin during development and aging. If shelterin plays a critical role in telomere protection, how do the extratelomeric functions of shelterin subunits contribute to cell-type-specific functions? Interestingly, a global decrease in shelterin gene expression during aging was evident in most of the tissues evaluated. How is this decrease triggered during aging? Does the decrease actually cause aging, and, if so, can we stop aging by restoring normal levels of shelterin subunits? Future experiments addressing these questions will certainly shed new light on the increasingly complex and dynamic interaction between telomeres and lifespan.
Materials and Methods
All animals were used in accordance with the guidelines of the French Coordination Committee on Cancer Research and local Home Office regulations.
More specific details on the experimental procedures used for morpholino design and microinjection, immunohistology and qRT-PCRs are given in the Supplementary Experimental Procedures. Data are expressed as means ± SEMs. ANOVA together with the Bonferroni post-hoc or Mann-Whitney test was performed as indicated. A p value < 0.05 was considered to reflect statistical significance.
Supplementary Materials
Author Contributions
NW, KDW, EG, and JY designed the experiments. KDW, YLY, NW, WL, JJ, YC, and XFH performed the experiments. JY, EG, KDW, NW, YLY, and JFM analyzed the data. NW, KDW, EG, and JY wrote the paper. EG, NW and JY are co-senior authors because of their specific roles in coordinating the whole study (EG), the experiments with mice (NW) and the experiments with zebrafishes (JY).
Conflicts of Interest
The authors declare that they have no competing interests.
Funding
Work in the JY/YL laboratories was supported by the National Natural Science Foundation of China (grant numbers 81000875, 81171846, 81270433, 81372099, 81471400, 81522017, and 81671900), the Shanghai Foundation for Basic Research of Science and Technology, China (grant number 13JC1404001), the Foundation for Committee of Science and Technology in Shanghai (grant number 11ZR1422100), and the Shanghai Municipal Education Commission (Oriental Scholars Program). Work in the EG laboratory was supported by the Fondation ARC. KDW was supported by the Association pour la Recherche sur le Cancer and Fondation de France. The work was also supported by the French Government (National Research Agency, ANR) through the "Investments for the Future" LABEX SIGNALIFE program (reference ANR-11-LABX-0028-01).
References
- 1. Gilson E, Géli V. How telomeres are replicated. Nat Rev Mol Cell Biol. 2007; 8:825–38. https://doi.org/10.1038/nrm2259 [PubMed]
- 2. Gomes NM, Shay JW, Wright WE. Telomere biology in Metazoa. FEBS Lett. 2010; 584:3741–51. https://doi.org/10.1016/j.febslet.2010.07.031 [PubMed]
- 3. Giraud-Panis MJ, Pisano S, Benarroch-Popivker D, Pei B, Le Du MH, Gilson E. One identity or more for telomeres? Front Oncol. 2013; 3:48. https://doi.org/10.3389/fonc.2013.00048 [PubMed]
- 4. Palm W, de Lange T. How shelterin protects mammalian telomeres. Annu Rev Genet. 2008; 42:301–34. https://doi.org/10.1146/annurev.genet.41.110306.130350 [PubMed]
- 5. Campisi J, Kim SH, Lim CS, Rubio M. Cellular senescence, cancer and aging: the telomere connection. Exp Gerontol. 2001; 36:1619–37. https://doi.org/10.1016/S0531-5565(01)00160-7 [PubMed]
- 6. Armanios M, Blackburn EH. The telomere syndromes. Nat Rev Genet. 2012; 13:693–704. https://doi.org/10.1038/nrg3246 [PubMed]
- 7. Blackburn EH, Epel ES, Lin J. Human telomere biology: A contributory and interactive factor in aging, disease risks, and protection. Science. 2015; 350:1193–98. https://doi.org/10.1126/science.aab3389 [PubMed]
- 8. Bodnar AG, Ouellette M, Frolkis M, Holt SE, Chiu CP, Morin GB, Harley CB, Shay JW, Lichtsteiner S, Wright WE. Extension of life-span by introduction of telomerase into normal human cells. Science. 1998; 279:349–52. https://doi.org/10.1126/science.279.5349.349 [PubMed]
- 9. Ye J, Renault VM, Jamet K, Gilson E. Transcriptional outcome of telomere signalling. Nat Rev Genet. 2014; 15:491–503. https://doi.org/10.1038/nrg3743 [PubMed]
- 10. Cheng A, Shin-ya K, Wan R, Tang SC, Miura T, Tang H, Khatri R, Gleichman M, Ouyang X, Liu D, Park HR, Chiang JY, Mattson MP. Telomere protection mechanisms change during neurogenesis and neuronal maturation: newly generated neurons are hypersensitive to telomere and DNA damage. J Neurosci. 2007; 27:3722–33. https://doi.org/10.1523/JNEUROSCI.0590-07.2007 [PubMed]
- 11. El Maï M, Wagner KD, Michiels JF, Ambrosetti D, Borderie A, Destree S, Renault V, Djerbi N, Giraud-Panis MJ, Gilson E, Wagner N. The Telomeric Protein TRF2 Regulates Angiogenesis by Binding and Activating the PDGFRβ Promoter. Cell Reports. 2014; 9:1047–60. https://doi.org/10.1016/j.celrep.2014.09.038 [PubMed]
- 12. Jung Y, Lee S, Bang S, Kim S, Choi K, Lee C, Lee SG, Kim CJ, Song K, Lee I. TRF2 is in neuroglial cytoplasm and induces neurite-like processes. FEBS Lett. 2004; 557:129–32. https://doi.org/10.1016/S0014-5793(03)01461-3 [PubMed]
- 13. Ovando-Roche P, Yu JS, Testori S, Ho C, Cui W. TRF2-mediated stabilization of hREST4 is critical for the differentiation and maintenance of neural progenitors. Stem Cells. 2014; 32:2111–22. https://doi.org/10.1002/stem.1725 [PubMed]
- 14. Zhang P, Casaday-Potts R, Precht P, Jiang H, Liu Y, Pazin MJ, Mattson MP. Nontelomeric splice variant of telomere repeat-binding factor 2 maintains neuronal traits by sequestering repressor element 1-silencing transcription factor. Proc Natl Acad Sci USA. 2011; 108:16434–39. https://doi.org/10.1073/pnas.1106906108 [PubMed]
- 15. Zhang P, Abdelmohsen K, Liu Y, Tominaga-Yamanaka K, Yoon JH, Ioannis G, Martindale JL, Zhang Y, Becker KG, Yang IH, Gorospe M, Mattson MP. Novel RNA- and FMRP-binding protein TRF2-S regulates axonal mRNA transport and presynaptic plasticity. Nat Commun. 2015; 6:8888. https://doi.org/10.1038/ncomms9888 [PubMed]
- 16. Fode C, Ma Q, Casarosa S, Ang SL, Anderson DJ, Guillemot F. A role for neural determination genes in specifying the dorsoventral identity of telencephalic neurons. Genes Dev. 2000; 14:67–80. [PubMed]
- 17. Zhang Y, Jin H, Li L, Qin FX, Wen Z. cMyb regulates hematopoietic stem/progenitor cell mobilization during zebrafish hematopoiesis. Blood. 2011; 118:4093–101. https://doi.org/10.1182/blood-2011-03-342501 [PubMed]
- 18. Kishi S, Bayliss PE, Uchiyama J, Koshimizu E, Qi J, Nanjappa P, Imamura S, Islam A, Neuberg D, Amsterdam A, Roberts TM. The identification of zebrafish mutants showing alterations in senescence-associated biomarkers. PLoS Genet. 2008; 4:e1000152. https://doi.org/10.1371/journal.pgen.1000152 [PubMed]
- 19. Zhang P, Pazin MJ, Schwartz CM, Becker KG, Wersto RP, Dilley CM, Mattson MP. Nontelomeric TRF2-REST interaction modulates neuronal gene silencing and fate of tumor and stem cells. Curr Biol. 2008; 18:1489–94. https://doi.org/10.1016/j.cub.2008.08.048 [PubMed]
- 20. Biroccio A, Cherfils-Vicini J, Augereau A, Pinte S, Bauwens S, Ye J, Simonet T, Horard B, Jamet K, Cervera L, Mendez-Bermudez A, Poncet D, Grataroli R, et al. TRF2 inhibits a cell-extrinsic pathway through which natural killer cells eliminate cancer cells. Nat Cell Biol. 2013; 15:818–28. https://doi.org/10.1038/ncb2774 [PubMed]
- 21. Simonet T, Zaragosi LE, Philippe C, Lebrigand K, Schouteden C, Augereau A, Bauwens S, Ye J, Santagostino M, Giulotto E, Magdinier F, Horard B, Barbry P, et al. The human TTAGGG repeat factors 1 and 2 bind to a subset of interstitial telomeric sequences and satellite repeats. Cell Res. 2011; 21:1028–38. https://doi.org/10.1038/cr.2011.40 [PubMed]
- 22. Laye MJ, Solomon TP, Karstoft K, Pedersen KK, Nielsen SD, Pedersen BK. Increased shelterin mRNA expression in peripheral blood mononuclear cells and skeletal muscle following an ultra-long-distance running event. J Appl Physiol (1985). 2012; 112:773–81. https://doi.org/10.1152/japplphysiol.00997.2011 [PubMed]
- 23. Yeung F, Ramírez CM, Mateos-Gomez PA, Pinzaru A, Ceccarini G, Kabir S, Fernández-Hernando C, Sfeir A. Nontelomeric role for Rap1 in regulating metabolism and protecting against obesity. Cell Reports. 2013; 3:1847–56. https://doi.org/10.1016/j.celrep.2013.05.032 [PubMed]
- 24. Martínez P, Gómez-López G, García F, Mercken E, Mitchell S, Flores JM, de Cabo R, Blasco MA. RAP1 protects from obesity through its extratelomeric role regulating gene expression. Cell Reports. 2013; 3:2059–74. https://doi.org/10.1016/j.celrep.2013.05.030 [PubMed]
- 25. Diala I, Wagner N, Magdinier F, Shkreli M, Sirakov M, Bauwens S, Schluth-Bolard C, Simonet T, Renault VM, Ye J, Djerbi A, Pineau P, Choi J, et al. Telomere protection and TRF2 expression are enhanced by the canonical Wnt signalling pathway. EMBO Rep. 2013; 14:356–63. https://doi.org/10.1038/embor.2013.16 [PubMed]