


Introduction
The rate of living theory, one of the oldest theories of aging, suggests that the mass-specific lifetime energy expenditure of organisms is independent on body mass [1,2]. Two interspecific scaling laws of mammals provide strong support to this theory. The mass-specific field metabolic rate, which is equivalent to the average rate of daily energy expenditure (DEE), generally scales with body mass to a power around −0.25 across mammalian species with the body mass ranging from 7 to 100,000 grams [3,4], whereas the scaling power of lifespan is roughly +0.25 [5] or slightly lower (+0.21) [6]. Thus, larger mammalian species have lower mass-specific daily energy expenditure rate but longer lifespan than smaller ones. Consequently, with a few exceptions, the product of these two traits, which gives the lifetime energy usage per body mass, is approximately a constant across species.
However, intra-specific scaling laws of a broad range of dog breeds challenge the theory. Mass-specifically, the dog’s metabolic scaling power is −0.31 [7,8]. According to the rate of living theory, the lifespan of dogs would scale with body mass to a power around 0.30, i.e., larger dogs would live longer. But an opposite trend has been well-documented [7,9–13]. For example, Comfort [14] found that in four breeds of dogs, the scaling power of maximum lifespan is −0.15, and data collected in this study show a −0.096 scaling power for the average lifespan across 90 breeds of dogs (Figure 1 and Supplementary data).
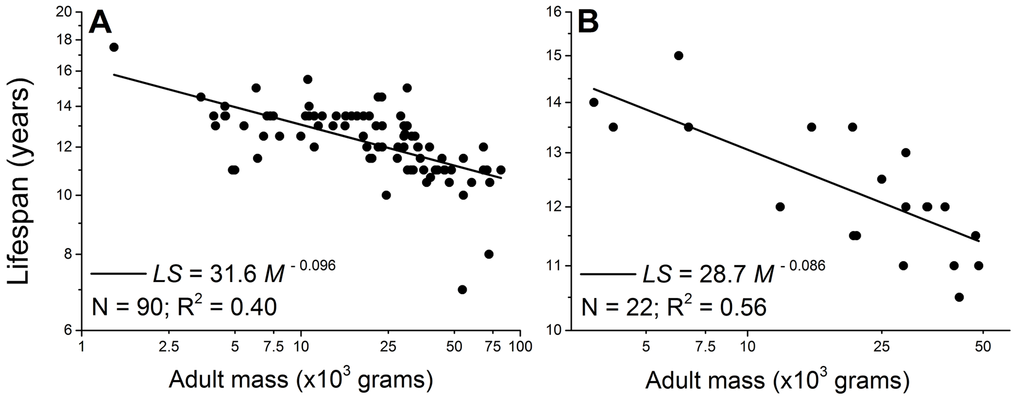
Figure 1. Lifespan negatively scales with adult body mass in male (A) and female dogs (B). Each point represents one breed. The scaling powers were obtained by regressing the logarithmically transformed data.
The negative correlation between longevity and body mass in dogs has been a long-standing question in the study of aging [7,9,12]. Similar negative correlations have been noticed in other species, such as rodents [15] and humans [16]. But most research on this topic remains either descriptive, such as a few statistical analysis [7,10,13,15,17], or qualitative, such as the thermoregulation hypothesis [9], which postulates that because of the high surface-to-volume ratio, small dogs spend more energy to generate heat by decoupling proton transport from ATP generation, and therefore have lower production of deleterious oxygen free radicals. Still largely missing is the answer to the key question: why do interspecifically smaller mammals live shorter, while intra-specifically, smaller breeds or strains live longer than larger ones? None of the previous studies, descriptive or mechanistic, offered a general theory that is able to reconcile these opposite trends within the same framework, and make quantitative predictions.
Here, we apply a theoretical model based on the first principle of energy conservation to reveal the energetic mechanism underlying this paradox. The key idea of the model lies in the tradeoff between the energy allocations to biosynthesis during growth and health maintenance. The quantitative predictions of the model are well-supported by empirical data on body mass, metabolic rate, and lifespan from a broad spectrum of wild animals and more than 200 studies on laboratory rodents that are under food restriction or genetically manipulated [18,19]. Applying this model to dogs, we show that when searching for the explanations for the negative correlation between longevity and adult body mass of dogs, all the previous studies have ignored the ratio of birth mass and adult mass, which is the key to understanding this issue. A lower ratio indicates that animals spend relatively more energy on growth to reach adult size, and therefore will have relatively less energy for health maintenance efforts, such as scavenging free radicals and repairing oxidative cellular damage. Consequently, the breed with a lower birth/adult mass ratio will have a shorter lifespan.
The tradeoff between growth and longevity has been investigated in many intra-specific studies. Rapid growth promotes a series of oxidative cellular damage, such as increased phospholipid peroxidation [20], increased protein carbonyl content [21], decreased antioxidant defenses in red blood cells [22], and elevated free radical processes [23]. The growth-induced cellular damage accumulates during development, and has long-term adverse effects on animals’ health maintenance and longevity, even in species, whose developmental stage is much shorter than lifespan, such as rodents and humans [24–27]. Several theoretical efforts have been made to understand the negative correlation between growth and longevity (e.g., [27–31]). Most of the previous works employ evolutionary approaches, and are more or less qualitative. The model we present here does not consider reproductive success or the external mortality rate (though they can be potentially included in this model, see [32]). Our model focuses on the physiological basis of growth and longevity. Using only one free-floating parameter, which can be verified independently, the model accurately predicts the relationship between birth mass, adult mass, metabolic rate, and lifespan of dogs. More importantly, the model reveals a general theory, and suggests that the conventional interspecific rate of living theory and the intra-specific negative correlations between lifespan and body size observed in dogs and rodents under food restriction are all special cases, which can be explained by one general equation simultaneously.
The theoretical model
The model is based on three assumptions [18,19,33,34].
Assumption 1: Oxidative metabolism produces free radicals such as reactive oxygen species (ROS), which cause damage to macromolecules [35,36]. We assume that the rate of damage production, H, is proportional to field metabolic rate (equivalent to daily energy expenditure), B, with a coefficient δ, i.e.,
Assumption 2: Organisms have evolved mechanisms to scavenge radicals and repair cellular damage, which cost metabolic energy. We assume that the rate of scavenging/repair, R, is proportional to the rate of energy available for health maintenance, Bmaint, with a coefficient η, i.e.,
The net damage accumulates as an integral of time,
Equation 1 estimates a theoretical profile of the damage accumulation during ontogeny. The growth curve m(t) can be determined by the equation
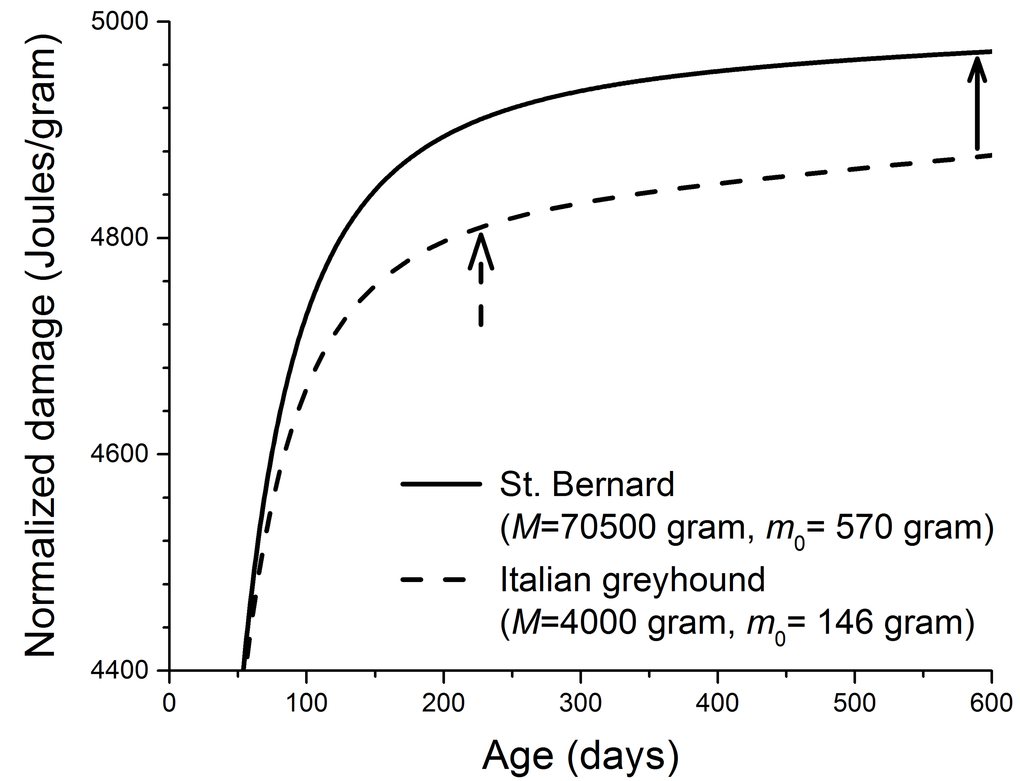
Figure 2. Calculated cellular damage increases as a function of age in two dog breeds. (physiological parameters in Eq. 1 required to produce this figure: B0 = 3158 Joules/(day.gram0.69) [7,8], Em = 5000 Joules/gram, and ε = 0.999) [34,40,53]. The solid and dashed arrows indicate the ages at which ~ 90% of the adult masses are reached in two dog breeds. These ages were estimated from the growth equation,
The cellular damage in our model is general. It includes the oxidative assaults on lipid, protein, and DNA, which are predicted to increase rapidly during growth and then slow down once adulthood is reached (Figure 2). The existing evidence to test this prediction is limited. Here we suggest that telomere length can be a good candidate for biomarker of cellular damage to test this prediction directly. Telomere length declines with DNA replication in cells that lack enzyme telomerase. One important cause of the telomere shortening, besides the “end-replication problem”, is oxidative stress, which causes DNA single-strand-breaks (SSB) [46–49]. The repair of SSB in telomere is imperfect, and the unrepaired SSB are lost during cell replication, and that results in the shortening of telomere [48,50]. It is possible that during growth, due to the insufficient energy and resource, the SSB repair is inefficient and the length of telomere declines rapidly, and the rate of decline slows as animals mature. It has been found that across 15 dog breeds, the telomere length in blood mononuclear cells is a strong predictor of lifespan [51]. However, the existing data on the rate of telomere loss have low temporal resolution, and in many cases are only available in adult animals. Thus, we call for future studies to assay the profiles of telomere length over ontogeny.
Assumption 3: We assume that animals die when the mass-specific cellular damage level D(t) reaches a threshold C, i.e.,
Now we compare two breeds of dogs, denoted by i and j. Assumption 3 suggests that when lifespan is reached, these two breeds of dogs will have the same damage level, i.e.,
Equation 2 is our main theoretical result. B0M α−1LS on the left hand side is nothing but mass-specific lifetime energy usage, which we will denote as LE for convenience. Thus, Eq. 2 makes a simple prediction: the difference in LE (
It is straightforward to test this prediction. We need to emphasize that Eq.2 has only one free floating parameter—the species-specific protective efficiency ε. The normalization metabolic coefficient B0 of dogs was measured as 3158 Joules/(day.gram0.69) [7,8], and the energy for synthesizing one unit of bio-tissue Em is a constant within a species, averaging around 5000 Joules/gram in dogs and other mammals [34,40,53]. Previous studies have collected data on average adult mass and average lifespan of dogs, but as far as we know, data on birth mass is not available in any existing dataset. Fortunately, numerous dog owners have recorded the birth masses of a broad range of breeds. Thus, following the approach taken by many researchers (e.g., [9,10]), who collected data on from web-based resources primarily generated by breeders, we were able to obtain data on 90 breeds of male dogs and 22 breeds of females. When multiple sources give different values for a certain breed, we took the average value. The data are available in Supplementary Material.
Results
Birth/adult mass ratio and scaling law of lifespan of dogs
Figure 3A and 3B show that the birth mass of dog scales sub-linearly with the adult mass. Consequently, the birth/adult mass ratio µ scales with the adult mass to powers of −0.55 and −0.51 for male and females, respectively (Figure 3C and 3D), indicating that larger dogs have relatively smaller birth mass. To obtain the scaling powers in these panels, we first logarithmically transformed the data, and then performed linear regression.
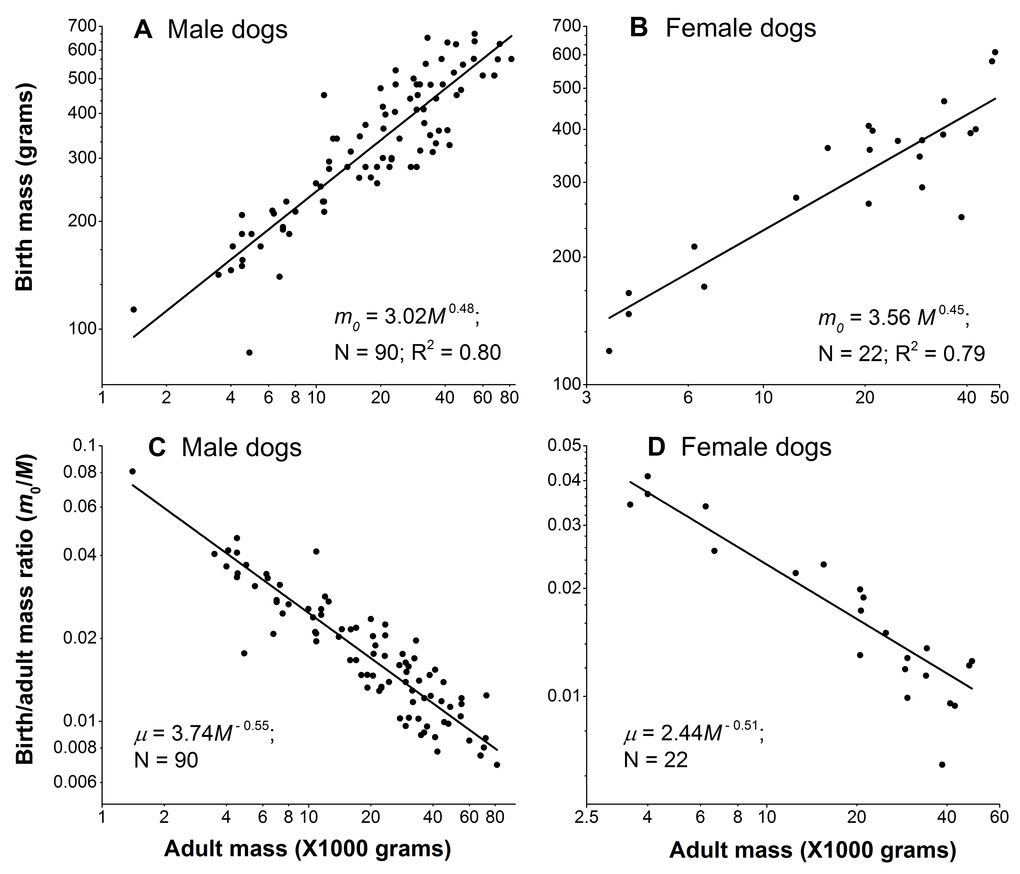
Figure 3. Birth mass is not proportional to adult mass in dogs. (A) and (B): Birth mass scales with adult mass sub-linearly in male and female dogs, respectively. (C) and (D): Birth/adult mass ratio negatively scale with adult mass in male and female dogs, respectively. Each point represents one breed. In each gender, the sum of the absolute values of the scaling powers of the birth mass and the ratio, in principle, should be equal to 1. They are close, but not exactly equal to 1, because dividing the birth mass by the adult mass M in the ratio, µ = m0/M, introduces noise from M. Nonetheless, as Figure 3 shows, the noise is negligible, as the sums of the powers are 0.48+0.55 = 1.03 in males and 0.45+0.51 = 0.96 in female dogs.
Our model suggests that the non-zero scaling power of µ gives rise to the negative correlation between lifespan and adult mass in dogs. Using Assumption 3 and Eq. 1, we estimate the mass-specific cellular damage level in an organism when the lifespan is reached:
If µ is a constant or weakly scales with body mass, then we have
Mass-specific lifetime energy usage is proportional to birth/adult mass ratio
We now test the prediction by Eq.2: the difference in lifetime energy usage (∆LE) between breeds is proportional to the difference in birth/adult mass ratio (∆µ) multiplied by the energy for synthesizing one unit of biomass (Em) with a constant b = ε/(1−ε), i.e., ∆LE = b×Em∆µ. Within each gender, we took one breed as the reference (j), and calculated ∆LE = LEi − LEj and Em∆µ = Em(µi − µj) between other breeds (i’s) and this reference breed. We then linearly regressed ∆LE on Em∆µ in two ways, fixing the intercept at zero in accordance with Eq. 2 and letting it float to allow variation. We took all the breeds as the reference in turn, and obtained 90 male sets and 22 female sets of ∆LE versus Em∆µ, each containing 90 and 22 data points. Figure 4A-4D show four examples of the results using small breeds and large breeds as the references. The regression results of all the male and female sets are listed in Table 1. When intercept was fixed at zero as it is in Eq 2, the standard deviation of the fitted slopes among all the sets is small (coefficient of variation, SD/mean, of the slopes = ±15%). When the intercept is allowed to float, the fitted slope is the same regardless of which breed is used as the reference but the intercept varies. The fitted slope when intercept allowed to float is close to the mean value with a fixed intercept, and the fitted intercepts among all the datasets are normally distributed with the center at zero (−1< skewness <1). These results indicate that a constant slope with zero intercept is reasonable. The constant slope from the linear regression and the high R2 values strongly support our prediction that the mass-specific lifetime energy usage is proportional to the birth/adult mass ratio.
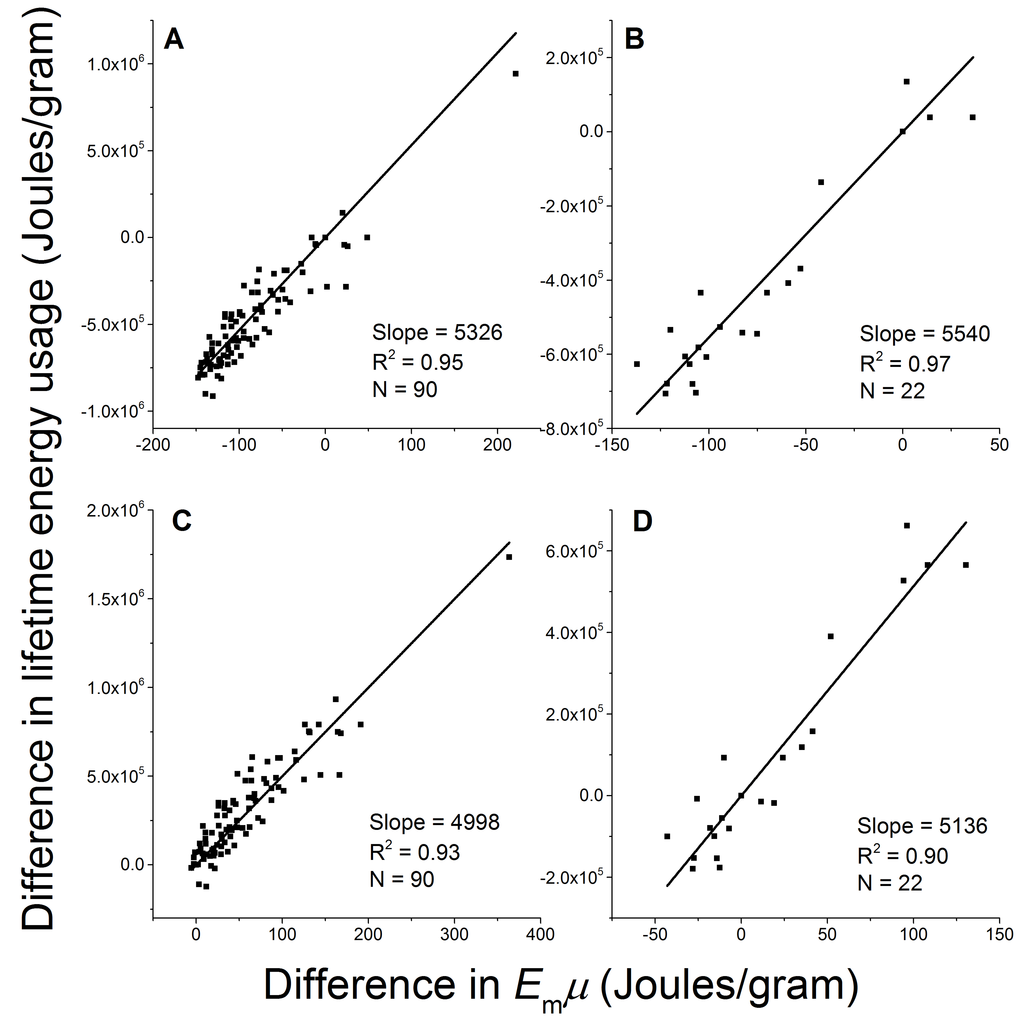
Figure 4. The difference in mass-specific lifetime energy usage is proportional to the difference in birth/adult mass ratio between breeds. Four examples of fitting Eq. 2 with empirical data and fixing intercept at zero using (A) male Italian greyhound (M=4000 gram), (B) female Colon de Tulear (M=6250 gram), (C) male St. Bernard (M=70500 gram), and (D) female Chinook (M=25000 gram) as references.
Table 1. Linear regression results of Eq. 2
| Regression method | Slope (Mean ± S.D.) | Intercept (Mean ± S.D.) | R2 value (Mean ± S.D.) | Fisher skewness | |||||||||||||||||||||||||||||||||||||||||||||||||||||||||||||||||||||||||||||||||||||||||||||||
| Male (90 sets) | Fixed intercept = 0 | 4623 ± 720 | 0 | 0.74 ± 0.15 | −0.267 | ||||||||||||||||||||||||||||||||||||||||||||||||||||||||||||||||||||||||||||||||||||||||||||||
| Floating intercept | 4572 | −1.66×10⁻¹¹±109713 | 0.849 | 0.00782 | |||||||||||||||||||||||||||||||||||||||||||||||||||||||||||||||||||||||||||||||||||||||||||||||
| Female (22 sets) | Fixed intercept = 0 | 5164 ± 750 | 0 | 0.84 ± 0.07 | −0.0545 | ||||||||||||||||||||||||||||||||||||||||||||||||||||||||||||||||||||||||||||||||||||||||||||||
| Floating intercept | 5138 | 3.46×10⁻¹¹± 86383 | 0.897 | −0.619 | |||||||||||||||||||||||||||||||||||||||||||||||||||||||||||||||||||||||||||||||||||||||||||||||
| Linear regression results of Eq. 2, LEi – LEj = b×Em(µi − µj) using data from male and female dogs, where LEi – LEj is the difference in mass-specific lifetime energy usage between the reference dog breed (j) and other breeds (i’s) in unit of energy/mass (joules/gram), and Em(µi − µj) is the difference in birth/adult mass ratio between other breeds (i’s) and the reference breed (j) multiplied by the energy required to synthesis one unit of biomass, Em, also in unit of energy/mass (joules/gram). Thus, the slope of the linear regression, b, is unitless. For male dogs, we took 90 breeds as the reference breed (j) in turn, and obtained 90 sets of regression, and for female dogs, we obtained 22 sets. This table shows the mean values and standard deviation of the slopes and intercepts of these regressions. | |||||||||||||||||||||||||||||||||||||||||||||||||||||||||||||||||||||||||||||||||||||||||||||||||||
Discussion
We have presented a theoretical model based on the first principles in attempt to explain the negative correlation between lifespan and body size of dogs. The essence of the model lies in the energy tradeoff between somatic maintenance and biosynthesis. In recent years, increasing empirical evidence show such a tradeoff at the cellular/molecular level. For example, the growth-promoting pathways such as mTOR (mechanistic Target of Rapamycin) also drive aging [54,55]. Another example is that high uncoupling protein expression in mitochondria slows down growth, and also reduces ROS production and cellular damage [56]. While such studies have helped to identify the mediators of the tradeoff at the molecular and cellular level, our theoretical model at the whole organismal level offers a collective framework that quantitatively analyzes the integrative and synergetic effects of these molecular pathways. Using generic principles, the model specifies the detailed energy budget underlying the tradeoff between growth and longevity, and makes quantitative predictions that are strongly supported by the empirical data.
One of the results of our model is that the scaling powers of birth/adult mass ratio of dogs plays an important role in the negative correlation between lifespan and adult size. Using data from 90 breeds of dogs, we estimated this scaling power to be around −0.55 (Figure 3). This is close to the previous finding, −0.44, which was obtained from a smaller sample size (N=8, R2 = 0.97) [7]. The strong negative scaling powers of the birth/adult mass ratio in dogs are sharply different than that of across mammalian species. Life history theory models have commonly assumed this ratio to be a constant for mammals interspecifically (e.g., [57]). Recently, using a large dataset Hamilton, Davidson [58] concluded that this ratio across placental mammalian species weakly scales with adult mass to a power of −0.07.
Our model assumes a threshold damage level C for death, i.e.,
Kraus et al [13] recently found from mortality curves of 74 breeds of dogs that larger breeds have shorter lifespan because they have faster aging rate. Aging rate is mainly a statistical concept based on the mortality curves, and the physiological foundation of it remains unclear. It is possible that aging rate is linked to rate of damage accumulation, i.e., the faster the damage accumulates, the faster the aging is. The quantitative details of the relationship between aging rate and damage is unknown. However, our model predicts that larger breeds have faster damage accumulation rates (an example shown in Figure 2). So, if aging rate is indeed related to damage accumulation rate, then qualitatively our model makes a conclusion that agrees with what Kraus et al found.
The biosynthesis discussed in this paper only involves growth. Nonetheless, reproduction is another important process that requires a considerable amount of energy for biosynthesis, and therefore presumably also channels energy from health maintenance, as many researchers have suggested (e.g., see [60]). In this paper, we did not address the potential effects of reproduction on longevity for three reasons. First, the data on litter size of dogs are not available to us. Second, the data from male dogs agree with our model very well, whereas the biosynthetic requirement for male dogs’ reproduction is presumably minimal. Third, and more importantly, there is no quantitative understanding on how energetically costly mammalian reproduction is. Some researchers assume that reproduction simply diverts the biosynthetic effort from self-growth to offspring production, and modeled the energy cost of reproduction based on this assumption (e.g [57]. However, energy content of bio-tissue is not equal to the energy required to synthesize the tissue [40], and the latter is the parameter Em in our model. That is to say, even if one unit of biomass of the fetus has the same amount of combustion energy (energy content) as that of the mother, the amount of metabolic energy spent on synthesizing them may be different. For example, Hou, Bolt [33] have found that in some mammalian species, the energy cost for biosynthesis (Em) is about 4-fold cheaper for fetal development than that for post-natal growth. Thus, although reproduction has been shown to tradeoff with longevity in some species, such as fruit flies [61], a theoretical model based on the first principles and quantitative data analysis are yet to be developed.
Three important points of our results need clarification. First, the tradeoff between biosynthesis and maintenance is not imposed by the food supply, which is usually unlimited for domestic dogs. It is imposed by the fact that resting metabolic rate is roughly fixed for a given body size. The typical energy budget models (e.g., [40–42,62]) partition the field metabolic rate (B) between the rates of energy for maintenance (Bmaint), the energy required for biosynthesizing new bio-tissues during growth (Bsyn), and the rate of energy spent on activities (Bact), i.e., B = Bmaint + Bsyn + Bact. The sum of the first two, Bmaint and Bsyn, is the resting metabolic rate [40–42,62]. For free-ranging animals, the ratio of field and resting metabolic rate is approximately a constant, so the energy cost for activities (Bact = B − Brest) is also a constant fraction of field metabolic rate B [3,43,53]. Thus, for a given body mass during growth, the energy available for both maintenance and biosynthesis only varies in a very narrow range, if there is no experimental manipulations. This narrow range is the reason for the tradeoff between Bmaint and Bsyn. Food supply may be unlimited, but animals typically do not uptake more than the amount that is roughly determined by their body size, if there is no environmental or experimental stresses [40,62,63]. Nonetheless, many environmental stresses or experimental manipulations, such as cold exposure and forced-exercise, can change the total energy intake and energy partition. For example, heavy exercise increases animal’s field metabolic rate. If food supply is unlimited, animals can simply increase the food intake to meet the increased demand imposed by the exercises [64]. In this case, the increase in field metabolic rate (B) comes from the increase in Bact, but the resting metabolic rate, which is mainly determined by their body mass as Bomα, will not change, so that the tradeoff between maintenance and biosynthesis will keep the same. But, if animals are under food restriction, then long-term heavy exercises will suppress growth and reshuffle the energy budget. Depending on the degree of the exercises, the impacts on health maintenance may vary from negative, none, to positive (see detailed discussion in [19]). For domestic dogs discussed in this paper, some breeds may have higher mass-specific activity-induced energy cost than the others. But since the food supply is generally unlimited, the resting metabolic rate will not be affected by the exercise, and therefore the tradeoff between maintenance and growth will not be affected either, in general.
Second, there is only one free floating parameter in Eq.2—the species-specific protective efficiency ε, which expresses the ratio of damage repair and damage generation. Although ε cannot be directly measured, the fittings of data from more than 200 rodents and the theoretical estimate of protein oxidative damage and repair in mammals suggest that the value of ε is around 0.99 [18,33]. From the fitted slopes
Third, and more importantly, we need to emphasize that the relationship between LE and µ predicted by Eq.2 is general, and it can be applied to three kinds of special cases. The special case investigated in this study is dog breeds with different birth masses and adult masses, and therefore different ratios. As an indicator for energy allocated to biosynthesis, a higher µ means more energy allocated to maintenance, and therefore a longer lifespan. In a previous study [18], we applied Eq. 2 to explain another special case—the lifespan extension by food restriction in rodents, in which each pair of i (food restricted) and j (ad libitum free fed controls) has the same birth mass (m0), but different adult masses due to different food supply levels. Thus, Eq. 2 becomes
A previous life history model [57,65] suggested that the positive scaling power of lifespan across mammalian species stems from maximizing the net reproductive rate of non-growing populations with respect to maturation age, taking consideration of external mortality before maturity. Our model, on the other hand, highlights the importance of the physiological basis of the lifespan scaling laws. For domestic dogs, the artificial selection perhaps targets body size (and growth rate) along with other traits, such as personality, instead of net reproductive rate. Through the energy tradeoff between biosynthetic cost and health maintenance revealed in this study, the variation in body size (and birth/adult mass ratio) leads to the variation in lifespan in dogs. Lifespan extension by food restriction, which is usually conducted within one generation, gives prominence to the physiological basis, especially the plasticity of growth, even more. Since both Charnov’s life history model and our physiological model derive the interspecific lifespan scaling law, there must be a bridge and perhaps some common hidden assumptions that connect these models. It requires future research to reconcile these models and integrate the relevant physiological and life history traits, as well as the environmental factors, for a general unified theory of lifespan scaling laws.
Supplementary Materials
Acknowledgements
We thank Dr. Wenyun Zuo, Dr. Eric Charnov, and Dr. James J. Anderson for useful discussions, and Dr. Neil Metcalfe for excellent suggestions that greatly improve the quality of this paper.
Conflicts of Interest
No conflicts of interest, financial or otherwise, are declared by the authors.
References
- 1. Rubner M. (1908). Das Problem der Lebensdauer und seine Beziehungen sum Wachstum und Ernahrung. (Munich: Oldenbourg).
- 2. Pearl R. (1928). The rate of living. (London: University of London).
- 3. Nagy KA, Girard IA, Brown TK. Energetics of free-ranging mammals, reptiles, and birds. Annu Rev Nutr. 1999; 19:247–77. https://doi.org/10.1146/annurev.nutr.19.1.247 [PubMed]
- 4. Savage VM, Gillooly JF, Woodruff WH, West GB, Allen AP, Enquist BJ, Brown JH. The predominance of quarter-power scaling in biology. Funct Ecol. 2004; 18:257–82. https://doi.org/10.1111/j.0269-8463.2004.00856.x
- 5. McCoy MW, Gillooly JF. Predicting natural mortality rates of plants and animals. Ecol Lett. 2008; 11:710–16. https://doi.org/10.1111/j.1461-0248.2008.01190.x [PubMed]
- 6. Speakman JR. Body size, energy metabolism and lifespan. J Exp Biol. 2005; 208:1717–30. https://doi.org/10.1242/jeb.01556 [PubMed]
- 7. Kirkwood JK. The influence of size on the biology of the dog. J Small Anim Pract. 1985; 26:97–110. https://doi.org/10.1111/j.1748-5827.1985.tb02090.x
- 8. Kunde MM, Steinhaus AH. Studies on metabolism IV. The basal metabolic rate of normal dogs. Am J Physiol. 1926; 78:127–35.
- 9. Speakman JR, van Acker A, Harper EJ. Age-related changes in the metabolism and body composition of three dog breeds and their relationship to life expectancy. Aging Cell. 2003; 2:265–75. https://doi.org/10.1046/j.1474-9728.2003.00061.x [PubMed]
- 10. Greer KA, Canterberry SC, Murphy KE. Statistical analysis regarding the effects of height and weight on life span of the domestic dog. Res Vet Sci. 2007; 82:208–14. https://doi.org/10.1016/j.rvsc.2006.06.005 [PubMed]
- 11. Galis F, Van der Sluijs I, Van Dooren TJ, Metz JA, Nussbaumer M. Do large dogs die young? J Exp Zoolog B Mol Dev Evol. 2007; 308:119–26. https://doi.org/10.1002/jez.b.21116 [PubMed]
- 12. Selman C, Nussey DH, Monaghan P. Ageing: it’s a dog’s life. Curr Biol. 2013; 23:R451–53. https://doi.org/10.1016/j.cub.2013.04.005 [PubMed]
- 13. Kraus C, Pavard S, Promislow DE. The size-life span trade-off decomposed: why large dogs die young. Am Nat. 2013; 181:492–505. https://doi.org/10.1086/669665 [PubMed]
- 14. Comfort A. Longevity and mortality in dogs of four breeds. J Gerontol. 1960; 15:126–29. https://doi.org/10.1093/geronj/15.2.126 [PubMed]
- 15. Rollo CD. Growth negatively impacts the life span of mammals. Evol Dev. 2002; 4:55–61. https://doi.org/10.1046/j.1525-142x.2002.01053.x [PubMed]
- 16. Samaras TT, Storms LH, Elrick H. Longevity, mortality and body weight. Ageing Res Rev. 2002; 1:673–91. https://doi.org/10.1016/S1568-1637(02)00029-6 [PubMed]
- 17. Patronek GJ, Waters DJ, Glickman LT. Comparative longevity of pet dogs and humans: implications for gerontology research. J Gerontol A Biol Sci Med Sci. 1997; 52:B171–78. https://doi.org/10.1093/gerona/52A.3.B171 [PubMed]
- 18. Hou C. The energy trade-off between growth and longevity. Mech Ageing Dev. 2013; 134:373–80. https://doi.org/10.1016/j.mad.2013.07.001 [PubMed]
- 19. Hou C, Amunugama K. On the complex relationship between energy expenditure and longevity: reconciling the contradictory empirical results with a simple theoretical model. Mech Ageing Dev. 2015; 149:50–64. https://doi.org/10.1016/j.mad.2015.06.003 [PubMed]
- 20. Nussey DH, Pemberton JM, Pilkington JG, Blount JD. Life history correlates of oxidative damage in a free-living mammal population. Funct Ecol. 2009; 23:809–17. https://doi.org/10.1111/j.1365-2435.2009.01555.x
- 21. Forster MJ, Sohal BH, Sohal RS. Reversible effects of long-term caloric restriction on protein oxidative damage. J Gerontol A Biol Sci Med Sci. 2000; 55:B522–29. https://doi.org/10.1093/gerona/55.11.B522 [PubMed]
- 22. Alonso-Alvarez C, Bertrand S, Faivre B, Sorci G. Increased susceptibility to oxidative damage as a cost of accelerated somatic growth in zebra finches. Funct Ecol. 2007; 21:873–79. https://doi.org/10.1111/j.1365-2435.2007.01300.x
- 23. Rollo CD, Carlson J, Sawada M. Accelerated aging of giant transgenic mice is associated with elevated free radical processes. Canadian Journal of Zoology-Revue Canadienne De Zoologie. 1996; 74:606–20. https://doi.org/10.1139/z96-070
- 24. Merry BJ. Effect of dietary restriction on aging – an update. Rev Clin Gerontol. 1995; 5:247. https://doi.org/10.1017/S0959259800004305
- 25. Bartke A. Minireview: role of the growth hormone/insulin-like growth factor system in mammalian aging. Endocrinology. 2005; 146:3718–23. https://doi.org/10.1210/en.2005-0411 [PubMed]
- 26. Miller RA, Harper JM, Galecki A, Burke DT. Big mice die young: early life body weight predicts longevity in genetically heterogeneous mice. Aging Cell. 2002; 1:22–29. https://doi.org/10.1046/j.1474-9728.2002.00006.x [PubMed]
- 27. Metcalfe NB, Monaghan P. Growth versus lifespan: perspectives from evolutionary ecology. Exp Gerontol. 2003; 38:935–40. https://doi.org/10.1016/S0531-5565(03)00159-1 [PubMed]
- 28. Lee W-S, Metcalfe NB, Monaghan P, Mangel M. A comparison of dynamic-state-dependent models of the trade-off between growth, damage, and reproduction. Am Nat. 2011; 178:774–86. https://doi.org/10.1086/662671 [PubMed]
- 29. Mangel M. Environment and longevity: the demography of the growth rate. Popul Dev Rev. 2003; 29:57–70.
- 30. Mangel M, Stamps J. Trade-offs between growth and mortality and the maintenance of individual variation in growth. Evol Ecol Res. 2001; 3:583–93.
- 31. Ricklefs RE. Embryo development and ageing in birds and mammals. Proceedings of the Royal Society B: Biological Sciences. 2006; 273(1597):2077-2082.
- 32. Jiao L, Amunugama K, Hayes M, Jennings M, Domingo A, Hou C. Food restriction alters energy allocation strategy during growth in tobacco hornworms (Manduca sexta larvae). Naturwissenschaften. 2015; 102:40–50.
- 33. Hou C, Bolt KM, Bergman A. Energetic basis of correlation between catch-up growth, health maintenance, and aging. J Gerontol A Biol Sci Med Sci. 2011; 66:627–38. https://doi.org/10.1093/gerona/glr027 [PubMed]
- 34. Hou C. Increasing energetic cost of biosynthesis during growth makes refeeding deleterious. Am Nat. 2014; 184:233–47. https://doi.org/10.1086/676856 [PubMed]
- 35. Barja G. Updating the mitochondrial free radical theory of aging: an integrated view, key aspects, and confounding concepts. Antioxid Redox Signal. 2013; 19:1420–45. https://doi.org/10.1089/ars.2012.5148 [PubMed]
- 36. Balaban RS, Nemoto S, Finkel T. Mitochondria, oxidants, and aging. Cell. 2005; 120:483–95. https://doi.org/10.1016/j.cell.2005.02.001 [PubMed]
- 37. Heise K, Puntarulo S, Pörtner HO, Abele D. Production of reactive oxygen species by isolated mitochondria of the Antarctic bivalve Laternula elliptica (King and Broderip) under heat stress. Comp Biochem Physiol C Toxicol Pharmacol. 2003; 134:79–90. https://doi.org/10.1016/S1532-0456(02)00212-0 [PubMed]
- 38. Ku HH, Brunk UT, Sohal RS. Relationship between mitochondrial superoxide and hydrogen peroxide production and longevity of mammalian species. Free Radic Biol Med. 1993; 15:621–27. https://doi.org/10.1016/0891-5849(93)90165-Q [PubMed]
- 39. Mortelette H, Moisan C, Sébert P, Belhomme M, Amérand A. Fish as a model in investigations about the relationship between oxygen consumption and hydroxyl radical production in permeabilized muscle fibers. Mitochondrion. 2010; 10:555–58. https://doi.org/10.1016/j.mito.2010.05.002 [PubMed]
- 40. Hou C, Zuo W, Moses ME, Woodruff WH, Brown JH, West GB. Energy uptake and allocation during ontogeny. Science. 2008; 322:736–39. https://doi.org/10.1126/science.1162302 [PubMed]
- 41. Brody S. (1945). Bioenergetics and growth. (New York: Reinhold).
- 42. West GB, Brown JH, Enquist BJ. A general model for ontogenetic growth. Nature. 2001; 413:628–31. https://doi.org/10.1038/35098076 [PubMed]
- 43. Blaxter KL. (1989). Energy Metabolism in Animals and Man. (Cambridge, U.K.: Cambridge Univ. Press).
- 44. Salin K, Auer SK, Rudolf AM, Anderson GJ, Cairns AG, Mullen W, Hartley RC, Selman C, Metcalfe NB. Individuals with higher metabolic rates have lower levels of reactive oxygen species in vivo. Biol Lett. 2015; 11:20150538. https://doi.org/10.1098/rsbl.2015.0538 [PubMed]
- 45. Amunugama K, Jiao L, Olbricht GR, Walker C, Huang YW, Nam PK, Hou C. Cellular oxidative damage is more sensitive to biosynthetic rate than to metabolic rate: A test of the theoretical model on hornworms (Manduca sexta larvae). Exp Gerontol. 2016; 82:73–80. https://doi.org/10.1016/j.exger.2016.05.015 [PubMed]
- 46. Houben JM, Moonen HJ, van Schooten FJ, Hageman GJ. Telomere length assessment: biomarker of chronic oxidative stress? Free Radic Biol Med. 2008; 44:235–46. https://doi.org/10.1016/j.freeradbiomed.2007.10.001 [PubMed]
- 47. Cattan V, Mercier N, Gardner JP, Regnault V, Labat C, Mäki-Jouppila J, Nzietchueng R, Benetos A, Kimura M, Aviv A, Lacolley P. Chronic oxidative stress induces a tissue-specific reduction in telomere length in CAST/Ei mice. Free Radic Biol Med. 2008; 44:1592–98. https://doi.org/10.1016/j.freeradbiomed.2008.01.007 [PubMed]
- 48. Richter T, Saretzki G, Nelson G, Melcher M, Olijslagers S, von Zglinicki T. TRF2 overexpression diminishes repair of telomeric single-strand breaks and accelerates telomere shortening in human fibroblasts. Mech Ageing Dev. 2007; 128:340–45. https://doi.org/10.1016/j.mad.2007.02.003 [PubMed]
- 49. Petersen S, Saretzki G, von Zglinicki T. Preferential accumulation of single-stranded regions in telomeres of human fibroblasts. Exp Cell Res. 1998; 239:152–60. https://doi.org/10.1006/excr.1997.3893 [PubMed]
- 50. Richter T, von Zglinicki T. A continuous correlation between oxidative stress and telomere shortening in fibroblasts. Exp Gerontol. 2007; 42:1039–42. https://doi.org/10.1016/j.exger.2007.08.005 [PubMed]
- 51. Fick LJ, Fick GH, Li Z, Cao E, Bao B, Heffelfinger D, Parker HG, Ostrander EA, Riabowol K. Telomere length correlates with life span of dog breeds. Cell Reports. 2012; 2:1530–36. https://doi.org/10.1016/j.celrep.2012.11.021 [PubMed]
- 52. Sohal RS, Orr WC. The redox stress hypothesis of aging. Free Radic Biol Med. 2012; 52:539–55. https://doi.org/10.1016/j.freeradbiomed.2011.10.445 [PubMed]
- 53. Moses ME, Hou C, Woodruff WH, West GB, Nekola JC, Zuo W, Brown JH. Revisiting a model of ontogenetic growth: estimating model parameters from theory and data. Am Nat. 2008; 171:632–45. https://doi.org/10.1086/587073 [PubMed]
- 54. Leontieva OV, Paszkiewicz GM, Blagosklonny MV. Mechanistic or mammalian target of rapamycin (mTOR) may determine robustness in young male mice at the cost of accelerated aging. Aging (Albany NY). 2012; 4:899–916. https://doi.org/10.18632/aging.100528 [PubMed]
- 55. Blagosklonny MV. Big mice die young but large animals live longer. Aging (Albany NY). 2013; 5:227–33. https://doi.org/10.18632/aging.100551 [PubMed]
- 56. Salin K, Auer SK, Rey B, Selman C, Metcalfe NB. Variation in the link between oxygen consumption and ATP production, and its relevance for animal performance. Proc Biol Sci. 2015; 282:20151028. https://doi.org/10.1098/rspb.2015.1028 [PubMed]
- 57. Charnov EL. (1993). Life history invariants: some explorations of symmetry in evolutionary ecology. (U.S.A.: Oxford University Press).
- 58. Hamilton MJ, Davidson AD, Sibly RM, Brown JH. Universal scaling of production rates across mammalian lineages. Proc Biol Sci. 2011; 278:560–66. https://doi.org/10.1098/rspb.2010.1056 [PubMed]
- 59. Fleming JM, Creevy KE, Promislow DE. Mortality in north american dogs from 1984 to 2004: an investigation into age-, size-, and breed-related causes of death. J Vet Intern Med. 2011; 25:187–98. https://doi.org/10.1111/j.1939-1676.2011.0695.x [PubMed]
- 60. Kirkwood TB. (1990). The disposable soma theory of aging. In: Harrison DE, ed. Genetic effects on aging II. (Caldwell, NJ: Telford Press), pp. 9-19.
- 61. Kirkwood TB, Austad SN. Why do we age? Nature. 2000; 408:233–38. https://doi.org/10.1038/35041682 [PubMed]
- 62. Kearney MR, White CR. Testing metabolic theories. Am Nat. 2012; 180:546–65. https://doi.org/10.1086/667860 [PubMed]
- 63. van der Meer J. Metabolic theories in ecology. Trends Ecol Evol. 2006; 21:136–40. https://doi.org/10.1016/j.tree.2005.11.004 [PubMed]
- 64. Hammond KA, Diamond J. Maximal sustained energy budgets in humans and animals. Nature. 1997; 386:457–62. https://doi.org/10.1038/386457a0 [PubMed]
- 65. Charnov EL. Evolution of life history variation among female mammals. Proc Natl Acad Sci USA. 1991; 88:1134–37. https://doi.org/10.1073/pnas.88.4.1134 [PubMed]