


Introduction
Cerebral small vessel disease (cSVD) is common, comprises 20% of ischemic stroke [1,2] and contributes to 45% of dementias, but there is no effective treatment [3]. Neuroradiological features visible on structural magnetic resonance imaging (MRI) include white matter hyperintensities (WMH), lacunar infarcts, enlarged perivascular spaces, microbleeds and cerebral atrophy [3,4]. Several demographic and clinical factors are associated with increased risk of cSVD, including hypertension [5] diabetes, hypercholesterolemia [6], obesity [7], smoking [8], dietary salt [9] and alcohol intake, but a large proportion of the variance in presence and severity of cSVD is unexplained [10]. Other potential risk factors for cSVD are not well characterized.
It is plausible that early-life factors may influence the development and impact of cSVD. Variables including high childhood IQ, educational attainment and higher childhood socioeconomic status have been associated with greater white matter structural integrity on MRI in older age [11]. These same early-life factors have also predicted lower incidence of conditions linked with cSVD in some studies, including cardiovascular disease, stroke, and dementia [12–15]. cSVD burden may therefore provide mechanistic links between early-life factors and late-life stroke and dementia incidence.
The SVD score is a 4-point scale developed to summarize total brain burden of cSVD. One point is given for the presence of each of moderate-severe WMH, one or more microbleeds, one or more lacunar infarcts, and moderate to severe burden of enlarged perivascular spaces [16]. The score shows specificity for small vessel infarcts over other stroke mechanisms [17], correlates with ambulatory blood pressure [16] and cognitive impairment [4,18]. In the Lothian Birth Cohort 1936 (LBC1936), all four individual components of the SVD score have been found to load significantly on a “small vessel disease” latent variable.
Using the SVD score, we examined the relations between total brain burden of cSVD at age 73 years and early life factors in the LBC 1936, a longitudinal study of aging.
Results
Mean age of all participants at the time of MRI scan was 72.7 years (SD .7 years). Forty-seven percent were female. Mean age-11 IQ was 100.8 (SD 15.3), and 82% (81% male, 84% female) participants went on to obtain some form of qualifying education (O-level [completion at age 16], A-level [completion at age 18], semi-professional/ professional training or a higher degree).
Table 1. Characteristics of participants by SVD score
| SVD score | |||||
| 0 | 1 | 2 | 3 | 4 | |
| Overall, n(%) | 302 (44.4) | 249 (36.6) | 98 (14.4) | 27 (4.0) | 4 (.6) |
| Age, mean, SD | 72.50 (.75) | 72.52 (.69) | 72.63 (.61) | 72.91 (.56) | 72.79 (.68) |
| Female, n(%) | 148 (49.0) | 101 (40.6) | 57 (58.2) | 15 (55.6) | 0 (0.0) |
| Age at leaving full-time education, y, mean (SD) | 15.80 (1.14) | 13.88 (1.14) | 11.59 (1.00) | 16.00 (1.39) | 15.75 (1.50) |
| Number of years of full-time education, y, mean, SD | 10.81 (1.15) | 10.88 (1.14) | 10.59 (1.00) | 11.00 (1.39) | 10.75 (1.50) |
| Education, highest qualification, n(%) No qualification O-level/equivalent A-level/equivalent Semiprofessional/professional Degree | 49 (16.2) 115 (38.1) 56 (18.5) 33 (10.9) 49 (16.2) | 37 (15.0) 89 (36.0) 41 (16.6) 37 (15.0) 43 (17.4) | 20 (20.4) 43 (43.9) 9 (9.2) 12 (12.2) 14 (14.3) | 8 (29.6) 10 (37.0) 4 (14.8) 1 (3.7) 4 (14.8) | 2 (50.0) 1 (25.0) 1 (25.0) 0 (0.0) 0 (0.0) |
| Education, dichotomized No qualification O-level or higher | 49 (16.2) 253 (83.8) | 37 (15.0) 210 (85.0) | 20 (20.4) 78 (79.6) | 8 (29.6) 19 (70.4) | 2 (50.0) 2 (50.0) |
| Own job class, n(%) I II IIIN IIIM IV V | 64 (21.2) 121 (40.1) 62 (20.5) 37 (12.3) 16 (5.3) 2 (.7) | 51 (20.5) 99 (39.8) 50 (20.1) 42 (16.9) 6 (2.4) 1 (.4) | 11 (11.2) 37 (37.8) 24 (24.5) 24 (24.5) 1 (1.0) 1 (1.0) | 11 (40.7) 4 (14.8) 5 (18.5) 6 (22.2) 1 (3.7) 0 (0) | 0 (0) 1 (25.0) 1 (25.0) 2 (50.0) 0 (0.0) 0 (0.0) |
| Dichotomized own job class, n(%) I-II III-V | 185 (61.3) 117 (38.7) | 150 (60.2) 99 (39.8) | 48 (49.0) 50 (51.0) | 15 (55.6) 12 (44.4) | 1 (25.0) 3 (75.0) |
| Age-11 IQ, mean (SD) | 100.75 (14.28) | 102.45 (14.27) | 97.96 (18.21) | 98.99 (14.11) | 90.96 (8.46) |
| Age-11 deprivation index, mean (SD) | -.116 (2.39) | -.217 (2.07) | .453 (2.64) | -.228 (2.31) | -0.576 (1.39) |
| Father’s job class, age-11, n(%) I II III IV V | 20 (6.6) 51 (16.9) 180 (59.6) 32 (10.6) 19 (6.3) | 17 (6.8) 52 (20.9) 138 (55.4) 23 (9.2) 19 (7.6)) | 2 (2.0) 13 (13.3) 68 (69.4) 11 (11.2) 4 (4.1) | 1 (3.7) 4 (14.8) 19 (70.4) 3 (11.1) 0 (0) | 0 (0) 2 (50.0) 2 (50.0) 0 (0) 0 (0) |
| Dichotomized father’s job class, age-11, n(%) I-II III-V | 71 (23.5) 231 (76.5) | 69 (27.7) 180 (72.3) | 15 (15.3) 83 (84.7) | 5 (18.5) 22 (81.5) | 2 (50.0) 2 (50.0) |
Table 2 shows results of the multivariate logistic regressions. In all multivariate models, greater SVD score was significantly associated with lower age-11 IQ (Model 3, OR for higher SVD score per SD greater age-11 IQ = .78, 95% CI .65 - .95, p = .01). In the crude ordinal regression analysis (Supplementary Table e-2), each additional point on the SVD score was associated with a non-significant 6% decrease (95% CI -8 - 18%, p=.36) in standardized age-11 IQ. The associations between SVD score and own job class (Model 3, OR for higher versus lower class, .64, 95% CI .43 – .95, p=.03), age-11 deprivation index (Model 3, OR per point greater deprivation score, 1.08, 95% CI 1.00 - 1.17, p=.04), and level of education (Model 3 OR for O-level or some qualifying education versus not, .60 95% CI .37 - .98, p=.04) all showed trends towards significance (p<.05 for all) but did not meet the p=.01 threshold for multiple testing. None of the early-life factors was significantly associated with any of the individual SVD score components (Table 2).
Table 2. Early life factor associations with dichotomized SVD score and components, multivariate logistic regression
| Presence of moderate to severe cSVD | |||||||||||||||||||||||||||||||||||||||||||||||||||||||||||||||||||||||||||||||||||||||||||||||||||
| Model 1 | p | Model 2 | p | Model 3 | p | ||||||||||||||||||||||||||||||||||||||||||||||||||||||||||||||||||||||||||||||||||||||||||||||
| Sex | .67 (.46 - .99) | .04 | .68 (.46 - .98) | .05 | .68 (.46 - 1.01) | .06 | |||||||||||||||||||||||||||||||||||||||||||||||||||||||||||||||||||||||||||||||||||||||||||||
| Age-11 IQ | .78 (.65-.94) | .01 | .78 (.65 - .94) | .01 | .78 (.65 - .95) | .01 | |||||||||||||||||||||||||||||||||||||||||||||||||||||||||||||||||||||||||||||||||||||||||||||
| Age-11 deprivation index | 1.08 (1.00 – 1.17) | .04 | 1.08 (1.00 – 1.17) | .05 | 1.08 (1.00 – 1.17) | .04 | |||||||||||||||||||||||||||||||||||||||||||||||||||||||||||||||||||||||||||||||||||||||||||||
| Dichot. level of education, O-level or higher versus none | .58 (.36 - .94) | .03 | .59 (.37 - .95) | .03 | .60 (.37 - .98) | .04 | |||||||||||||||||||||||||||||||||||||||||||||||||||||||||||||||||||||||||||||||||||||||||||||
| Dichot. own job class I – II vs. III-V | .61 (.41 - .91) | .01 | .61 (.41 - .91) | .01 | .64 (.43 - .95) | .03 | |||||||||||||||||||||||||||||||||||||||||||||||||||||||||||||||||||||||||||||||||||||||||||||
| Dichot. father’s job class, I – II vs. III-V | .62 (.38 – 1.02) | .06 | .62 (.37-1.02) | .06 | .63 (.38-1.04) | .07 | |||||||||||||||||||||||||||||||||||||||||||||||||||||||||||||||||||||||||||||||||||||||||||||
| Presence of moderate to severe WMH | |||||||||||||||||||||||||||||||||||||||||||||||||||||||||||||||||||||||||||||||||||||||||||||||||||
| Model 1 | p | Model 2 | p | Model 3 | p | ||||||||||||||||||||||||||||||||||||||||||||||||||||||||||||||||||||||||||||||||||||||||||||||
| Age-11 IQ | .84 (.70 – .99) | .04 | .83 (.70 - .99) | .04 | .84 (.70-1.00) | .05 | |||||||||||||||||||||||||||||||||||||||||||||||||||||||||||||||||||||||||||||||||||||||||||||
| Age-11 deprivation index | 1.03 (0.95 – 1.11) | .49 | 1.03 (.95-1.11) | .48 | 1.02 (.95 – 1.11) | .56 | |||||||||||||||||||||||||||||||||||||||||||||||||||||||||||||||||||||||||||||||||||||||||||||
| Dichotomized level of education, O-level or higher versus none | .83 (.52 – 1.33) | .44 | .86 (.42 - .88) | .52 | .86 (.53 – 1.39) | .54 | |||||||||||||||||||||||||||||||||||||||||||||||||||||||||||||||||||||||||||||||||||||||||||||
| Dichotomized own job class I – II vs. III - V | .66 (.46-.95) | .02 | .66 (.45 - .95) | .03 | .71 (.49 – 1.04) | .08 | |||||||||||||||||||||||||||||||||||||||||||||||||||||||||||||||||||||||||||||||||||||||||||||
| Dichot father’s job class, I – II vs. III - V | .71 (.45 – 1.11) | .14 | .71 (.45 – 1.11_ | .13 | .73 (.46 – 1.16) | .18 | |||||||||||||||||||||||||||||||||||||||||||||||||||||||||||||||||||||||||||||||||||||||||||||
| Presence of microbleeds | |||||||||||||||||||||||||||||||||||||||||||||||||||||||||||||||||||||||||||||||||||||||||||||||||||
| Model 1 | p | Model 2 | p | Model 3 | p | ||||||||||||||||||||||||||||||||||||||||||||||||||||||||||||||||||||||||||||||||||||||||||||||
| Age-11 IQ | .93 (0.74 – 1.16) | .50 | .93 (.74 – 1.16) | .50 | .91 (.72 – 1.14) | .40 | |||||||||||||||||||||||||||||||||||||||||||||||||||||||||||||||||||||||||||||||||||||||||||||
| Age-11 deprivation index | 1.03 (0.93 – 1.13) | .57 | 1.03 (.93-1.13) | .57 | 1.04 (.94 – 1.15) | .42 | |||||||||||||||||||||||||||||||||||||||||||||||||||||||||||||||||||||||||||||||||||||||||||||
| Dichotomized level of education, O-level or higher versus none | .55 (.32 - .95) | .03 | .55 (.32 - .96) | .03 | .57 (.32 - .99) | .05 | |||||||||||||||||||||||||||||||||||||||||||||||||||||||||||||||||||||||||||||||||||||||||||||
| Dichotomized own job class I – II vs. III - V | .72 (.45 – 1.15) | .17 | .72 (.45 – 1.15) | .17 | .70 (.43 – 1.13) | .70 | |||||||||||||||||||||||||||||||||||||||||||||||||||||||||||||||||||||||||||||||||||||||||||||
| Dichotomized father’s job class, III - V vs. I - II | .80 (.45 – 1.43) | .46 | .80 (.45 – 1.43) | .45 | .79 (.44 – 1.42) | .43 | |||||||||||||||||||||||||||||||||||||||||||||||||||||||||||||||||||||||||||||||||||||||||||||
| Presence of lacunes | |||||||||||||||||||||||||||||||||||||||||||||||||||||||||||||||||||||||||||||||||||||||||||||||||||
| Model 1 | p | Model 2 | p | Model 3 | p | ||||||||||||||||||||||||||||||||||||||||||||||||||||||||||||||||||||||||||||||||||||||||||||||
| Age-11 IQ | .80 (.59 – 1.10) | .18 | .80 (.58 – 1.10) | .17 | .82 (.59 – 1.13) | .22 | |||||||||||||||||||||||||||||||||||||||||||||||||||||||||||||||||||||||||||||||||||||||||||||
| Age-11 deprivation index | .96 (.81 – 1.13) | .61 | .96 (.81-1.13) | .62 | .95 (.81 – 1.13) | .57 | |||||||||||||||||||||||||||||||||||||||||||||||||||||||||||||||||||||||||||||||||||||||||||||
| Dichotomized level of education, O-level or higher versus none | .78 (.33- 1.86) | .58 | .81 (.34 – 1.94) | .64 | .86 (.35 - 2.08) | .73 | |||||||||||||||||||||||||||||||||||||||||||||||||||||||||||||||||||||||||||||||||||||||||||||
| Dichotomized own job class I – II vs. III - V | .75 (.37 – 1.52) | .43 | .76 (.37 – 1.53) | .44 | .74 (.36 – 1.52) | .41 | |||||||||||||||||||||||||||||||||||||||||||||||||||||||||||||||||||||||||||||||||||||||||||||
| Dichotomized father’s job class, I – II vs. III - V | 1.67 (.79 – 3.52) | .18 | 1.66 (.79 – 3.52) | .19 | 1.71 (.80 – 3.65) | .17 | |||||||||||||||||||||||||||||||||||||||||||||||||||||||||||||||||||||||||||||||||||||||||||||
| Presence of moderate to severe EPVS | |||||||||||||||||||||||||||||||||||||||||||||||||||||||||||||||||||||||||||||||||||||||||||||||||||
| Model 1 | p | Model 2 | p | Model 3 | p | ||||||||||||||||||||||||||||||||||||||||||||||||||||||||||||||||||||||||||||||||||||||||||||||
| Age-11 IQ | 1.04 (.89-1.21) | .63 | 1.04 (.89 – 1.21) | .63 | 1.04 (.89 – 1.21) | .63 | |||||||||||||||||||||||||||||||||||||||||||||||||||||||||||||||||||||||||||||||||||||||||||||
| Age-11 deprivation index | 1.03 (.96 – 1.10) | .39 | 1.03 (.96-1.10) | .38 | 1.03 (.96 – 1.10) | .42 | |||||||||||||||||||||||||||||||||||||||||||||||||||||||||||||||||||||||||||||||||||||||||||||
| Dichotomized level of education, O-level or higher versus none | .83 (.55 – 1.25) | .37 | .84 (.56 – 1.27) | .41 | .84 (.56 – 1.27) | .41 | |||||||||||||||||||||||||||||||||||||||||||||||||||||||||||||||||||||||||||||||||||||||||||||
| Dichotomized own job class I – II vs. III - V | .95 (.69 – 1.29) | .72 | .95 (.69 – 1.29) | .73 | .98 (.71 – 1.36) | .92 | |||||||||||||||||||||||||||||||||||||||||||||||||||||||||||||||||||||||||||||||||||||||||||||
| Dichotomized father’s job class, I – II vs. III - V | 1.01 (.70 – 1.45) | .97 | 1.01 (.70 – 1.45) | .97 | 1.02 (.71-1.47) | .90 | |||||||||||||||||||||||||||||||||||||||||||||||||||||||||||||||||||||||||||||||||||||||||||||
| Model 1: +Age and sex | |||||||||||||||||||||||||||||||||||||||||||||||||||||||||||||||||||||||||||||||||||||||||||||||||||
| Model 2: Model 1 + HTN | |||||||||||||||||||||||||||||||||||||||||||||||||||||||||||||||||||||||||||||||||||||||||||||||||||
| Model 3: Model 2 + Dyslipidemia + Smoking + Diabetes | |||||||||||||||||||||||||||||||||||||||||||||||||||||||||||||||||||||||||||||||||||||||||||||||||||
Discussion
In this large sample of generally healthy community-dwelling older members recruited from a single year-of-birth cohort, the total brain burden of cSVD at age 73 was associated with lower age-11 IQ, and showed theory-consistent trends towards association with age-11 deprivation index, own job class and highest qualifying education level. The SVD score was significantly associated with these early-life factors more consistently than any one individual MRI feature of cSVD. This is consistent with interpretation of SVD score as a latent construct. That is, it suggests that some underlying causal factor may influence development of each of these features of cSVD. If so, future research should seek to identify this causal factor.
Though conventional vascular risk factors, particularly hypertension and smoking, are associated with presence and burden of cSVD, we have previously found that these risk factors accounted for no more than 2% of variance of WMH, whereas their contributions to other forms of vascular disease, including coronary, carotid and peripheral large artery atheromatous disease, were much greater, explaining 70% of variance in the LBC1936 and related cohorts [10]. Our findings suggest that the effects of early-life deprivation and childhood IQ on overall health extends to burden of cSVD in later life, though their overall contributions to variance of cSVD is likely small (pseudo R2 = .03 and .01, respectively).
Relations between social characteristics and health are consistently observed, although there is less information on associations with cSVD than with other common disorders. The first reported association between socioeconomic status and overall health, in the landmark Whitehall study, was a strong association between employment class in the British Civil Service and age-adjusted mortality [32]. Evidence from subsequent cohorts has shown further associations between occupation class and cardiovascular disease and other chronic illnesses as well as age-adjusted mortality [33–36]. The roles of early-life socio-economic factors, including level of education, in establishing good health are also established [37]. Deprivation, both in utero [38] and in childhood [39,40] is also associated with increased prevalence of cardiovascular and other chronic diseases and increased mortality.
The relations between social variables and brain health, however, are less well described. In the Aberdeen Birth Cohort 1936, WMH volumes were higher with “blue collar” than “white collar” paternal occupation grade [41]. Educational attainment is associated with lower prevalence of dementia [42], and has been shown in several cohorts to moderate the association between WMH and clinical expression of brain disease: patients with higher levels of education had better mean-level cognitive performance than less-educated patients with equally severe WMH on MRI [43,44]. Educational attainment also had a dose-response association with cognitive impairment regardless of neuropathological features including neurofibrillary tangles, small vessel disease, and Lewy bodies [45]. However, few studies have explored or found direct associations between educational attainment and burden of cSVD [44] and we did not find a significant association that passed multiple testing thresholds between education and SVD score in this cohort.
Educational attainment, however, is closely linked with childhood IQ [46]. There is evidence that genetic and environmental influences on educational attainment can vary with IQ, with greater shared environmental influences on educational attainment at lower than higher IQs, but greater genetic influences on educational attainment at higher than lower IQs [47].
Having a higher IQ may be associated with interests and enjoyment of school that leads to seeking of further education, which in turn may lead to better employment opportunities and access to other social benefits associated with improved health. Family resources (which tend to vary with parental IQ) may be more likely to be funneled toward education when offspring show the academic potential that genetically-influenced IQ tends to reflect [37]. Childhood IQ has also been associated with burden of WMH and cortical thickness in older age [48,49], and the association we have found between age-11 IQ and burden of SVD may also reflect better white matter structural integrity in those with higher age-11 IQ. This was previously observed in this cohort using fractional anisotropy derived from diffusion tensor MRI [11].
The precise mechanisms by which early socioeconomic factors and childhood intelligence may influence brain integrity in older age is unknown. While statistical adjustment for conventional vascular risk factors partially accounts for the effects of general health on brain health, there are other known and unknown variables that may further account for this association. Multiple studies have reported epigenetic associations for multiple socioeconomic factors [50–52], poorer quality diet, aspects of environment that influence opportunities for and appeal of physical activity [53] and exposure to pollution and other toxins [54]. Socioeconomic status and childhood intelligence may also contribute to lifestyle choices impacting brain vascular health [55] – intelligence and greater educational attainment were associated with health-promoting behaviours [56] and earlier adoption of health-related recommendations [57] - and exposure or tolerance to allostatic load [58].
Though females had higher mean burden of cSVD than males, this finding is not consistent across cohorts [17,59,60]. In this study, the difference in burden of disease was not explained by younger school-leaving age in females, nor by differential mean burden of other early-life factors or vascular risk factors. (Supplementary Tables e-4, e-5). There may be additional unidentified causes underlying this sex-dependent difference in cSVD burden in this sample, and sex difference may vary across samples. Alternatively, the findings could be statistical artifacts.
Strengths of our study were its sample size, availability of early-life data on older-age participants, absence of potential confounding effects of heterogeneous age of participants, and focus on one geographical region, which limited confounding effects due to local variations in socioeconomic strata. The latter two also limited potential to generalize beyond this group. Moreover, our analysis was limited by a concentration of lower SVD scores in our cohort, which likely reflected the good general health of this community-based, relatively young [30] and healthy aging cohort of voluntary participants; fuller associations between more severe cSVD and early-life factors may not have been completely characterized. The retrospective ascertainment of age-11 socioeconomic variables at age 70 may be subject to recall bias and error. We adjusted our significance threshold for multiple testing, though the possibility of Type I error remains. Our cohort’s early childhood occurred during the Second World War, which could have impacted the development of cognitive ability or performance on cognitive ability tests as well as later-life health. However, the mean score on the Moray House Test No. 12 was higher in the population born in 1936 (Scottish Mental Survey 1947) than in the population born in 1921 (Scottish Mental Survey 1932) [61]. Further, relations between childhood IQ and adult intelligence have been reported in other cohorts and are likely generalizable. In another Lothian Birth Cohort born in 1921, intelligence at age 11 predicted intelligence at age 79, 87, and 90 [62,63]; in the 1921 Aberdeen Birth Cohort, childhood intelligence also was associated with intelligence at age 78 – 81 [64], with correlations very consistent with those observed here. Heritability of intelligence in both the 1921 and 1936 cohorts is also similar at age 11, which would not be expected if there were adverse environmental influences on one of the cohorts [65].
Methods
Participants
The LBC1936 has been previously described in detail [19]. Briefly, participants were born in 1936 and most completed the Moray House Test No. 12 intelligence test at age 11 as part of the 1947 Scottish Mental Survey, which tested 70805 out of a possible 75211 children from the total Scottish population born in 1936 [19]. Those living in the Lothian region of Scotland, mainly Edinburgh city, were recruited into a longitudinal study of aging at a mean age of 70 years, and 1091 consented to participate. From the original Wave 1 participants (mean age=69.5, SD = 0.8), 866 participants returned three years later for Wave 2 (mean age = 72.5, SD = 0.7), 700 of whom provided some usable brain MRI sequences and cognitive testing [20]. Twenty participants were removed for missing sequences. Primary reasons for attrition between Waves 1 and 2 were death, chronic incapacity, and permanent withdrawal [21]. Characteristics of Wave 2 participants with and without complete MRI data are summarized in Supplementary Table e-1. All participants provided written informed consent. The study was approved by Multi-Centre Research Ethics Committee for Scotland (MREC/01/0/56) and Lothian Research Ethics Committee (LREC/2003/2/29).
Data
Data acquisition was described in detail previously [22]. Demographic details, sociodemographic background, educational history, and self-reported medical history were obtained by standardized interview between autumn 2007 and spring 2010.
Age-11 IQ scores were calculated from the Moray House Test No.12, which was administered on June 4, 1947, to almost all children attending school in Scotland who were born in 1936. Its correlation with the Stanford-Binet IQ score is ≈.80 [23]. Raw scores were adjusted for age in days at time of testing and placed on an IQ-type scale with a mean of 100 (SD=15) [22,23]. Participants reported age at leaving school and educational attainment (none, O-level, complete at age 16; A-level, complete at age 18; semi-professional or professional, or degree), as well as their fathers’ numbers of years of full-time education. We calculated each person’s number of years of full-time education.
Participants reported their own and their fathers’ principal occupations prior to retirement; married women also reported those of their spouses. Social class for fathers was ascertained using the General Register Office’s Census, 1951 Classification of Occupations (coinciding approximately with the middles of the fathers’ career). Social class was ascertained for participants using the Office of Population Censuses and Surveys’ Classification of Occupations, 1980 (coinciding approximately with participants’ mid-career). Both are scales from I-V, from professional to unskilled labor. For married women, the husband’s social class was used if it was higher. Participants reported information on their childhood homes, including the numbers of people living in their home, numbers of rooms and toilets, numbers of people sharing toilets and whether the toilets were indoor or outdoor. Number of people per room was calculated and standardized; the other two variables were standardized separately, and a composite measure of age-11 deprivation was formed by summing these standardized variables [22].
Neuroimaging and interpretation
Brain imaging acquisition for LBC1936 has been described previously in detail [24]. All subjects were scanned on the same 1.5T GE Signa HDx scanner operating in research mode. The SVD score components were ascertained from axial T2, T2*, fluid-attenuated inversion recovery (FLAIR) and T1-weighted sequences.
Images were rated by a certified and registered neuroradiologist (ZM) blinded to clinical information. Presence of lacunes, WMH, microbleeds and perivascular spaces were rated according to established protocol, published previously, using validated visual scales [24–26]. A second experienced certified and registered neuroradiologist (JMW) re-rated 20% of scans selected at random and consensus was made on disagreements. Intraclass correlation coefficient for WMH was 0.96 [27], and intra- and inter-rater kappa statistics for perivascular spaces were 0.8-0.9 [27]..Inter-rater kappa for microbleeds in a separate cohort was 0.68 [25]. The lower inter-rater agreement for microbleeds likely reflects the greater location choices of the BOMBS rating scale, not the presence versus absence of microbleeds for which the observer agreement was high.
Rating scales for the variables above were converted to dichotomous point scores and summed to create the SVD score [4,16–18].
Statistical analysis
First, descriptive characteristics were calculated using means and standard deviations (SD) or counts and percentages as appropriate (Table 1). As there were small amounts of missing data for many of the variables that would have reduced the sample size with listwise deletion, their status was tested using Little’s MCAR test to assess for completely random missingness. We used expectation maximization estimates to impute missing values [29]. Neither own job class nor fathers’ job class met criteria for complete missingness. We considered it likely they met criteria for missingness at random, however, and imputed them as well, rounding to the nearest integer or, in the case of own job class, half-integer as appropriate. Five missing values were imputed for own social class and 20 for fathers’ job class, all of which had a central tendency. To compare associations with more- and less-deprived states, we also examined dichotomized scores for participant’s job class, father’s job class (both into unskilled [IV, V] and skilled [I, II, IIIN, IIIM]) and highest educational attainment (did not finish primary education and O-level or higher). With the exception of own job class, which was negatively skewed with only 4.6% of participants with classes of IV or V, these variables were approximately normally distributed.
Few in the cohort had high SVD scores (0.6% had an SVD score of 4, 4% a score of 3, 14% a score of 2, 37% a score of 1 and 44% a score of 0; Figure 1), which likely reflected the generally good health and relatively young age of this community-dwelling healthy aging cohort [22]. Given the skewed distribution of SVD scores in the cohort, we explored the relations between early life factors and the SVD scores using logistic regression with a dichotomized SVD score: SVD 0-1 (“no or mild disease”) and SVD 2-4 (“moderate-severe disease”).
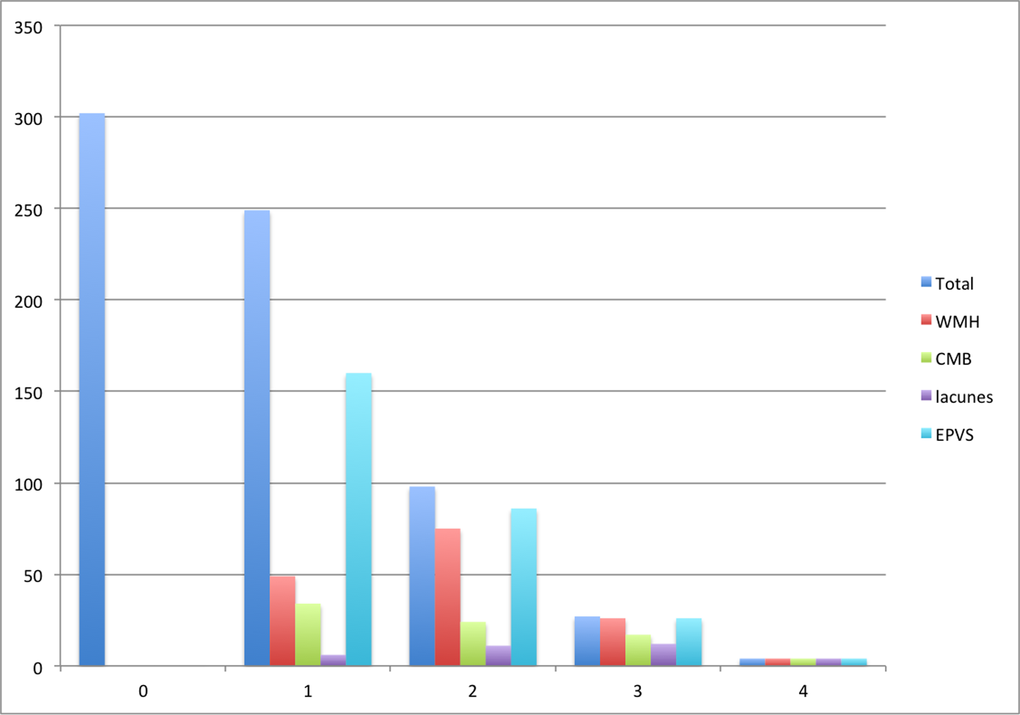
Figure 1. Number of participants with each SVD score and score component
We performed univariate logistic regression for differences in early-life factors for higher and lower SVD scores and for presence of each individual component; we then included factors with p < .10 in multivariate logistic regression. We used three multivariate models, first adjusting age and sex, then adding hypertension, then other vascular risk factors (history of dyslipidemia, diabetes and smoking status). The covariates in the models were chosen as all are known to account at least to some degree independently for variance in burden of cSVD on MRI, both in this cohort and in others [10,17,30,31]. To offset effects of multiple testing, we considered effects to be significant at p values of .01. Analyses were performed using SPSS 23.0 (Armonk, NY).
Conclusions
We observed that age-11 IQ was associated with greater burden of cSVD on MRI in later life, and that age-11 deprivation index and low social class showed similar trends. This might help explain the known association between such factors and risk of stroke and dementia. The relations between early life factors were more strongly associated with total brain burden of SVD than any one neuroradiological component of WMH, cerebral microbleeds, lacunes or enlarged perivascular spaces.
Our findings suggest that childhood intelligence may be a “risk factor” for cSVD in later life. This observation, as well as the relations between other early-life factors and burden of cSVD, deserves further study.
Supplementary Materials
Author Contributions
TSF, FNB, WJ, JMW and IJD contributed towards study design, analysis and interpretation of the data and and drafting and revising the manuscript for intellectual content. EB, CM, SC, JC, AP, AJG, SS, VC, ZM, JS, MB were involved in acquisition, analysis and interpretation of the data.
Acknowledgements
We thank study data manager Paul Redmond.
Funding
The LBC1936 data were collected by a Research Into Ageing program grant; this research continues as part of the Age UK-funded (formerly Help the Aged) Disconnected Mind project. The neuroimaging including analysis was performed at the Brain Research Imaging Centre, Edinburgh, part of the SINAPSE collaboration (www.sinapse.ac.uk). TSF was supported by a Vancouver Coastal Health Research Institute Mentored Clinician Scientist Award. VC was supported by NHS Research Scotland Fellowship. JS was supported by the MUMC Academic Fund. The LBC1936 study is conducted within CCACE, part of the cross council Lifelong Health and Wellbeing Initiative (G0700704/84698). Funding from the BBSRC, EPSRC, ESRC and MRC is gratefully acknowledged. The LBC1936 website is http://www.lothianbirthcohort.ed.ac.uk.
Conflicts of Interest
The authors declare ni conflicts of interest.
References
- 1. Kolominsky-Rabas PL, Weber M, Gefeller O, Neundoerfer B, Heuschmann PU. Epidemiology of ischemic stroke subtypes according to TOAST criteria: incidence, recurrence, and long-term survival in ischemic stroke subtypes: a population-based study. Stroke. 2001; 32:2735–40. https://doi.org/10.1161/hs1201.100209 [PubMed]
- 2. Sudlow CL, Warlow CP, and International Stroke Incidence Collaboration. Comparable studies of the incidence of stroke and its pathological types: results from an international collaboration. Stroke. 1997; 28:491–99. https://doi.org/10.1161/01.STR.28.3.491 [PubMed]
- 3. Gorelick PB, Scuteri A, Black SE, Decarli C, Greenberg SM, Iadecola C, Launer LJ, Laurent S, Lopez OL, Nyenhuis D, Petersen RC, Schneider JA, Tzourio C, et al, and American Heart Association Stroke Council, Council on Epidemiology and Prevention, Council on Cardiovascular Nursing, Council on Cardiovascular Radiology and Intervention, and Council on Cardiovascular Surgery and Anesthesia. Vascular contributions to cognitive impairment and dementia: a statement for healthcare professionals from the american heart association/american stroke association. Stroke. 2011; 42:2672–713. https://doi.org/10.1161/STR.0b013e3182299496 [PubMed]
- 4. Staals J, Booth T, Morris Z, Bastin ME, Gow AJ, Corley J, Redmond P, Starr JM, Deary IJ, Wardlaw JM. Total MRI load of cerebral small vessel disease and cognitive ability in older people. Neurobiol Aging. 2015; 36:2806–11. https://doi.org/10.1016/j.neurobiolaging.2015.06.024 [PubMed]
- 5. Schmidt R, Fazekas F, Kapeller P, Schmidt H, Hartung HP. MRI white matter hyperintensities: three-year follow-up of the Austrian Stroke Prevention Study. Neurology. 1999; 53:132–39. https://doi.org/10.1212/WNL.53.1.132 [PubMed]
- 6. Williams VJ, Leritz EC, Shepel J, McGlinchey RE, Milberg WP, Rudolph JL, Lipsitz LA, Salat DH. Interindividual variation in serum cholesterol is associated with regional white matter tissue integrity in older adults. Hum Brain Mapp. 2013; 34:1826–41. https://doi.org/10.1002/hbm.22030 [PubMed]
- 7. Gustafson DR, Steen B, Skoog I. Body mass index and white matter lesions in elderly women. An 18-year longitudinal study. Int Psychogeriatr. 2004; 16:327–36. https://doi.org/10.1017/S1041610204000353 [PubMed]
- 8. Gons RA, van Norden AG, de Laat KF, van Oudheusden LJ, van Uden IW, Zwiers MP, Norris DG, de Leeuw FE. Cigarette smoking is associated with reduced microstructural integrity of cerebral white matter. Brain. 2011; 134:2116–24. https://doi.org/10.1093/brain/awr145 [PubMed]
- 9. Heye AK, Thrippleton MJ, Chappell FM, Valdés Hernández MC, Armitage PA, Makin SD, Maniega SM, Sakka E, Flatman PW, Dennis MS, Wardlaw JM. Valdes Hernandez MdC, Armitage PA, Makin SD, Maniega SM, Sakka E, Flatman PW, Dennis MS and Wardlaw JM. Blood pressure and sodium: association with MRI markers in cerebral small vessel disease. J Cereb Blood Flow Metab. 2015. https://doi.org/10.1038/jcbfm.2015.64
- 10. Wardlaw JM, Allerhand M, Doubal FN, Valdes Hernandez M, Morris Z, Gow AJ, Bastin M, Starr JM, Dennis MS, Deary IJ. Vascular risk factors, large-artery atheroma, and brain white matter hyperintensities. Neurology. 2014; 82:1331–38. https://doi.org/10.1212/WNL.0000000000000312 [PubMed]
- 11. Deary IJ, Bastin ME, Pattie A, Clayden JD, Whalley LJ, Starr JM, Wardlaw JM. White matter integrity and cognition in childhood and old age. Neurology. 2006; 66:505–12. https://doi.org/10.1212/01.wnl.0000199954.81900.e2 [PubMed]
- 12. Glymour MM, Tzourio C, Dufouil C. Is cognitive aging predicted by one’s own or one’s parents’ educational level? results from the three-city study. Am J Epidemiol. 2012; 175:750–59. https://doi.org/10.1093/aje/kwr509 [PubMed]
- 13. Lawlor DA, Batty GD, Clark H, McIntyre S, Leon DA. Association of childhood intelligence with risk of coronary heart disease and stroke: findings from the Aberdeen Children of the 1950s cohort study. Eur J Epidemiol. 2008; 23:695–706. https://doi.org/10.1007/s10654-008-9281-z [PubMed]
- 14. Modig Wennerstad K, Silventoinen K, Tynelius P, Bergman L, Rasmussen F. Association between intelligence and type-specific stroke: a population-based cohort study of early fatal and non-fatal stroke in one million Swedish men. J Epidemiol Community Health. 2010; 64:908–12. https://doi.org/10.1136/jech.2008.084020 [PubMed]
- 15. McGurn B, Deary IJ, Starr JM. Childhood cognitive ability and risk of late-onset Alzheimer and vascular dementia. Neurology. 2008; 71:1051–56. https://doi.org/10.1212/01.wnl.0000319692.20283.10 [PubMed]
- 16. Klarenbeek P, van Oostenbrugge RJ, Rouhl RP, Knottnerus IL, Staals J. Ambulatory blood pressure in patients with lacunar stroke: association with total MRI burden of cerebral small vessel disease. Stroke. 2013; 44:2995–99. https://doi.org/10.1161/STROKEAHA.113.002545 [PubMed]
- 17. Staals J, Makin SD, Doubal FN, Dennis MS, Wardlaw JM. Stroke subtype, vascular risk factors, and total MRI brain small-vessel disease burden. Neurology. 2014; 83:1228–34. https://doi.org/10.1212/WNL.0000000000000837 [PubMed]
- 18. Huijts M, Duits A, van Oostenbrugge RJ, Kroon AA, de Leeuw PW, Staals J. Accumulation of MRI Markers of Cerebral Small Vessel Disease is Associated with Decreased Cognitive Function. A Study in First-Ever Lacunar Stroke and Hypertensive Patients. Front Aging Neurosci. 2013; 5:72. https://doi.org/10.3389/fnagi.2013.00072 [PubMed]
- 19. Deary IJ, Gow AJ, Taylor MD, Corley J, Brett C, Wilson V, Campbell H, Whalley LJ, Visscher PM, Porteous DJ, Starr JM. The Lothian Birth Cohort 1936: a study to examine influences on cognitive ageing from age 11 to age 70 and beyond. BMC Geriatr. 2007; 7:28. https://doi.org/10.1186/1471-2318-7-28 [PubMed]
- 20. Booth T, Bastin ME, Penke L, Maniega SM, Murray C, Royle NA, Gow AJ, Corley J, Henderson RD, Hernández MC, Starr JM, Wardlaw JM, Deary IJ. Brain white matter tract integrity and cognitive abilities in community-dwelling older people: the Lothian Birth Cohort, 1936. Neuropsychology. 2013; 27:595–607. https://doi.org/10.1037/a0033354 [PubMed]
- 21. Deary IJ, Gow AJ, Pattie A, Starr JM. Cohort profile: the Lothian Birth Cohorts of 1921 and 1936. Int J Epidemiol. 2012; 41:1576–84. https://doi.org/10.1093/ije/dyr197 [PubMed]
- 22. Johnson W, Corley J, Starr JM, Deary IJ. Psychological and physical health at age 70 in the Lothian Birth Cohort 1936: links with early life IQ, SES, and current cognitive function and neighborhood environment. Health Psychol. 2011; 30:1–11. https://doi.org/10.1037/a0021834 [PubMed]
- 23. Deary IJ, Whiteman MC, Starr JM, Whalley LJ, Fox HC. The impact of childhood intelligence on later life: following up the Scottish mental surveys of 1932 and 1947. J Pers Soc Psychol. 2004; 86:130–47. https://doi.org/10.1037/0022-3514.86.1.130 [PubMed]
- 24. Wardlaw JM, Bastin ME, Valdés Hernández MC, Maniega SM, Royle NA, Morris Z, Clayden JD, Sandeman EM, Eadie E, Murray C, Starr JM, Deary IJ. Brain aging, cognition in youth and old age and vascular disease in the Lothian Birth Cohort 1936: rationale, design and methodology of the imaging protocol. Int J Stroke. 2011; 6:547–59. https://doi.org/10.1111/j.1747-4949.2011.00683.x [PubMed]
- 25. Cordonnier C, Potter GM, Jackson CA, Doubal F, Keir S, Sudlow CL, Wardlaw JM, Al-Shahi Salman R. improving interrater agreement about brain microbleeds: development of the Brain Observer MicroBleed Scale (BOMBS). Stroke. 2009; 40:94–99. https://doi.org/10.1161/STROKEAHA.108.526996 [PubMed]
- 26. Potter GM, Chappell FM, Morris Z, Wardlaw JM. Cerebral perivascular spaces visible on magnetic resonance imaging: development of a qualitative rating scale and its observer reliability. Cerebrovasc Dis. 2015; 39:224–31. https://doi.org/10.1159/000375153 [PubMed]
- 27. Aribisala BS, Wiseman S, Morris Z, Valdés-Hernández MC, Royle NA, Maniega SM, Gow AJ, Corley J, Bastin ME, Starr J, Deary IJ, Wardlaw JM. Circulating inflammatory markers are associated with magnetic resonance imaging-visible perivascular spaces but not directly with white matter hyperintensities. Stroke. 2014; 45:605–07. https://doi.org/10.1161/STROKEAHA.113.004059 [PubMed]
- 28. Gregoire SM, Chaudhary UJ, Brown MM, Yousry TA, Kallis C, Jäger HR, Werring DJ. The Microbleed Anatomical Rating Scale (MARS): reliability of a tool to map brain microbleeds. Neurology. 2009; 73:1759–66. https://doi.org/10.1212/WNL.0b013e3181c34a7d [PubMed]
- 29. Little RJ, Rubin D. (1987). Statistical analysis with missing data. (New York: Wiley).
- 30. Smith EE, O’Donnell M, Dagenais G, Lear SA, Wielgosz A, Sharma M, Poirier P, Stotts G, Black SE, Strother S, Noseworthy MD, Benavente O, Modi J, et al, and PURE Investigators. Early cerebral small vessel disease and brain volume, cognition, and gait. Ann Neurol. 2015; 77:251–61. https://doi.org/10.1002/ana.24320 [PubMed]
- 31. Romero JR, Preis SR, Beiser A, DeCarli C, Viswanathan A, Martinez-Ramirez S, Kase CS, Wolf PA, Seshadri S. Risk factors, stroke prevention treatments, and prevalence of cerebral microbleeds in the Framingham Heart Study. Stroke. 2014; 45:1492–94. https://doi.org/10.1161/STROKEAHA.114.004130 [PubMed]
- 32. Marmot MG, Shipley MJ. Do socioeconomic differences in mortality persist after retirement? 25 year follow up of civil servants from the first Whitehall study. BMJ. 1996; 313:1177–80. https://doi.org/10.1136/bmj.313.7066.1177 [PubMed]
- 33. Rose G, Hamilton PS, Keen H, Reid DD, McCartney P, Jarrett RJ. Myocardial ischaemia, risk factors and death from coronary heart-disease. Lancet. 1977; 1:105–09. https://doi.org/10.1016/S0140-6736(77)91701-9 [PubMed]
- 34. Smith GD, Shipley MJ, Rose G. Magnitude and causes of socioeconomic differentials in mortality: further evidence from the Whitehall Study. J Epidemiol Community Health. 1990; 44:265–70. https://doi.org/10.1136/jech.44.4.265 [PubMed]
- 35. Bosma H, Marmot MG, Hemingway H, Nicholson AC, Brunner E, Stansfeld SA. Low job control and risk of coronary heart disease in Whitehall II (prospective cohort) study. BMJ. 1997; 314:558–65. https://doi.org/10.1136/bmj.314.7080.558 [PubMed]
- 36. Jokela M, Batty GD, Deary IJ, Silventoinen K, Kivimäki M. Sibling analysis of adolescent intelligence and chronic diseases in older adulthood. Ann Epidemiol. 2011; 21:489–96. https://doi.org/10.1016/j.annepidem.2011.01.008 [PubMed]
- 37. Braveman P, Egerter S, Williams DR. The social determinants of health: coming of age. Annu Rev Public Health. 2011; 32:381–98. https://doi.org/10.1146/annurev-publhealth-031210-101218 [PubMed]
- 38. Roseboom T, de Rooij S, Painter R. The Dutch famine and its long-term consequences for adult health. Early Hum Dev. 2006; 82:485–91. https://doi.org/10.1016/j.earlhumdev.2006.07.001 [PubMed]
- 39. Crimmins EM, Saito Y. Trends in healthy life expectancy in the United States, 1970-1990: gender, racial, and educational differences. Soc Sci Med. 2001; 52:1629–41. https://doi.org/10.1016/S0277-9536(00)00273-2 [PubMed]
- 40. Mackenbach JP, Bos V, Andersen O, Cardano M, Costa G, Harding S, Reid A, Hemström O, Valkonen T, Kunst AE. Widening socioeconomic inequalities in mortality in six Western European countries. Int J Epidemiol. 2003; 32:830–37. https://doi.org/10.1093/ije/dyg209 [PubMed]
- 41. Murray AD, McNeil CJ, Salarirad S, Whalley LJ, Staff RT. Early life socioeconomic circumstance and late life brain hyperintensities--a population based cohort study. PLoS One. 2014; 9:e88969. https://doi.org/10.1371/journal.pone.0088969 [PubMed]
- 42. Satizabal CL, Beiser AS, Chouraki V, Chêne G, Dufouil C, Seshadri S. Incidence of Dementia over Three Decades in the Framingham Heart Study. N Engl J Med. 2016; 374:523–32. https://doi.org/10.1056/NEJMoa1504327 [PubMed]
- 43. Dufouil C, Alpérovitch A, Tzourio C. Influence of education on the relationship between white matter lesions and cognition. Neurology. 2003; 60:831–36. https://doi.org/10.1212/01.WNL.0000049456.33231.96 [PubMed]
- 44. Lane EM, Paul RH, Moser DJ, Fletcher TD, Cohen RA. Influence of education on subcortical hyperintensities and global cognitive status in vascular dementia. J Int Neuropsychol Soc. 2011; 17:531–36. https://doi.org/10.1017/S1355617711000324 [PubMed]
- 45. Farfel JM, Nitrini R, Suemoto CK, Grinberg LT, Ferretti RE, Leite RE, Tampellini E, Lima L, Farias DS, Neves RC, Rodriguez RD, Menezes PR, Fregni F, et al, and Brazilian Aging Brain Study Group. Very low levels of education and cognitive reserve: a clinicopathologic study. Neurology. 2013; 81:650–57. https://doi.org/10.1212/WNL.0b013e3182a08f1b [PubMed]
- 46. Deary IJ, Strand S, Smith P, Fernandes C. Intelligence and educational achievement. Intelligence. 2007; 35:13–21. https://doi.org/10.1016/j.intell.2006.02.001
- 47. Johnson W, Deary IJ, Iacono WG. Genetic and Environmental Transactions Underlying Educational Attainment. Intelligence. 2009; 37:466–78. https://doi.org/10.1016/j.intell.2009.05.006 [PubMed]
- 48. Valdés Hernández MC, Booth T, Murray C, Gow AJ, Penke L, Morris Z, Maniega SM, Royle NA, Aribisala BS, Bastin ME, Starr JM, Deary IJ, Wardlaw JM. Brain white matter damage in aging and cognitive ability in youth and older age. Neurobiol Aging. 2013; 34:2740–47. https://doi.org/10.1016/j.neurobiolaging.2013.05.032 [PubMed]
- 49. Karama S, Bastin ME, Murray C, Royle NA, Penke L, Muñoz Maniega S, Gow AJ, Corley J, Valdés Hernández MC, Lewis JD, Rousseau ME, Lepage C, Fonov V, et al. Childhood cognitive ability accounts for associations between cognitive ability and brain cortical thickness in old age. Mol Psychiatry. 2014; 19:555–59. https://doi.org/10.1038/mp.2013.64 [PubMed]
- 50. Mathers JC, Strathdee G, Relton CL. Induction of epigenetic alterations by dietary and other environmental factors. Adv Genet. 2010; 71:3–39. https://doi.org/10.1016/B978-0-12-380864-6.00001-8 [PubMed]
- 51. McGuinness D, McGlynn LM, Johnson PC, MacIntyre A, Batty GD, Burns H, Cavanagh J, Deans KA, Ford I, McConnachie A, McGinty A, McLean JS, Millar K, et al. Socio-economic status is associated with epigenetic differences in the pSoBid cohort. Int J Epidemiol. 2012; 41:151–60. https://doi.org/10.1093/ije/dyr215 [PubMed]
- 52. Borghol N, Suderman M, McArdle W, Racine A, Hallett M, Pembrey M, Hertzman C, Power C, Szyf M. Associations with early-life socio-economic position in adult DNA methylation. Int J Epidemiol. 2012; 41:62–74. https://doi.org/10.1093/ije/dyr147 [PubMed]
- 53. Giles-Corti B, Donovan RJ. The relative influence of individual, social and physical environment determinants of physical activity. Soc Sci Med. 2002; 54:1793–812. https://doi.org/10.1016/S0277-9536(01)00150-2 [PubMed]
- 54. Prochaska JD, Nolen AB, Kelley H, Sexton K, Linder SH, Sullivan J. Social Determinants of Health in Environmental Justice Communities: Examining Cumulative Risk in Terms of Environmental Exposures and Social Determinants of Health. Hum Ecol Risk Assess. 2014; 20:980–94. https://doi.org/10.1080/10807039.2013.805957 [PubMed]
- 55. Deary IJ, Weiss A, Batty GD. Intelligence and Personality as Predictors of Illness and Death: How Researchers in Differential Psychology and Chronic Disease Epidemiology Are Collaborating to Understand and Address Health Inequalities. Psychol Sci Public Interest. 2010; 11:53–79. https://doi.org/10.1177/1529100610387081 [PubMed]
- 56. Barbeau EM, Krieger N, Soobader MJ. Working class matters: socioeconomic disadvantage, race/ethnicity, gender, and smoking in NHIS 2000. Am J Public Health. 2004; 94:269–78. https://doi.org/10.2105/AJPH.94.2.269 [PubMed]
- 57. Cutler DM, Lleras-Muney A. Education and Health: Evaluating Theories and Evidence. National Bureau of Economic Research Working Paper Series. 2006; No. 12352.
- 58. Gale CR, Booth T, Starr JM, Deary IJ. Intelligence and socioeconomic position in childhood in relation to frailty and cumulative allostatic load in later life: the Lothian Birth Cohort 1936. J Epidemiol Community Health. 2016; 70:576–82. https://doi.org/10.1136/jech-2015-205789 [PubMed]
- 59. van Dijk EJ, Prins ND, Vrooman HA, Hofman A, Koudstaal PJ, Breteler MM. Progression of cerebral small vessel disease in relation to risk factors and cognitive consequences: rotterdam Scan study. Stroke. 2008; 39:2712–19. https://doi.org/10.1161/STROKEAHA.107.513176 [PubMed]
- 60. Benavente O, Pearce LA, Andersen D, Bazan C, Hart RG. MRI Predictors of Stroke Recurrence in Patients with Recent Lacunar Stroke. J Stroke Cerebrovasc Dis. 2014; 4:618–24.
- 61. Deary I, Whalley LJ, Starr J. (2009). A lifetime of intelligence: follow-up studies of the Scottish Mental Surveys of 1932 and 1947: American Psychological Association).
- 62. Deary IJ, Pattie A, Starr JM. The stability of intelligence from age 11 to age 90 years: the Lothian birth cohort of 1921. Psychol Sci. 2013; 24:2361–68. https://doi.org/10.1177/0956797613486487 [PubMed]
- 63. Gow AJ, Johnson W, Pattie A, Brett CE, Roberts B, Starr JM, Deary IJ. Stability and change in intelligence from age 11 to ages 70, 79, and 87: the Lothian Birth Cohorts of 1921 and 1936. Psychol Aging. 2011; 26:232–40. https://doi.org/10.1037/a0021072 [PubMed]
- 64. Salarirad S, Staff RT, Fox HC, Deary IJ, Whalley L, Murray AD. Childhood intelligence and brain white matter hyperintensities predict fluid intelligence age 78-81 years: a 1921 Aberdeen birth cohort study. Age Ageing. 2011; 40:562–67. https://doi.org/10.1093/ageing/afr065 [PubMed]
- 65. Benyamin B, Wilson V, Whalley LJ, Visscher PM, Deary IJ. Large, consistent estimates of the heritability of cognitive ability in two entire populations of 11-year-old twins from Scottish mental surveys of 1932 and 1947. Behav Genet. 2005; 35:525–34. https://doi.org/10.1007/s10519-005-3556-x [PubMed]