


Introduction
Normal development requires the coordination of growth and differentiation and the elimination of excess cells in embryonic structures. Digit formation in vertebrate embryonic limbs provides a valuable model of programmed cell death that sculpts interdigital tissue to varying degrees and confers hand/foot (autopod) morphology in accordance with the functional specialization of a species to swim (ducks, and turtles), fly (bats), or walk (chickens, humans, and lizards) [1–4]. Many studies have demonstrated that interdigit regression is a more complex process than initially thought [5–17], it includes massive apoptosis, growth arrest, and matrix remodeling of the interdigits [18]. Several recent studies have proposed that some regressive changes in the embryo include cell senescence that is similar to the senescence induced by oncogenes or senescence-inducing stimuli in adult tissues [19–21]. Digit and interdigit progenitors retain sufficient plasticity to interchange their fates until very advanced stages of development [3]. Therefore, the unraveling of the molecular machinery that determines whether a skeletal progenitor undergoes senescence and cell death or proliferates and differentiates to form a digit is of great biological relevance [22].
Factors that regulate cell cycle progression and/or tumor suppressor signals may be good candidate signals that function downstream of growth factors to control interdigital tissue regression. p53 exerts a central role in the control of most processes of cell senescence, but not in the studied examples of developmental senescence [20]. This finding suggests that other tumor suppressor genes might account for the regulation of senescence in embryonic tissues. Previous studies have demonstrated that members of the Btg/Tob family (also termed the APRO-family; [23]) are expressed in embryonic tissues ([24, 25]) and promote cell death and senescence in various cell lineages [26–28]. Deregulation of the Btg/Tob genes is associated with carcinogenesis and tumor growth ([27, 29–31], which is consistent with their influence on cell proliferation and cell death. Mice that are deficient in genes from this family lack a digit phenotype [32], but there is a human syndrome that is caused by the deletion of the region of chromosome 12 that contains the Btg1 gene that results in syndactyly in toes 2-3 [33]. These findings suggest that members of this gene family may be good candidates to redundantly regulate the final stages of limb outgrowth and/or the remodeling process for digit separation.
This study examined whether apoptosis and cell senescence in embryonic systems are redundant regressive changes that are regulated by tumor suppressor genes, similar to adult tissues during ageing and cancer.
Results
Interdigital tissue regression and cell senescence
Several programmed cell death processes in the embryo are accompanied by cell senescence [19–21], which is characterized by the irreversible loss of replicating ability. The arrest of proliferation in senescent cells is often associated with the overactivation of β-galacto-sidase (“senescence-associated β-gal”), up-regulation of the tumor suppressor gene p21 (inhibitor of cyclin-dependent kinases), and the production of secreted factors, which are collectively termed the senescence-associated secretory phenotype (SASP) that reinforce and propagate senescence in autocrine and paracrine manners [42].
The interdigital tissue expresses p21 [43] and in the course of regression undergoes growth arrest [5, 44]. Therefore, we examined markers of cell senescence. We observed that most recognized markers of senescence were activated in regressing interdigits. Figure 1 A-C shows that β-gal activity at pH6 was very high, and it constituted a precise marker of the regressing process. p21 was expressed at moderate levels in the interdigital mesoderm but it was up-regulated during regression (Table 1). At difference of p21, its usual regulator in other senescence processes, p53 was down-regulated in the course of regression. However, p63 and p73, which are the other two members of the p53 family of tumor suppressor genes implicated in the control of mesodermal limb apoptosis [15], are also up-regulated in the course of interdigit remodeling. In addition, many characteristic members of SASP appeared intensely up-regulated. These factors included the following: cytokines, such as Interleukin 8 L1 (K60) and Interleukin 8 L2 (EMF-1); growth factors, such as Igf1, IgfBP5, HGF, Tgfβ2 and AREGB (Amphiregulin B); metalloproteinases (MMP) such as, MMP2 (gelatinase A), MMP9, and ADAMTS9; and members of the TNF signaling pathway, including Fas (CD95), Tnfrsf21 (DR6), and Tnfrsf 23 (Table 1). Notably, some of these factors, such as ADAMTS9 or Tgfβs, play a role in promoting the regression of the interdigit webs [45, 46].
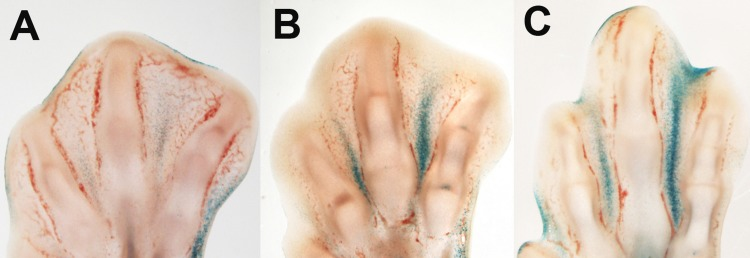
Figure 1. β-gal activity in the course of interdigit tissue regression in the embryonic chick. Longitudinal vibratome sections of chick limb autopods at days 7 (A), 7.5 (B), and 8 id (C).
Table 1. Transcriptional modifications of cell cycle regulators and SASP components during the regression of the third interdigit
| Expression Fold Changes | |||||||||||||||||||||||||||||||||||||||||||||||||||||||||||||||||||||||||||||||||||||||||||||||||||
|---|---|---|---|---|---|---|---|---|---|---|---|---|---|---|---|---|---|---|---|---|---|---|---|---|---|---|---|---|---|---|---|---|---|---|---|---|---|---|---|---|---|---|---|---|---|---|---|---|---|---|---|---|---|---|---|---|---|---|---|---|---|---|---|---|---|---|---|---|---|---|---|---|---|---|---|---|---|---|---|---|---|---|---|---|---|---|---|---|---|---|---|---|---|---|---|---|---|---|---|
| Gene | GenBank | 6 id. | 7.5 id. | 8 id. | |||||||||||||||||||||||||||||||||||||||||||||||||||||||||||||||||||||||||||||||||||||||||||||||
| Cell Cycle Regulation | |||||||||||||||||||||||||||||||||||||||||||||||||||||||||||||||||||||||||||||||||||||||||||||||||||
| p21 | AF513031 | 1.00 ± 0.05 | 1.30 ± 0.30* | 3.01 ± 0.10*** | |||||||||||||||||||||||||||||||||||||||||||||||||||||||||||||||||||||||||||||||||||||||||||||||
| p53 | NM_205264 | 1.00 ± 0.06 | 0.57 ± 0.03** | 0.40 ± 0.17** | |||||||||||||||||||||||||||||||||||||||||||||||||||||||||||||||||||||||||||||||||||||||||||||||
| p63 | NM_204351 | 1.00 ± 0.03 | 2.42 ± 0.37** | 4.73 ± 0.88*** | |||||||||||||||||||||||||||||||||||||||||||||||||||||||||||||||||||||||||||||||||||||||||||||||
| p73 | XM_417545 | 1.00 ± 0.04 | 1.67 ± 0.27* | 2.37 ± 0.61* | |||||||||||||||||||||||||||||||||||||||||||||||||||||||||||||||||||||||||||||||||||||||||||||||
| Senescence-Associated Secretory Phenotype (SASP) | |||||||||||||||||||||||||||||||||||||||||||||||||||||||||||||||||||||||||||||||||||||||||||||||||||
| IL1b | NM_204524 | 1.01 ± 0.06 | 1.70 ± 0.73 | 1.26 ± 0.43 | |||||||||||||||||||||||||||||||||||||||||||||||||||||||||||||||||||||||||||||||||||||||||||||||
| IL6 | NM_204628 | 1.00 ± 0.02 | 1.72 ± 0.70 | 1.39 ± 0.30 | |||||||||||||||||||||||||||||||||||||||||||||||||||||||||||||||||||||||||||||||||||||||||||||||
| IL8L1 | NM_205018 | 1.00 ± 0.04 | 11.10 ± 3.51* | 20.59 ± 5.18* | |||||||||||||||||||||||||||||||||||||||||||||||||||||||||||||||||||||||||||||||||||||||||||||||
| IL8L2 | NM_205498 | 1.02 ± 0.08 | 1.93 ± 0.22** | 3.12 ± 0.46* | |||||||||||||||||||||||||||||||||||||||||||||||||||||||||||||||||||||||||||||||||||||||||||||||
| CXCL12 | NM_204510 | 1.00 ± 0.03 | 0.43 ± 0.04*** | 0.53 ± 0.10** | |||||||||||||||||||||||||||||||||||||||||||||||||||||||||||||||||||||||||||||||||||||||||||||||
| AREGB | NM_001031537 | 1.05 ± 0.19 | 2.23 ± 0.43* | 2.46 ± 0.71* | |||||||||||||||||||||||||||||||||||||||||||||||||||||||||||||||||||||||||||||||||||||||||||||||
| HGF | NM_001030370 | 1.01 ± 0.08 | 1.98 ± 0.20** | 1.85 ± 0.37* | |||||||||||||||||||||||||||||||||||||||||||||||||||||||||||||||||||||||||||||||||||||||||||||||
| TGFβ2 | XM_003640970 | 1.03 ± 0.07 | 1.85 ± 0.25* | 2.53 ± 0.53* | |||||||||||||||||||||||||||||||||||||||||||||||||||||||||||||||||||||||||||||||||||||||||||||||
| IGF1 | NM_001004384 | 1.00 ± 0.01 | 5.72 ± 1.62* | 7.86 ± 2.20* | |||||||||||||||||||||||||||||||||||||||||||||||||||||||||||||||||||||||||||||||||||||||||||||||
| IGFBP5 | XM_004942886 | 1.00 ± 0.02 | 7.70 ± 1.86** | 19.36 ± 4.44** | |||||||||||||||||||||||||||||||||||||||||||||||||||||||||||||||||||||||||||||||||||||||||||||||
| IGFBP7 | XM_420577 | 1.00 ± 0.04 | 0.86 ± 0.11 | 0.66 ± 0.07 | |||||||||||||||||||||||||||||||||||||||||||||||||||||||||||||||||||||||||||||||||||||||||||||||
| MMP2 | NM_204420 | 1.01 ± 0.06 | 2.79 ± 0.45** | 4.47 ± 0.78* | |||||||||||||||||||||||||||||||||||||||||||||||||||||||||||||||||||||||||||||||||||||||||||||||
| MMP9 | NM_204667 | 1.00 ± 0.02 | 2.49 ± 0.44** | 4.33 ± 0.91* | |||||||||||||||||||||||||||||||||||||||||||||||||||||||||||||||||||||||||||||||||||||||||||||||
| Adamts9 | XM_414417 | 1.00 ± 0.04 | 6.70 ± 1.11** | 22.66 ± 5.92* | |||||||||||||||||||||||||||||||||||||||||||||||||||||||||||||||||||||||||||||||||||||||||||||||
| Adam17 | NM_001008682 | 1.00 ± 0.04 | 1.14 ± 0.13 | 1.26 ± 0.07 | |||||||||||||||||||||||||||||||||||||||||||||||||||||||||||||||||||||||||||||||||||||||||||||||
| FAS | XM_421659 | 1.02 ± 0.04 | 1.88 ± 0.18*** | 1.81 ± 0.24* | |||||||||||||||||||||||||||||||||||||||||||||||||||||||||||||||||||||||||||||||||||||||||||||||
| FASLG | NM_001031559 | 1.01 ± 0.06 | 0.78 ± 0.16 | 1.59 ± 0.22 | |||||||||||||||||||||||||||||||||||||||||||||||||||||||||||||||||||||||||||||||||||||||||||||||
| TNFRSF21 | NM_001031103 | 1.00 ± 0.02 | 0.83 ± 0.12 | 1.62 ± 0.25* | |||||||||||||||||||||||||||||||||||||||||||||||||||||||||||||||||||||||||||||||||||||||||||||||
| TNFRSF23 | NM_204386 | 1.03 ± 0.14 | 1.92 ± 0.31* | 3.28 ± 0.88* | |||||||||||||||||||||||||||||||||||||||||||||||||||||||||||||||||||||||||||||||||||||||||||||||
| The values are compared with the basal interdigital expression prior to tissue regression (6 id). | |||||||||||||||||||||||||||||||||||||||||||||||||||||||||||||||||||||||||||||||||||||||||||||||||||
| p < 0,001; | |||||||||||||||||||||||||||||||||||||||||||||||||||||||||||||||||||||||||||||||||||||||||||||||||||
| p < 0.01; | |||||||||||||||||||||||||||||||||||||||||||||||||||||||||||||||||||||||||||||||||||||||||||||||||||
| p< 0.05. | |||||||||||||||||||||||||||||||||||||||||||||||||||||||||||||||||||||||||||||||||||||||||||||||||||
Expression of Btg/Tob genes in interdigital tissue
Members of the Btg/Tob gene family of tumor suppressor genes are expressed in early embryo, including in the limb bud [24, 25]. We investigate the potential implication of these genes in interdigit remodeling because of the role of this gene family in the regulation of proliferation of cancer cells and neural stem cells. Four members of the family, Btg1, Btg2, Tob1 and Tob2, exhibited interdigital expression domains during the course of tissue remodeling in chick and mouse embryos (Fig. 2). Btg3, which is a member of the family that lacks known representative in avian species, is also expressed in the mouse interdigits. Figure 2 shows that not all genes exhibited identical patterns of expression in the autopodial tissues, but all were included in the zones of interdigital cell death.
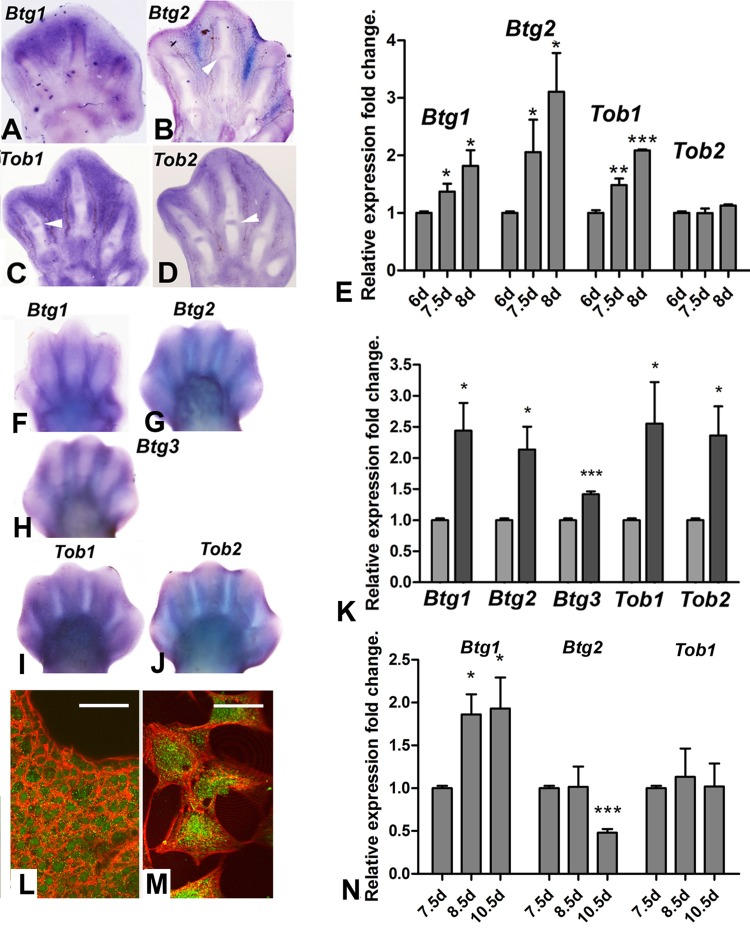
Figure 2. (A-D) in situ hybridizations showing the expression of Btg1 (A), Btg2 (B), Tob1(C) and Tob2 (D) in the chick autopod during interdigit regression. Note that, in addition to the interdigital domains, Tob2, Btg2 and Tob1 are also expressed in the developing interphalangeal joints (arrows). (E) Expression level of Btg and Tob genes in interdigital tissue of chick leg during the course of remodeling. The chart shows QPCR-evaluated fold changes in the expression of Btg1, Btg2, Tob1 and Tob2 in the third interdigit of the chick leg bud at 7.5 and 8 id compared with their expression levels prior to the onset of tissue regression (6 id). (F-J) in situ hybridizations showing the expression of the Btg/Tob genes in the developing mouse autopod. (K) chart is a comparative QPCR analysis of the interdigital expression of Btg/Tob genes at day 13 p.c. (light columns) versus day 13,5 pc (dark columns). (L-M) immunostaining for BTG2 (green) combined with phalloidin (red) in vibratome sections of the third interdigit (M), and in cultured mesodermal progenitors (M). Note that the protein is expressed in the cytoplasm and nuclei. Scale bar in L = 100μm; Bar in M = 20μm. (N) shows a QPCR analysis of the expression of Btg1, Btg2 and Tob1 in the third interdigit of embryonic duck leg at equivalent stages of that of the chick in E. Unlike in the chick (compare with E), Btg2 becomes down-regulated and Tob1 is not up-regulated over the course of tissue remodeling. ***p < 0,001; ** p < 0.01; * p< 0.05.
Quantitative expression analysis using QPCR in interdigital tissue samples revealed that, the expression level of Btg/Tob genes, except for Tob2, were up-regulated as regression progressed in chick and mouse embryos (Fig. 2E and K). We compared gene expression levels in the chick and mouse legs with the embryonic duck leg, which is a model of physiological syndactyly, to select the most suitable member of the family for subsequent functional analysis in interdigit regression. Btg1, Btg2 and Tob1 were expressed in the duck leg interdigits, but Btg2 was downregulated in the developing duck interdigits in contrast to being upregulated in chick and mouse embryos (Fig. 2N). The presence of BTG2 protein in the interdigit was also confirmed using immunolabeling in tissue sections and isolated cells (Fig. 2L and M).
We analyzed the regulation of Btg2 in interdigit explants and mesodermal cell cultures after treatments with growth factors and signals present in autopodial tissues during interdigital tissue regression to examine the association between Btg2 and the signaling pathways that are proposed to control interdigital cell death. Expression was down-regulated by treatments with FGF2 (0.32± 0.05 x; means ± S.D.; p<0.05) and IGF1 (0.48± 0.12 x; means ± S.D.; p<0.05) which are both survival signals for the interdigital mesoderm. Conversely, expression was up-regulated after treatments with IGFBP5 which binds and neutralizes IGF1 (2.13± 0.20 x; means ± S.D.; p<0.05) and with the IGF1 antagonist AG1024 (2.0 ± 0.09x ; means ± S.D.; p<0.05). Btg2 expression was also up-regulated by addition of H2O2 in the culture medium to increase oxidative stress (1.49± 0.04x; means ± S.D.; p<0.01).
Btg2 overexpression in limb mesodermal progenitors increases oxidative stress and induces cell death and cell senescence
The extent of cell death and cell cycle profiles were analyzed using flow cytometry after propidium iodide staining in mesodermal progenitors overexpressing Btg2 (Fig. 3). Senescence was also evaluated using flow cytometry measurement of CFSE dye dilution [40] (Fig. 3 B and B′).
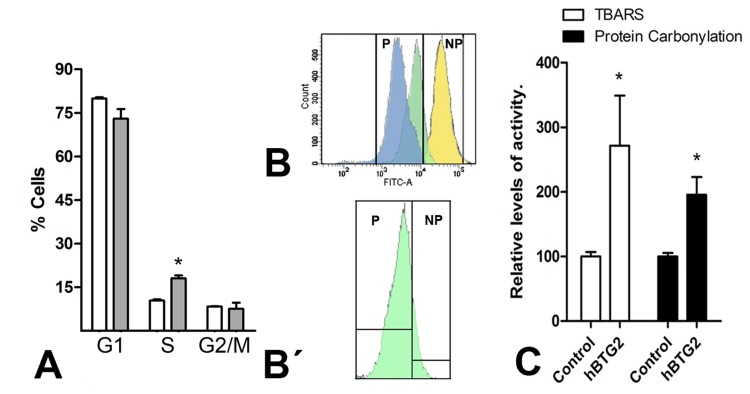
Figure 3. (A) Graphic illustrations comparing the proportion of cells at different cell cycle stages in control (white columns) versus Btg2-overexpressing mesodermal progenitors (grey columns) after 48 hr of culture as evaluated using flow cytometry after PI staining. (B-B′) Illustrates the dilution of CFSE labeling after 48 hr of culture in a representative sample of three distinct experiments. Blue: control cells; Green: Btg2 overexpressing; Yellow: control cells maintained at 4°C. NP (non-proliferating) marks the area of the plot of no proliferation, deduced from the absence of CFSE dilution in control cells maintained at 4°C. P (proliferating) marks the area of the cytometry plot of cells in proliferation. The lower dilution of CFSE in the proliferating cell population (P) of Btg2-overexpressing cells (green) in comparison with control cells (blue) indicates a reduced proliferation rate. B′: detailed view of the Btg2-overexpressing cells in B, isolated from the other values to appreciate that a significant portion (15%) of experimental cells are non-proliferating. (C) Graphic representation of the levels of lipid oxidation and carbonylated proteins in control and Btg2-overexpressing limb mesodermal progenitors. * p< 0.05.
Cells overexpressing Btg2 exhibited a twofold increase in cell death compared to control cells (212.70 ± 36.70 x; means ± S.D. considering the number of dead cells in the control cultures as 100%; p<0.05) and S-phase arrest of cell cycle progression (Fig. 3A). CSFE dye dilution experiments revealed that 15% of mesodermal progenitors that overexpressed Btg2 did not divide during our 48-hr time period in this study (15,20 ± 0.05, vs 0.20 ± 0.01 in control cultures; means ± S.D.; p<0.01; Fig. 3 B-B′).
QPCR analysis confirmed the changes induced by Btg2 at transcriptional level in limb mesodermal progenitors (Table 2). Bcl2, which protects from mitochondrial permeabilization (antiapoptotic), was down-regulated, and Bak, which induces mitochondrial permeability (proapoptotic), was up-regulated. Members of the MAF gene family of transcription factors were recently implicated in interdigital cell death [15] and these genes were also up-regulated by Btg2. The expression of the cell cycle regulator p21 was up-regulated more than threefold and most components of the interdigit secretome, including: Interleukin 8 L1, Interleukin 8 L2, HGF, Igf1, Tgfβ2, AREGB, MMP2, MMP9, Tnfrsf21, and Fas, were also up-regulated (Table 2). Considering the central function of p21 in cell senescence we analyzed whether silencing of this factor modulates the pro-senescence influence of Btg2 overexpression. As shown in Table 2 up-regulation of most SASP components induced by Btg2 were attenuated or abrogated when the cells were transfected with hBtg2 in combination with sh-p21.
Table 2. Transcriptional gene regulation in skeletal progenitors overexpressing Btg2 gene (hBtg2) and Btg2 in combination with sh-p21 (hBtg2 + sh-p21) compared with control cells transfected with empty vectors
| Gene | GenBank | hBtg2(Fold changes vs Control) | hBtg2 + sh-p21(Fold changes vs Control) | ||||||||||||||||||||||||||||||||||||||||||||||||||||||||||||||||||||||||||||||||||||||||||||||||
|---|---|---|---|---|---|---|---|---|---|---|---|---|---|---|---|---|---|---|---|---|---|---|---|---|---|---|---|---|---|---|---|---|---|---|---|---|---|---|---|---|---|---|---|---|---|---|---|---|---|---|---|---|---|---|---|---|---|---|---|---|---|---|---|---|---|---|---|---|---|---|---|---|---|---|---|---|---|---|---|---|---|---|---|---|---|---|---|---|---|---|---|---|---|---|---|---|---|---|---|
| Cell Cycle Regulation | |||||||||||||||||||||||||||||||||||||||||||||||||||||||||||||||||||||||||||||||||||||||||||||||||||
| p21 | AF513031 | 3.24 ± 0.63** | 0.54 ± 0.03***## | ||||||||||||||||||||||||||||||||||||||||||||||||||||||||||||||||||||||||||||||||||||||||||||||||
| p53 | NM_205264 | 1.06 ± 0.11 | 0.68 ± 0.04 | ||||||||||||||||||||||||||||||||||||||||||||||||||||||||||||||||||||||||||||||||||||||||||||||||
| p63 | NM_204351 | 0.83 ± 0.05 | 0.74 ± 0.07 | ||||||||||||||||||||||||||||||||||||||||||||||||||||||||||||||||||||||||||||||||||||||||||||||||
| p73 | XM_417545 | 0.94 ± 0.10 | 1.19 ± 0.14 | ||||||||||||||||||||||||||||||||||||||||||||||||||||||||||||||||||||||||||||||||||||||||||||||||
| Bcl2 | NM_205339 | 0.58 ± 0.03*** | 0.75 ± 0.04 ## | ||||||||||||||||||||||||||||||||||||||||||||||||||||||||||||||||||||||||||||||||||||||||||||||||
| Bak | NM_001030920 | 3.20 ± 0.97* | 3.81 ± 0.16* | ||||||||||||||||||||||||||||||||||||||||||||||||||||||||||||||||||||||||||||||||||||||||||||||||
| MAFA | NM_205025 | 2.57 ± 0.17*** | 1.48 ± 0.14*### | ||||||||||||||||||||||||||||||||||||||||||||||||||||||||||||||||||||||||||||||||||||||||||||||||
| MAFB | NM_001030852 | 1.64 ± 0.16** | 1.18 ± 0.10 # | ||||||||||||||||||||||||||||||||||||||||||||||||||||||||||||||||||||||||||||||||||||||||||||||||
| IL8L1 | NM_205018 | 6.36 ± 1.00*** | 3.24 ± 0.35**# | ||||||||||||||||||||||||||||||||||||||||||||||||||||||||||||||||||||||||||||||||||||||||||||||||
| IL8L2 | NM_205498 | 6.07 ± 1.58** | 6.42 ± 1.03** | ||||||||||||||||||||||||||||||||||||||||||||||||||||||||||||||||||||||||||||||||||||||||||||||||
| AREGB | NM_001031537 | 3.01 ± 0.44*** | 1.76 ± 0.29*# | ||||||||||||||||||||||||||||||||||||||||||||||||||||||||||||||||||||||||||||||||||||||||||||||||
| HGF | NM_001030370 | 5.46 ± 0.56*** | 3.00 ± 0.16**## | ||||||||||||||||||||||||||||||||||||||||||||||||||||||||||||||||||||||||||||||||||||||||||||||||
| TGFβ2 | XM_003640970 | 2.00 ± 0.35* | 0.91 ± 0.05 # | ||||||||||||||||||||||||||||||||||||||||||||||||||||||||||||||||||||||||||||||||||||||||||||||||
| IGF1 | NM_001004384 | 4.16 ± 0.58*** | 2.16 ± 0.14**# | ||||||||||||||||||||||||||||||||||||||||||||||||||||||||||||||||||||||||||||||||||||||||||||||||
| IGFBP5 | XM_004942886 | 0.75 ± 0.07 | 0.62 ± 0.03 | ||||||||||||||||||||||||||||||||||||||||||||||||||||||||||||||||||||||||||||||||||||||||||||||||
| MMP2 | NM_204420 | 1.52 ± 0.15* | 1.56 ± 0.04** | ||||||||||||||||||||||||||||||||||||||||||||||||||||||||||||||||||||||||||||||||||||||||||||||||
| MMP9 | NM_204667 | 1.46 ± 0.13* | 1.29 ± 0.13 | ||||||||||||||||||||||||||||||||||||||||||||||||||||||||||||||||||||||||||||||||||||||||||||||||
| Adamts9 | XM_414417 | 1.05 ± 0.08 | 1.46 ± 0.11*## | ||||||||||||||||||||||||||||||||||||||||||||||||||||||||||||||||||||||||||||||||||||||||||||||||
| FAS | XM_421659 | 2.39 ± 0.42** | 1.53 ± 0.12**# | ||||||||||||||||||||||||||||||||||||||||||||||||||||||||||||||||||||||||||||||||||||||||||||||||
| FASLG | NM_001031559 | 1.11 ± 0.14 | 0.98 ± 0.13 | ||||||||||||||||||||||||||||||||||||||||||||||||||||||||||||||||||||||||||||||||||||||||||||||||
| TNFRSF21 | NM_001031103 | 1.95 ± 0.29** | 0.94 ± 0.10 ## | ||||||||||||||||||||||||||||||||||||||||||||||||||||||||||||||||||||||||||||||||||||||||||||||||
| TNFRSF23 | NM_204386 | 1.02 ± 0.11 | 0.77 ± 0.11 | ||||||||||||||||||||||||||||||||||||||||||||||||||||||||||||||||||||||||||||||||||||||||||||||||
| p < 0,001; | |||||||||||||||||||||||||||||||||||||||||||||||||||||||||||||||||||||||||||||||||||||||||||||||||||
| p < 0.01; | |||||||||||||||||||||||||||||||||||||||||||||||||||||||||||||||||||||||||||||||||||||||||||||||||||
| p< 0.05 statistical significance vs control cells; | |||||||||||||||||||||||||||||||||||||||||||||||||||||||||||||||||||||||||||||||||||||||||||||||||||
| p< 0,001; | |||||||||||||||||||||||||||||||||||||||||||||||||||||||||||||||||||||||||||||||||||||||||||||||||||
| p < 0.01; | |||||||||||||||||||||||||||||||||||||||||||||||||||||||||||||||||||||||||||||||||||||||||||||||||||
| p< 0.05 statistical significance vs hBtg2. | |||||||||||||||||||||||||||||||||||||||||||||||||||||||||||||||||||||||||||||||||||||||||||||||||||
Btg2 increases oxidative stress in HeLa cells [47]. Therefore, we explored whether overexpression of Btg2 in limb mesodermal progenitors was accompanied by changes in oxidative stress. We detected a threefold increase in lipid oxidation and a twofold increase in carbonylated proteins in 2-day cultures of limb mesodermal progenitors over-expressing Btg2 (Fig. 3C).
Overexpression of Btg2 inhibits limb outgowth in vivo
We overexpressed Btg2 in the mesenchymal limb progenitors of day 2 embryos to investigate whether the antiproliferative and proapoptotic effects of Btg2 were also induced in vivo. Electroporation at this stage is very efficient and devoid of undesired side effects [37]. This stage precedes the initiation of interdigital cell death by 4 days, but it is well known that the response of the limb mesoderm to death-inducing and survival signals is maintained during the entire period of morphogenesis [48]. Control of transfection using a GFP construct confirmed the mesodermal distribution of the electroporated genes (Fig 4B, D). Figures 4A and C show that the size of the transfected limbs was reduced compared to the contralateral control limbs. Histological analysis demonstrated the presence of a moderate number of TUNEL positive cells in the experimental limb that were not observed in the control contralateral limb (Fig. 4 D′). The number of anti-p-H3 positive mesodermal dividing cells in experimental limbs decreased 33% compared to control limbs (67,4 ± 3,6; mean values ± S.D. per field considering the number of p-H3 positive cells in the control limb as 100%; Fig. 4 E-F). Cells positive for β-gal labeling also appeared increased in experimental limbs in relation with their contralateral control (Fig. 5). As observed in the in vitro experiments these changes were accompanied by up-regulation of p21 (1,47 ± 0.19 x; mean± S.D.; p<0.05)
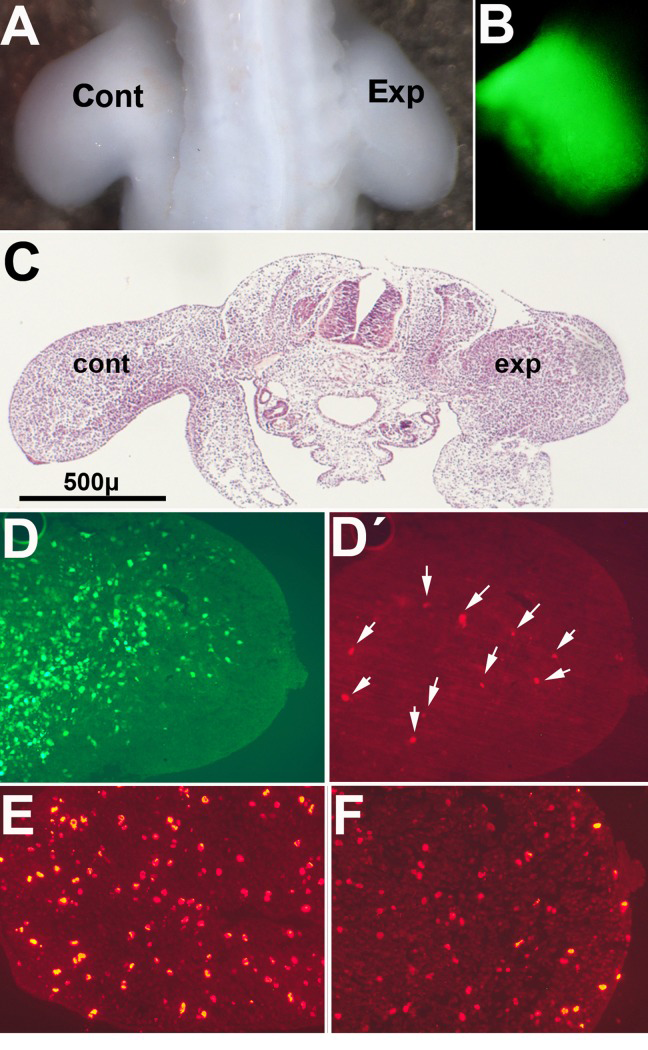
Figure 4. Pictures illustrate chick embryos 48 hr after electroporation of GFP /Btg2 constructs in the right wing bud at 2 id (A) Dorsal view of a chick embryo showing the reduced size of the experimental limb (Exp) compared with the contralateral control (Cont). (B) Mesodermal expression of GFP in the limb 48 hr after electroporation. (C) HE stained transverse section of an experimental embryo to show the different size of the experimental limb (exp) compared with the contralateral limb (cont). (D) and (D′), show the expression of GFP (D) and the presence of TUNEL-positive apoptotic cells (arrows in (D′) in a correlative section of the experimental limb in (C). E-F, are correlative sections of the embryo in (C) after immunolabeling with anti-p-H3. Note the reduced number of positive cells in the experimental limb (F) compared with the control limb (E).
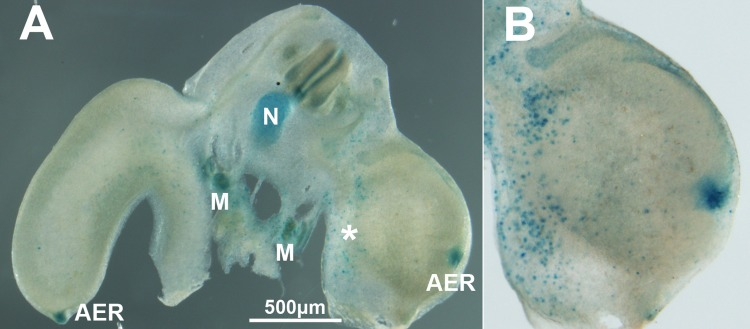
Figure 5. (A) Transverse vibratome section of an experimental embryo 48 hr after electroporation of Btg2. Note the abundance of cells positive for β-gal activity in the electroporated limb (*). (B) is a detailed view of the limb electroporated with Btg2. As previously reported, β-gal activity is intense in the AER of both control and experimental limbs, in the mesonephros (M) and in the notochord (N).
Discussion
Previous studies support the coexistence of different cell death effectors that are able to replace one another during the elimination of the interdigital mesoderm [13, 49, 50]. These death effectors include caspase-driven apoptosis [12], lysosomal-driven cell death [13], and oxidative stress-driven cell death [8, 16, 51]. Our findings add changes in the characteristics of senescence in the regressing interdigits to these factors. We detected an intense up-regulation of p21, which is a characteristic feature of developmental senescence [21], that was accompanied by an up-regulation of characteristic components of the senescence-associated secretory phenotype (SASP) including Interleukin 8 L1, Interleukin 8 L2, Igf1, IgfBP5, HGF, Tgfβ2, AREGB (Amphiregulin B), the metalloproteinases MMP2, MMP9 and ADAMTS9; and members of the TNF signaling superfamily (Fas, Tnfrsf21, and Tnfrsf 23). SASP components in adult and tumoral tissues function as a hierarchical network that establishes functional links between regressive changes. SASP functions include the induction of low-level inflammation accompanied by the activation of matrix proteases, the disruption of stem cell function, and the liberation of oxidizing molecules [52–54]. These processes, together with programmed apoptosis, are central events during physiological interdigit tissue regression.
We also detected an intense activation of β-gal in the regressing interdigits. This feature is a hallmark of cell senescence [21, 34]. Notably, the labeling pattern of β-gal activity in the interdigits closely correlated with progression of cell death during interdigit remodeling.
This correlation was also observed in other areas of embryonic cell death including the closure of the lens, limb AER, and the developing heart (Figures 5 and 6).
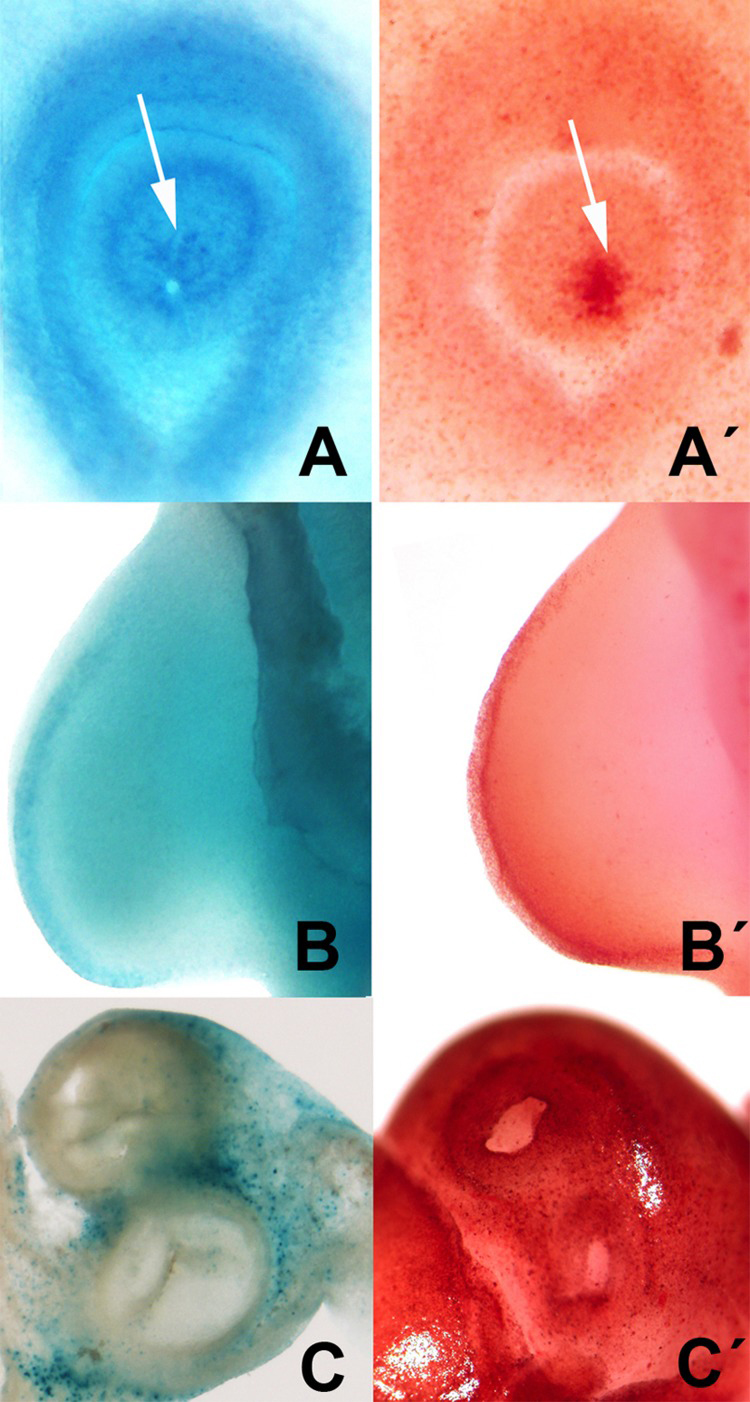
Figure 6. Selection of areas of embryonic programmed cell death showing the parallelism between the distribution of neutral red vital staining (A′, B′, C′) and β-gal activity (A, B C). A-A′: cell death (arrows) during the closure of the lens in chick embryos at 2.5 id. B-B′ cell death in the AER in the embryonic limb at id 3.5. C-C′, cell death in the root of the main arteries of the embryonic heart at id 7.5.
Our finding also revealed that members of the Btg/Tob gene family of antiproliferative, tumor suppressor factors [55] were expressed in the interdigital tissue, which suggests a redundant participation in the control of tissue remodeling. The Tob and Btg genes have evolutionarily conserved domains in their amino terminal regions that contribute to their antiproliferative activities [23, 56, 57]. Furthermore, each family member participates in distinct physiological processes via a variety of molecular mechanisms, including regulation of DNA-binding of sequence-specific transcription factors, interaction with intracellular regulatory factors, and modulation of mRNA turnover [31]. Btg2, which is the founding member of the Btg/Tob gene family, replicated the molecular and cellular changes in limb mesoderm during interdigital tissue remodeling, as observed in tumoral tissues [26, 28]. These changes were induced by gain-of-function experiments in vivo and in vitro and included apoptosis, transcriptional modification of cell senescence characteristics, arrest of cell cycle progression, and oxidative stress. The proapoptotic influence was associated at the transcriptional level with the down-regulation of Bcl-2 and the up-regulation of Bak. Therefore, the expression ratio between Bcl2 and Bak, which determines cell fate (apoptosis vs survival, [58]), was shifted toward apoptosis. Cell cycle arrest is accompanied by intense up-regulation of p21, as observed in other senescence processes [19, 21]. Notably, 15% of cells over-expressing Btg2 did not replicate during the 48 hr period that was analyzed in this study, which supports the induction of cell senescence. Btg2 overexpression also induced the expression of the SASP components in the interdigit, including Interleukin 8L1, Interleukin 8L2, Igf1, HGF, Tgfβ2, AREGB, MMP2, MMP9, Tnfrsf21, and FAS. Our findings show that p21 exerts a central role in these effects. Hence, up-regulation of many components of the SASP transcriptome by overexpression of Btg2 is abrogated or reduced when p21 is silenced by co-transfection with a sh-RNAi against p21.
Oxidative stress plays a central role in interdigit regression [8, 16, 51]. Our study indicate that overexpression of Btg2 doubled the level of protein carbonylation and tripled the level of lipid peroxidation. We also demonstrated that Btg2 was up-regulated when oxidative stress increased in limb mesoderm in cultures containing H2O2. This finding suggests that the local increase in ROS observed in the regressing interdigit [51] establishes a positive feedback loop that promotes and/or maintains the expression of this antiproliferative factor.
One remarkable feature of the regulation of interdigital cell death is the combined participation of various death mechanisms. The coordination of these dying routes is not known. This study provides a new mechanism that promotes cell senescence and apoptosis. We demonstrate that Btg2 was down-regulated in cultures treated with FGF2 or IGF1, which are major antiapoptotic factors implicated in interdigital cell death [59–63] and up-regulated after chemically blockade of IGF signaling and when mesodermal progenitors were cultured in the presence of IGF binding protein-5. The interdigital expression of various IGF binding proteins that antagonize IGF1 [59] and the decay of FGF production by the AER at the end of limb morphogenesis together with the local increase in ROS may all contribute to the physiological up-regulation of Btg2 in the regressing interdigit.
In summary, this study highlights the contribution of a senescence-like process during the regression of interdigital tissue and delineates the involvement of Btg2 in cooperation with p21, in the promotion of cell cycle arrest, caspase-dependent cell death, and transcriptional up-regulation of components of the senescence-associated secretory phenotype. Our unpublished observations also indicate that other members of this family, such as Btg1 and Tob1 also promote cell death in the limb mesoderm, which explains the absence of an overt digit phenotype in mice that are deficient for members of this gene family.
Methods
Animal models
We used Rhode Island chicken embryos from 2 to 8.5 days of incubation (id), Royal Pekin duck embryos from 7.5 to 11 id, and C57BL6 mouse embryos from 12 to 14 days post-coitum (p.c.).
In situ hybridization
PFA-fixed specimens were treated with 10 μg/ml of proteinase K for 20-30 minutes at 20°C. Hybridization with digoxigenin-labeled antisense RNA probes was performed at 68°C. An alkaline phosphatase-conjugated anti-digoxigenin antibody (dilution 1:2000) was used (Roche). Reactions were developed with a BCIP/NBT substrate (Roche).
The probes for chick Btg1, Btg2, Btg4, Tob1 and Tob2; duck Btg1, Btg2, and Tob1; and mouse Btg1, Btg2, Btg3, Btg4, Tob1 and Tob2 were obtained from PCR.
Mesodermal cultures
Mesodermal progenitors were obtained from the progress zone region of chick leg buds at 4.5 id (25 HH) or from the interdigital regions at 5.5 id. Cells were dissociated and suspended in DMEM with 10% fetal bovine serum, 100 units/ml penicillin and 100 μg/ml streptomycin. Cell death, proliferation and transcriptional changes were analyzed in subconfluent monolayer cultures of control and Btg2-overexpressing mesodermal cells.
Regulation of Btg2 was investigated in high density cultures after the following treatments: FGF2 (66 ng/ml.; Peprotech); IGF1 (100 ng/ml.; GenScript); IGFBP5 (3 μg/ml.; Origene); the inhibitor of IGF signaling AG1024 (15 μM; sc-205907, Santa Cruz Biotechnology); and H2O2 (0.7 mM.)
β-gal activity and immunolabeling
The β-galactosidase activity assay [34] was performed at pH 6 in vibratome sections of limb autopods fixed in 4% glutaraldehyde.
Immunolabeling for BTG (anti-Btg2; sc-33775, Santa Cruz Biotechnology) was performed in samples fixed in 4% PFA. Detection of mitotic cells was performed using immunolabeling with an anti-phospho-histone H3 antibody (Milipore). Counterstaining was performed using rhodamine-phalloidin (Sigma) or DAPI (Vector Laboratories).
Cell nucleofection
We used constructs for the human Btg2 gene cloned into the pCMV6-XL5 vector (SC115914, Origene) and also pCAGGS-GFP [35] for gain-of-function experiments. p21 gene silencing was performed by electroporation of a short hairpin RNAi (sh-p21), cloned into the pcU6-1-shRNAi (a generous gift of Dr Tim J Doran) as described by [36]. The efficiency of electroporations was confirmed using QPCR and immunohistochemistry.
For in vitro experiments, cells were electroporated using the Eppendorf Multiporator system (Eppendorf) following the manufacturer's instructions. Control nucleofections using the empty vector were performed in all experiments.
For in vivo experiments, the limb bud was electroporated at day 2 of incubation (stage 13 HH) with a mix of 0.1% Fast Green (Sigma®), 1 μg/μl pCAGGS-GFP, and 8 μg/μl of hBtg2- pCMV6-XL5 according to the Gros and Tabin procedure [37]. Limbs electroporated with pCAGGS-GFP alone developed normally and were used as controls. Identification of GFP labeling was used to assess the spatial distribution of electroporated cells in vivo.
The gross morphology of limbs overexpressing Btg2/GFP was examined in paraffin wax or vibratome sections. These sections were also used for TUNEL and β-galactosidase activity assays, and p-H3 immunolabeling, to detect cell death, cell senescence and cell proliferation respectively.
Oxidative stress assays
Oxidative stress was evaluated via quantification of lipid oxidation and protein carbonylation in control and Btg2-overexpressing cultures of limb mesodermal progenitors. Cells were lysed using 20 mM potassium phosphate lysis buffer containing 0.1% Triton and 150 mM NaCl. Cell lysates were clarified of cellular debris by centrifugation (10000xg) at 4*00BA*C for 10 min, and the supernatants were used in the biochemical assays.
Lipid oxidation was evaluated using the thiobarbituric acid based assay (TBARS) according to the method described by Ohkawa et al. [38] Protein carbonylation was determined using a 2,4-dinitrophenyl-hydrazine based assay [39]. Data were adjusted in accordance with the total amount of proteins measured in our samples. Data in experimental samples were compared to results obtained in control samples, which were considered 100%.
Flow cytometry
Control and Btg2-overexpressing cell cultures were dissociated by treatment with trypsin EDTA (Lonza). One million cells were used in each test. For propidium iodide (PI) staining the cells were washed twice in PBS and fixed in 90% ethanol. Samples were incubated overnight at 4°C with 0.1% sodium citrate, 0.01% Triton X-100 and 0.1 mg/ml PI. The cell suspension was subjected to flow cytometry analysis in a Becton Dickinson FacsCanto cytometer and analyzed using Cell Quest software.
The pattern of cell division was evaluated in control and experimental cells by measuring CFSE dye (Molecular Probes) dilution after two days of proliferation [40]. Prior to culturing the isolated cells were incubated in10 mM CFSE in DMSO diluted at 1/10,000 in PBS for 10 min. The decay in labeling intensity relative to cell proliferation was analyzed using flow cytometry. The basal labeling level was estimated from non-proliferating cells maintained at 4°C.
Real time quantitative PCR (Q-PCR) for gene expression analysis
Total RNA was extracted using the NucleoSpin RNA kit (Macherey-Nagel). First-strand cDNA was synthesized using random hexamers and the High Capacity cDNA Reverse Transcription Kit (Life Technologies). The cDNA concentration was adjusted to 0.5 μg/μl. SYBRGreen (Life Technologies)-based QPCR was performed using the Mx3005P system (Stratagene). Rpl13 was chosen as the normalizer in interdigital samples and Gapdh in cultures. Mean values for fold changes were calculated. Expression level was evaluated relative to a calibrator according to the 2−(ΔΔCt) equation [41]. Each value represents the mean ± SEM of at least three independent samples obtained under the same conditions. Data were analyzed using Student's t test or ANOVA followed by Bonferroni test for post-hoc comparisons. Statistical significance was set at p < 0.05. Q-PCR specific primers for chick, duck and mouse genes analyzed in this study would be provided upon request.
Acknowledgments
Thanks are due to Montse Fernandez-Calderon, Sonia Perez-Mantecón and Susana Dawalibi for technical assistance.
Funding
This work was supported by a Grant (BFU2014-54026P) from the Spanish Science and Innovation Ministry to J.M.H.
Conflicts of Interest
The authors declare that they have no conflicts of interest with the contents of this article.
References
- 1. Fallon JF and Cameron J. Interdigital cell death during limb development of the turtle and lizard with an interpretation of evolutionary significance. J Embryol Exp Morphol. 1977; 40: 285 -289. [PubMed] .
- 2. Weatherbee SD, Behringer RR, Rasweiler JJ 4th, Niswander LA. Interdigital webbing retention in bat wings illustrates genetic changes underlying amniote limb diversification. Proc Natl Acad Sci U S A. 2006; 103: 15103 -15107. [PubMed] .
- 3. Hurle JM, Ros MA, Climent V, Garcia-Martinez V. Morphology and significance of programmed cell death in the developing limb bud of the vertebrate embryo. Microsc Res Tech. 1996; 34: 236 -246. [PubMed] .
- 4. Penaloza C, Lin L, Lockshin RA, Zakeri Z. Cell death in development: Shaping the embryo. Histochem Cell Biol. 2006; 126: 149 -158. [PubMed] .
- 5. Tone S and Tanaka S. Analysis of relationship between programmed cell death and cell cycle in limb-bud. Horm Res. 1997; 48 Suppl 3: 5 -10. [PubMed] .
- 6. Ahuja HS, Zhu Y, Zakeri Z. Association of cyclin-dependent kinase 5 and its activator p35 with apoptotic cell death. Dev Genet. 1997; 21: 258 -267. [PubMed] .
- 7. Garcia-Martinez V, Macias D, Ganan Y, Garcia-Lobo JM, Francia MV, Fernandez-Teran MA, Hurle JM. Internucleosomal DNA fragmentation and programmed cell death (apoptosis) in the interdigital tissue of the embryonic chick leg bud. J Cell Sci. 1993; 106: Pt 1 201 -208. [PubMed] .
- 8. Salas-Vidal E, Lomeli H, Castro-Obregon S, Cuervo R, Escalante-Alcalde D, Covarrubias L. Reactive oxygen species participate in the control of mouse embryonic cell death. Exp Cell Res. 1998; 238: 136 -147. [PubMed] .
- 9. Salas-Vidal E, Valencia C, Covarrubias L. Differential tissue growth and patterns of cell death in mouse limb autopod morphogenesis. Dev Dyn. 2001; 220: 295 -306. [PubMed] .
- 10. Hernandez-Martinez R and Covarrubias L. Interdigital cell death function and regulation: New insights on an old programmed cell death model. Dev Growth Differ. 2011; 53: 245 -258. [PubMed] .
- 11. McCulloch DR, Nelson CM, Dixon LJ, Silver DL, Wylie JD, Lindner V, Sasaki T, Cooley MA, Argraves WS, Apte SS. ADAMTS metalloproteases generate active versican fragments that regulate interdigital web regression. Dev Cell. 2009; 17: 687 -698. [PubMed] .
- 12. Zuzarte-Luis V, Berciano MT, Lafarga M, Hurle JM. Caspase redundancy and release of mitochondrial apoptotic factors characterize interdigital apoptosis. Apoptosis. 2006; 11: 701 -715. [PubMed] .
- 13. Zuzarte-Luis V, Montero JA, Kawakami Y, Izpisua-Belmonte JC, Hurle JM. Lysosomal cathepsins in embryonic programmed cell death. Dev Biol. 2007; 301: 205 -217. [PubMed] .
- 14. Montero JA, Lorda-Diez CI, Certal AC, Moreno N, Rodriguez-Leon J, Torriglia A, Hurle JM. Coordinated and sequential activation of neutral and acidic DNases during interdigital cell death in the embryonic limb. Apoptosis. 2010; 15: 1197 -1210. [PubMed] .
- 15. Suda N, Itoh T, Nakato R, Shirakawa D, Bando M, Katou Y, Kataoka K, Shirahige K, Tickle C, Tanaka M. Dimeric combinations of MafB, cFos and cJun control the apoptosis-survival balance in limb morphogenesis. Development. 2014; 141: 2885 -2894. [PubMed] .
- 16. Eshkar-Oren I, Krief S, Ferrara N, Elliott AM, Zelzer E. Vascular patterning regulates interdigital cell death by a ROS-mediated mechanism. Development. 2015; 142: 672 -680. [PubMed] .
- 17. Diaz-Mendoza MJ, Lorda-Diez CI, Montero JA, Garcia-Porrero JA, Hurle JM. Interdigital cell death in the embryonic limb is associated with depletion of reelin in the extracellular matrix. Cell Death Dis. 2013; 4: e800 [PubMed] .
- 18. Montero JA and Hurle JM. Sculpturing digit shape by cell death. Apoptosis. 2010; 15: 365 -375. [PubMed] .
- 19. Storer M, Mas A, Robert-Moreno A, Pecoraro M, Ortells MC, Di Giacomo V, Yosef R, Pilpel N, Krizhanovsky V, Sharpe J, Keyes WM. Senescence is a developmental mechanism that contributes to embryonic growth and patterning. Cell. 2013; 155: 1119 -1130. [PubMed] .
- 20. Munoz-Espin D, Canamero M, Maraver A, Gomez-Lopez G, Contreras J, Murillo-Cuesta S, Rodriguez-Baeza A, Varela-Nieto I, Ruberte J, Collado M, Serrano M. Programmed cell senescence during mammalian embryonic development. Cell. 2013; 155: 1104 -1118. [PubMed] .
- 21. Munoz-Espin D and Serrano M. Cellular senescence: From physiology to pathology. Nat Rev Mol Cell Biol. 2014; 15: 482 -496. [PubMed] .
- 22. Banito A and Lowe SW. A new development in senescence. Cell. 2013; 155: 977 -978. [PubMed] .
- 23. Matsuda S, Rouault J, Magaud J, Berthet C. In search of a function for the TIS21/PC3/BTG1/TOB family. FEBS Lett. 2001; 497: 67 -72. [PubMed] .
- 24. Jia S and Meng A. Tob genes in development and homeostasis. Dev Dyn. 2007; 236: 913 -921. [PubMed] .
- 25. Kamaid A and Giraldez F. Btg1 and Btg2 gene expression during early chick development. Dev Dyn. 2008; 237: 2158 -2169. [PubMed] .
- 26. Lim IK. TIS21 (/BTG2/PC3) as a link between ageing and cancer: Cell cycle regulator and endogenous cell death molecule. J Cancer Res Clin Oncol. 2006; 132: 417 -426. [PubMed] .
- 27. Zhu R, Zou ST, Wan JM, Li W, Li XL, Zhu W. BTG1 inhibits breast cancer cell growth through induction of cell cycle arrest and apoptosis. Oncol Rep. 2013; 30: 2137 -2144. [PubMed] .
- 28. Wheaton K, Muir J, Ma W, Benchimol S. BTG2 antagonizes Pin1 in response to mitogens and telomere disruption during replicative senescence. Aging Cell. 2010; 9: 747 -760. [PubMed] .
- 29. Nahta R, Yuan LX, Fiterman DJ, Zhang L, Symmans WF, Ueno NT, Esteva FJ. B cell translocation gene 1 contributes to antisense bcl-2-mediated apoptosis in breast cancer cells. Mol Cancer Ther. 2006; 5: 1593 -1601. [PubMed] .
- 30. Yoshida Y, Nakamura T, Komoda M, Satoh H, Suzuki T, Tsuzuku JK, Miyasaka T, Yoshida EH, Umemori H, Kunisaki RK, Tani K, Ishii S, Mori S, et al. Mice lacking a transcriptional corepressor tob are predisposed to cancer. Genes Dev. 2003; 17: 1201 -1206. [PubMed] .
- 31. Winkler GS. The mammalian anti-proliferative BTG/Tob protein family. J Cell Physiol. 2010; 222: 66 -72. [PubMed] .
- 32. Tijchon E, van Ingen Schenau D, van Opzeeland F, Tirone F, Hoogerbrugge PM, Van Leeuwen FN, Scheijen B. Targeted deletion of Btg1 and Btg2 results in homeotic transformation of the axial skeleton. PLoS One. 2015; 10: e0131481 [PubMed] .
- 33. Al-Maawali A, Marshall CR, Scherer SW, Dupuis L, Mendoza-Londono R, Stavropoulos DJ. Clinical characteristics in patients with interstitial deletions of chromosome region 12q21-q22 and identification of a critical region associated with keratosis pilaris. Am J Med Genet A. 2014; 164A: 796 -800. [PubMed] .
- 34. Debacq-Chainiaux F, Erusalimsky JD, Campisi J, Toussaint O. Protocols to detect senescence-associated beta-galactosidase (SA-betagal) activity, a biomarker of senescent cells in culture and in vivo. Nat Protoc. 2009; 4: 1798 -1806. [PubMed] .
- 35. Tomas AR, Certal AC, Rodriguez-Leon J. FLRT3 as a key player on chick limb development. Dev Biol. 2011; 355: 324 -333. [PubMed] .
- 36. Wise TG, Schafer DJ, Lambeth LS, Tyack SG, Bruce MP, Moore RJ, Doran TJ. Characterization and comparison of chicken U6 promoters for the expression of short hairpin RNAs. Anim Biotechnol. 2007; 18: 153 -162. [PubMed] .
- 37. Gros J and Tabin CJ. Vertebrate limb bud formation is initiated by localized epithelial-to-mesenchymal transition. Science. 2014; 343: 1253 -1256. [PubMed] .
- 38. Ohkawa H, Ohishi N, Yagi K. Assay for lipid peroxides in animal tissues by thiobarbituric acid reaction. Anal Biochem. 1979; 95: 351 -358. [PubMed] .
- 39. Levine RL, Garland D, Oliver CN, Amici A, Climent I, Lenz AG, Ahn BW, Shaltiel S, Stadtman ER. Determination of carbonyl content in oxidatively modified proteins. Methods Enzymol. 1990; 186: 464 -478. [PubMed] .
- 40. Lyons AB. Analysing cell division in vivo and in vitro using flow cytometric measurement of CFSE dye dilution. J Immunol Methods. 2000; 243: 147 -154. [PubMed] .
- 41. Livak KJ and Schmittgen TD. Analysis of relative gene expression data using real-time quantitative PCR and the 2(−delta delta C(T)) method. Methods. 2001; 25: 402 -408. [PubMed] .
- 42. Acosta JC, Banito A, Wuestefeld T, Georgilis A, Janich P, Morton JP, Athineos D, Kang TW, Lasitschka F, Andrulis M, Pascual G, Morris KJ, Khan S, et al. A complex secretory program orchestrated by the inflammasome controls paracrine senescence. Nat Cell Biol. 2013; 15: 978 -990. [PubMed] .
- 43. Vasey DB, Wolf CR, Brown K, Whitelaw CB. Spatial p21 expression profile in the mid-term mouse embryo. Transgenic Res. 2011; 20: 23 -28. [PubMed] .
- 44. Mori C, Nakamura N, Kimura S, Irie H, Takigawa T, Shiota K. Programmed cell death in the interdigital tissue of the fetal mouse limb is apoptosis with DNA fragmentation. Anat Rec. 1995; 242: 103 -110. [PubMed] .
- 45. Dunker N, Schmitt K, Krieglstein K. TGF-beta is required for programmed cell death in interdigital webs of the developing mouse limb. Mech Dev. 2002; 113: 111 -120. [PubMed] .
- 46. Dubail J, Aramaki-Hattori N, Bader HL, Nelson CM, Katebi N, Matuska B, Olsen BR, Apte SS. A new Adamts9 conditional mouse allele identifies its non-redundant role in interdigital web regression. Genesis. 2014; 52: 702 -712. [PubMed] .
- 47. Lim YB, Park TJ, Lim IK. B cell translocation gene 2 enhances susceptibility of HeLa cells to doxorubicin-induced oxidative damage. J Biol Chem. 2008; 283: 33110 -33118. [PubMed] .
- 48. Macias D, Ganan Y, Sampath TK, Piedra ME, Ros MA, Hurle JM. Role of BMP-2 and OP-1 (BMP-7) in programmed cell death and skeletogenesis during chick limb development. Development. 1997; 124: 1109 -1117. [PubMed] .
- 49. Chautan M, Chazal G, Cecconi F, Gruss P, Golstein P. Interdigital cell death can occur through a necrotic and caspase-independent pathway. Curr Biol. 1999; 9: 967 -970. [PubMed] .
- 50. Nagasaka A, Kawane K, Yoshida H, Nagata S. Apaf-1-independent programmed cell death in mouse development. Cell Death Differ. 2010; 17: 931 -941. [PubMed] .
- 51. Schnabel D, Salas-Vidal E, Narvaez V, Sanchez-Carbente Mdel R, Hernandez-Garcia D, Cuervo R, Covarrubias L. Expression and regulation of antioxidant enzymes in the developing limb support a function of ROS in interdigital cell death. Dev Biol. 2006; 291: 291 -299. [PubMed] .
- 52. Freund A, Orjalo AV, Desprez PY, Campisi J. Inflammatory networks during cellular senescence: Causes and consequences. Trends Mol Med. 2010; 16: 238 -246. [PubMed] .
- 53. Crescenzi E, Pacifico F, Lavorgna A, De Palma R, D'Aiuto E, Palumbo G, Formisano S, Leonardi A. NF-kappaB-dependent cytokine secretion controls fas expression on chemotherapy-induced premature senescent tumor cells. Oncogene. 2011; 0: 2707 -2717. [PubMed] .
- 54. Jeon H and Boo YC. Senescent endothelial cells are prone to TNF-alpha-induced cell death due to expression of FAS receptor. Biochem Biophys Res Commun. 2013; 438: 277 -282. [PubMed] .
- 55. Rouault JP, Rimokh R, Tessa C, Paranhos G, Ffrench M, Duret L, Garoccio M, Germain D, Samarut J, Magaud JP. BTG1, a member of a new family of antiproliferative genes. Embo j. 1992; 11: 1663 -1670. [PubMed] .
- 56. Doidge R, Mittal S, Aslam A, Winkler GS. The anti-proliferative activity of BTG/TOB proteins is mediated via the Caf1a (CNOT7) and Caf1b (CNOT8) deadenylase subunits of the Ccr4-not complex. PLoS One. 2012; 7: e51331 [PubMed] .
- 57. Mao B, Zhang Z, Wang G. BTG2: A rising star of tumor suppressors (review). Int J Oncol. 2015; 46: 459 -464. [PubMed] .
- 58. Maddika S, Ande SR, Panigrahi S, Paranjothy T, Weglarczyk K, Zuse A, Eshraghi M, Manda KD, Wiechec E, Los M. Cell survival, cell death and cell cycle pathways are interconnected: Implications for cancer therapy. Drug Resist Updat. 2007; 10: 13 -29. [PubMed] .
- 59. van Kleffens M, Groffen C, Rosato RR, van den Eijnde SM, van Neck JW, Lindenbergh-Kortleve DJ, Zwarthoff EC, Drop SL. mRNA expression patterns of the IGF system during mouse limb bud development, determined by whole mount in situ hybridization. Mol Cell Endocrinol. 1998; 138: 151 -161. [PubMed] .
- 60. Allan GJ, Flint DJ, Patel K. Insulin-like growth factor axis during embryonic development. Reproduction. 2001; 122: 31 -39. [PubMed] .
- 61. McQueeney K and Dealy CN. Roles of insulin-like growth factor-I (IGF-I) and IGF-I binding protein-2 (IGFBP2) and -5 (IGFBP5) in developing chick limbs. Growth Horm IGF Res. 2001; 11: 346 -363. [PubMed] .
- 62. Montero JA, Ganan Y, Macias D, Rodriguez-Leon J, Sanz-Ezquerro JJ, Merino R, Chimal-Monroy J, Nieto MA, Hurle JM. Role of FGFs in the control of programmed cell death during limb development. Development. 2001; 128: 2075 -2084. [PubMed] .
- 63. Hernandez-Martinez R, Castro-Obregon S, Covarrubias L. Progressive interdigital cell death: Regulation by the antagonistic interaction between fibroblast growth factor 8 and retinoic acid. Development. 2009; 136: 3669 -3678. [PubMed] .