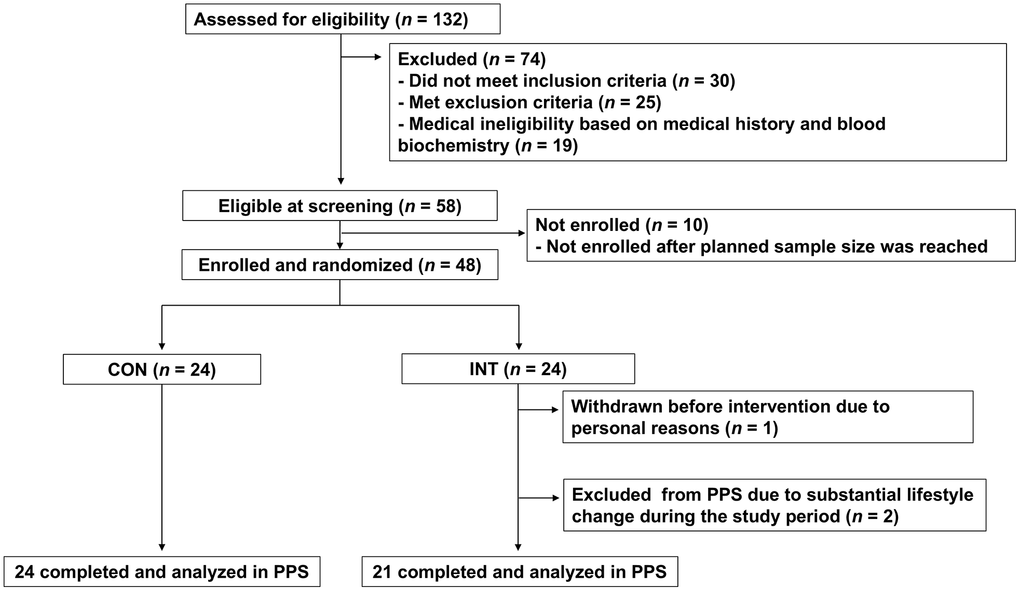
Figure 1.CONSORT flow diagram of the study participants. The flow diagram illustrates the progress of participants through the phases of the trial. Forty-eight participants were randomized (INT, n = 24; CON, n = 24); in the INT group, one participant withdrew for personal reasons and two were excluded because unintended lifestyle changes introduced after randomization, resulting in per-protocol samples (PPS) of 21 in the INT group and 24 in the CON group, respectively.