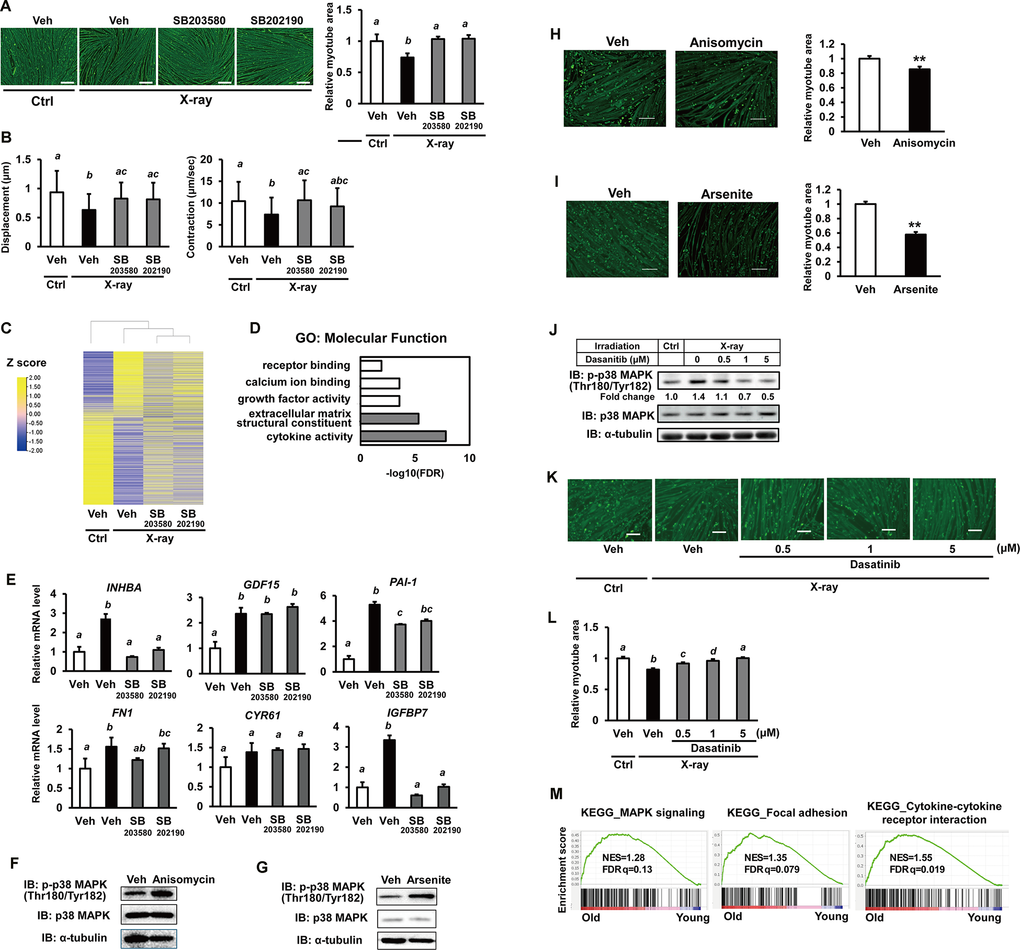
Figure 4.Senescence in hiPSC-derived myocytes is mediated via the p38MAPK pathway. (A) hiPSC-derived myocytes were irradiated with X-rays (3 Gy). One day post-irradiation, cells were treated with p38MAPK inhibitors (SB203580 and SB202190). One week after irradiation, cells were stained for MHC and nuclei. Scale bar: 100 μm. Relative MHC-positive areas were quantified as described in the methods section. (B) hiPSC-derived myocytes were stimulated with electrical pulses (23 V, 4 ms, 1 Hz), and myotube movement was measured using motion analyzer software. (C) Comprehensive transcriptome analysis of irradiated myocytes treated with or without p38MAPK inhibitors. (D) Gene Ontology (GO) analysis of molecular function in myocytes. The top five GO terms are listed. (E) One week after X-ray irradiation, total RNA was extracted and analyzed by real-time PCR. mRNA levels were normalized to 18S rRNA. Relative mRNA expression in untreated, nonirradiated controls (Ctrl) was set to 1. (F, G) Whole-cell lysates from hiPSC-derived myocytes were collected on 5 days after anisomycin or arsenite treatment and subjected to immunoblotting to assess the expression of the indicated proteins. (H, I) 5 days after anisomycin or arsenite treatment, cells were fixed, permeabilized, and stained for MHC and nuclei. Scale bar: 100 μm. Relative MHC-positive areas were quantified as described in the methods section. The relative myotube area in nonirradiated vehicles (Veh) was set to 1. (J) One week after X-ray irradiation, iPSC-derived myocytes were treated with dasatinib for 6hrs. Whole-cell lysates from hiPSC-derived myocytes were collected subjected to immunoblotting to assess the expression of the indicated proteins. (K, L) One week after X-ray irradiation and dasatinib treatment, cells were fixed, permeabilized, and stained for MHC and nuclei. Scale bar: 100 μm. Relative MHC-positive areas were quantified as described in the methods section. The relative myotube area in nonirradiated vehicles without X-ray irradiation was set to 1. (M) Gene Set Enrichment Analysis (GSEA) of the indicated KEGG pathways. KEGG: Kyoto Encyclopedia of Genes and Genomes; NES: normalized enrichment score; FDR: false discovery rate. The image in Figure 4 was generated using TBtools [24]. The numbers under the lanes indicate fold changes in protein level relative to the control and were standardized against total p38MAPK. Data are presented as mean ± SD (n = 3 or 27), and statistical analysis was performed using Tukey’s test. Different letters indicate significant differences between groups (p < 0.05).