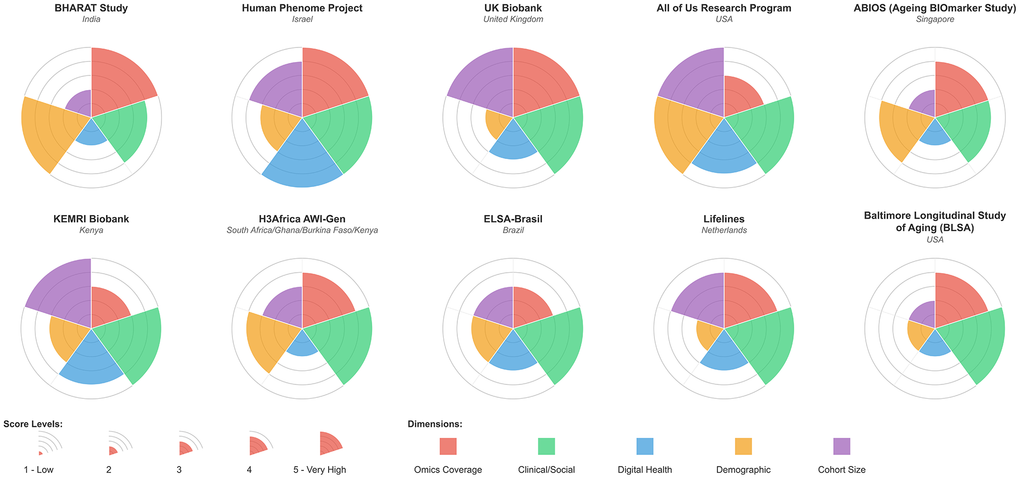
Figure 4.Radar plots of representative worldwide multi-omics cohorts scored on 5 different criteria: Omics coverage, clinical/social metadata collection, use of digital health tools, demographic coverage, and cohort size. Each category is scored on a scale of 1-5. The in-depth criteria and justification for scoring are given in Supplementary Information.