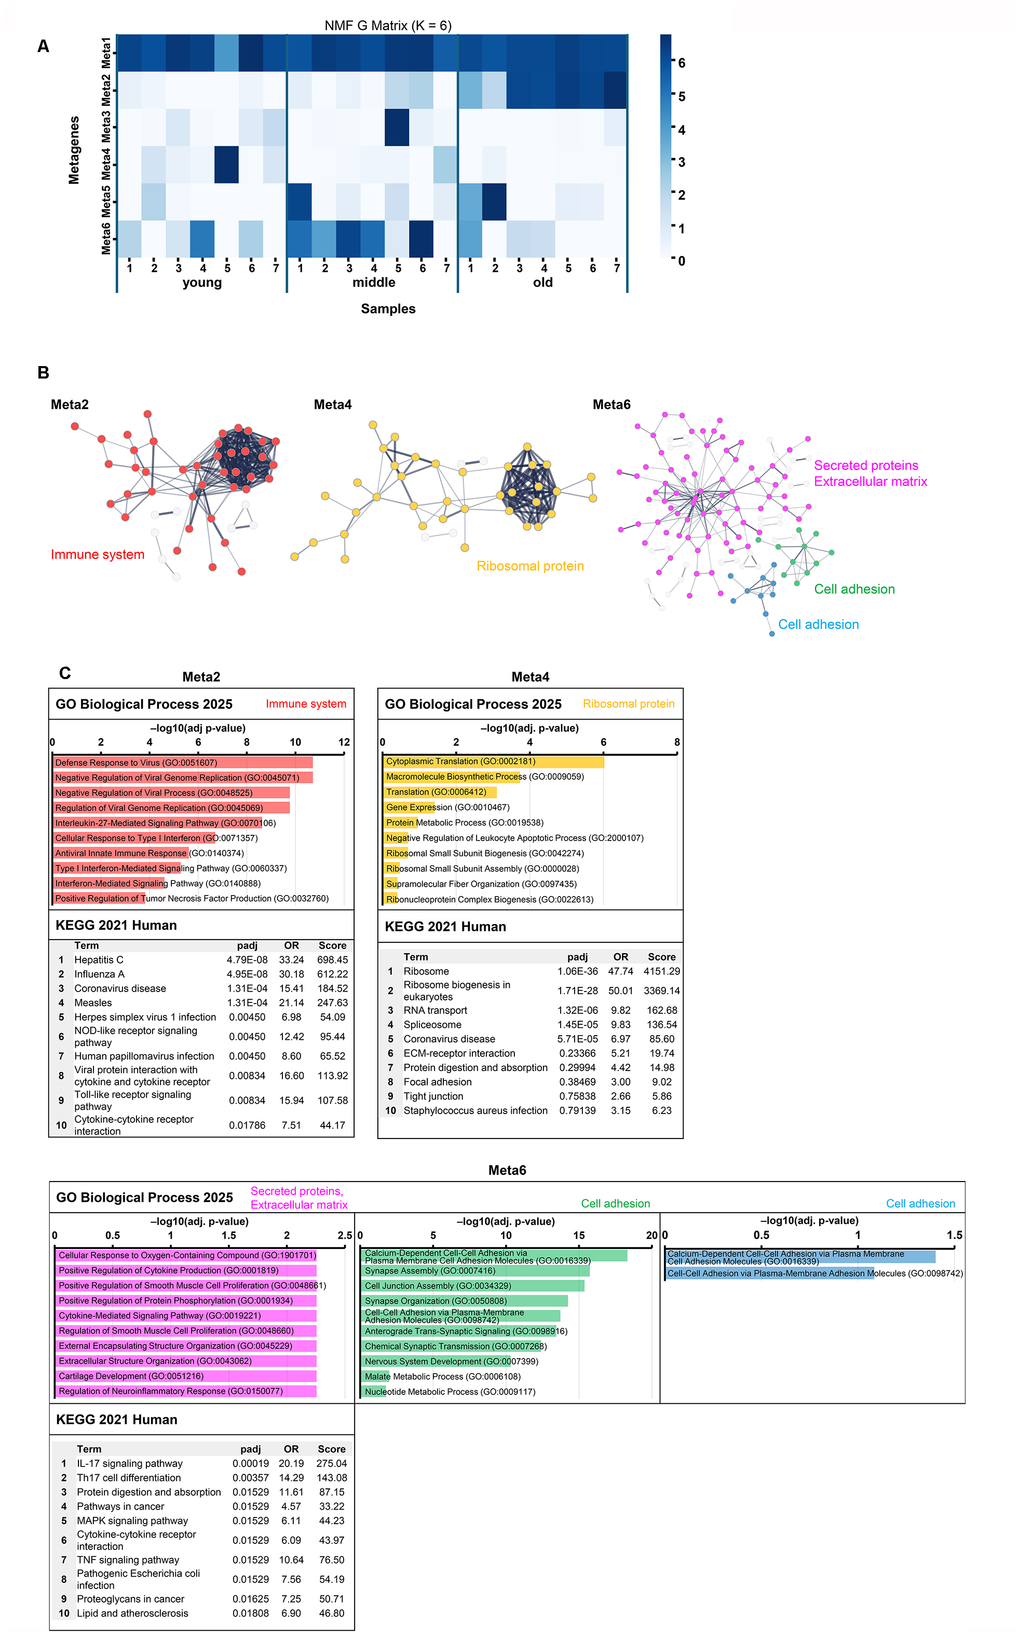
Figure 6.Non-negative matrix factorization analysis of gene expression data and functional characterization of metagenes. (A) Heatmap of metagene expression patterns across samples. This shows the contribution of each metagene (Meta1–6) to the gene expression profile of each sample (young, middle, and old). The contribution of Meta2 increased with senescence, that of Meta4 decreased, and that of Meta6 peaked in the middle group. (B) STRING network. PPI networks were constructed for the top 100 genes of Meta2, the top 200 genes in Meta4, and the top 500 genes of Meta6. Nodes represent proteins (Meta2: red, Meta4: orange, Meta6: pink/green/blue), and edges represent PPI. Functionally enriched clusters are highlighted and annotated based on UniProt keywords. Nodes outside the annotated functional clusters (based on UniProt keywords) were retained in the network but shown in gray to visually distinguish them from the main modules. (C) Functional enrichment analysis of Meta2, Meta4, and Meta6 using GO Biological Process (top) and KEGG Human (bottom). GO enrichment results are shown as horizontal bar graphs, with bar length representing –log10 (adjusted p-value). Bar colors correspond to the cluster colors in panel B. KEGG tables list the top 10 terms ranked by adjusted p-value. Other metagene enrichment results are shown in Supplementary Figure 7.