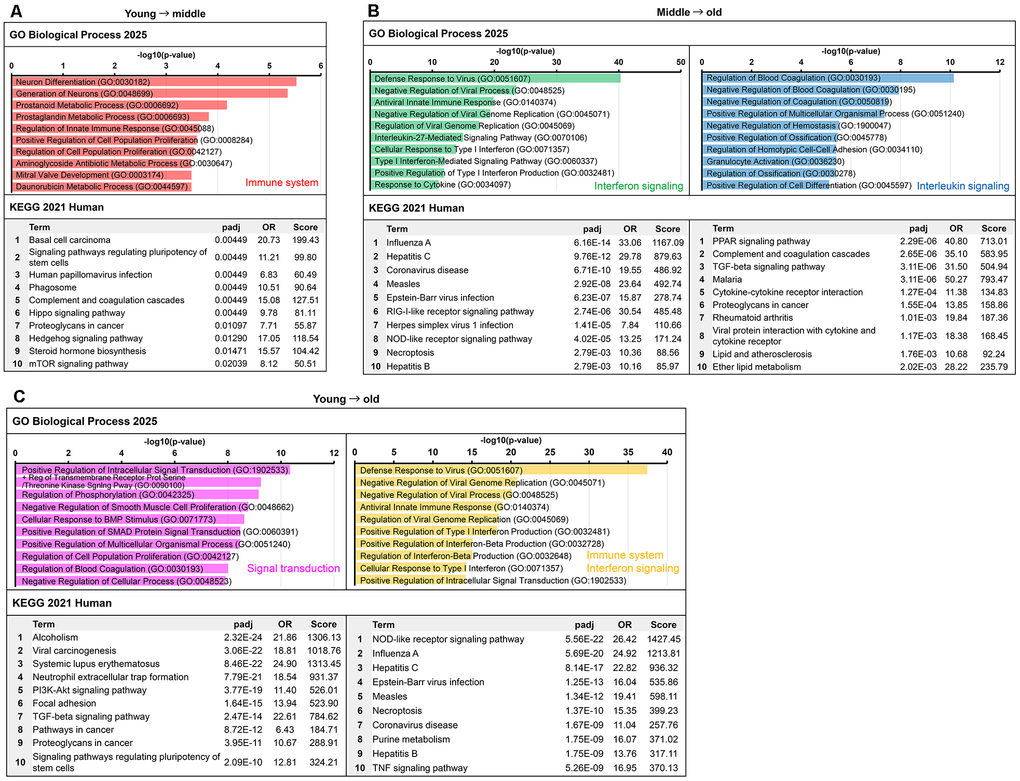
Figure 5.Functional enrichment analysis of immune–inflammation-related clusters identified from senescence progression. Enrichment results from Gene Ontology (GO) biological process and Kyoto Encyclopedia of Genes and Genomes (KEGG) pathway analyses for clusters classified as immune- or inflammation-related in the comparisons between the young and old groups. Bar colors correspond to the cluster colors in Figure 4A–4C: red, immune system (Figure 4A); green, interferon signaling (Figure 4B); blue, IL signaling (Figure 4B); pink, signal transduction (Figure 4C); and orange, immune system/interferon signaling (Figure 4C). The top 10 terms ranked by adjusted p-values are shown for each cluster. (A) Clusters upregulated from the young to middle. (B) Upregulated clusters from middle to old. (C) Clusters upregulated from young to old.