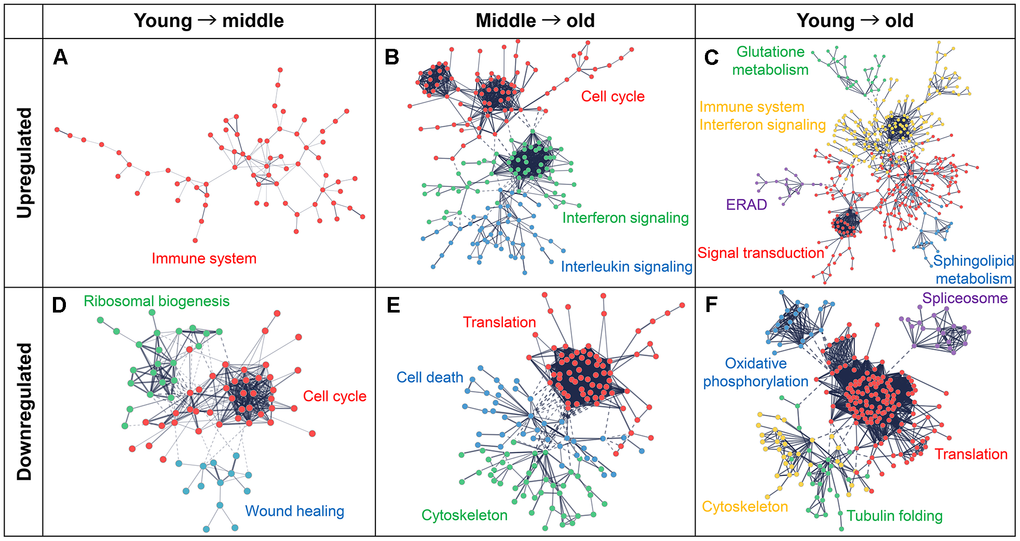
Figure 4.Protein–protein interaction (PPI) networks and functional clusters of DEGs. PPI networks were constructed using the STRING database. Nodes represent genes and edges represent their interactions. Upregulated genes are shown in the upper panels (A–C) and downregulated genes are shown in the lower panels (D–F). Functionally enriched clusters are highlighted in different colors and labeled with the corresponding pathway or process names. (A, D) Networks for the comparison between the young and middle groups. (B, E) Networks for comparison between middle to old groups. (C, F) Networks used for comparison between young and old groups.