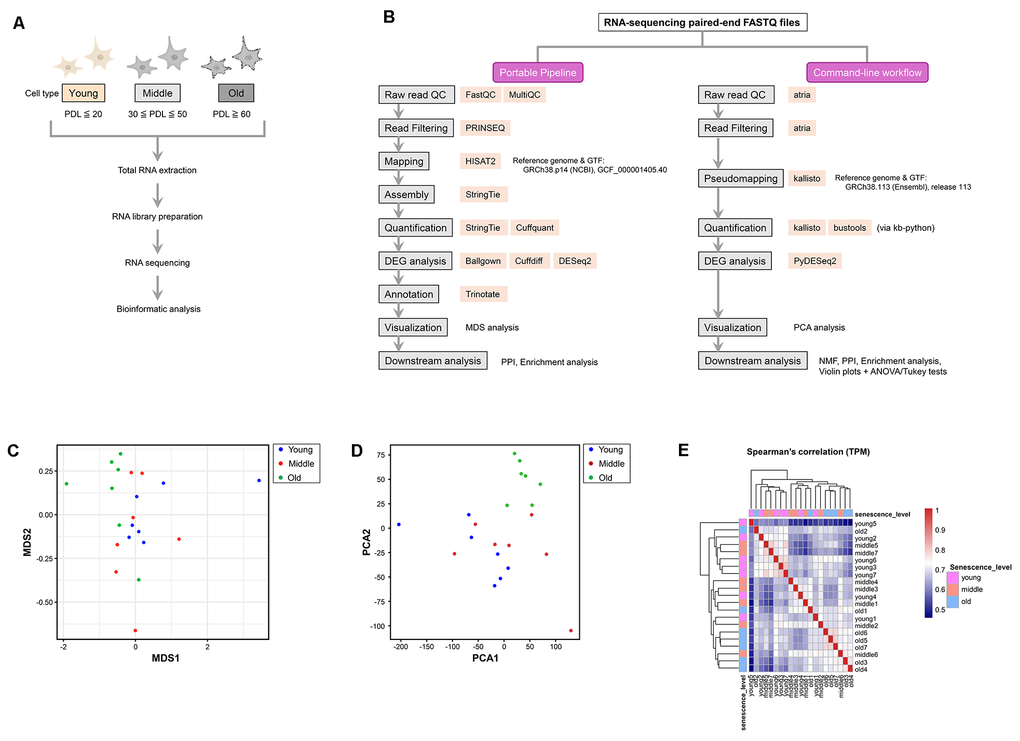
Figure 2.Experimental workflow and visualization of transcriptomic similarity among samples. (A) Experimental workflow for RNA sequencing (RNA-seq) analysis of young, middle, and old normal human dermal fibroblasts (NHDFs). (B) Comparative flowchart of the two RNA-seq analysis pipelines used in this study. The left panel illustrates the GUI-based Portable Pipeline, whereas the right panel shows the command-line workflow. Each step lists the tools used, highlighting methodological similarities and differences. (C) Multi-dimensional scaling (MDS) plot showing the pairwise dissimilarity of gene expression profiles across all samples. Each dot represents a single sample, and colors correspond to the aging stage: young (blue), middle (red), and old (green). (D) Principal component analysis (PCA) plot showing the similarity and dissimilarity of gene expression profiles across all samples. The horizontal (PC1) and vertical axes (PC2) represent the first and second principal components, respectively. Old samples are separated from the young and middle samples along the PC1 axis, whereas the young and middle samples overlap. (E) Spearman’s correlation heatmap of log2 (TPM + 1) values across all samples. Color intensity represents pairwise correlation coefficients, with sample IDs shown along both axes and labeled by senescence stage (young, middle, and old).