Submit an Article
Navigate
Home
Editorial Board
Editorial Policies
Current Volume
Archive
Scientific Integrity
Publication Ethics Statements
Interviews with Outstanding Authors
Newsroom
Sponsored Conferences
Podcast
Contact
Special Collections
Submit an Article
Online ISSN: 1945-4589
Research Paper
|
Volume 18
|
pp. 102–116
Blood biochemical and gut microbiotic neural network models forecasting human biological age
Back to article
Figure 4
(4 of 8)
−
100%
+
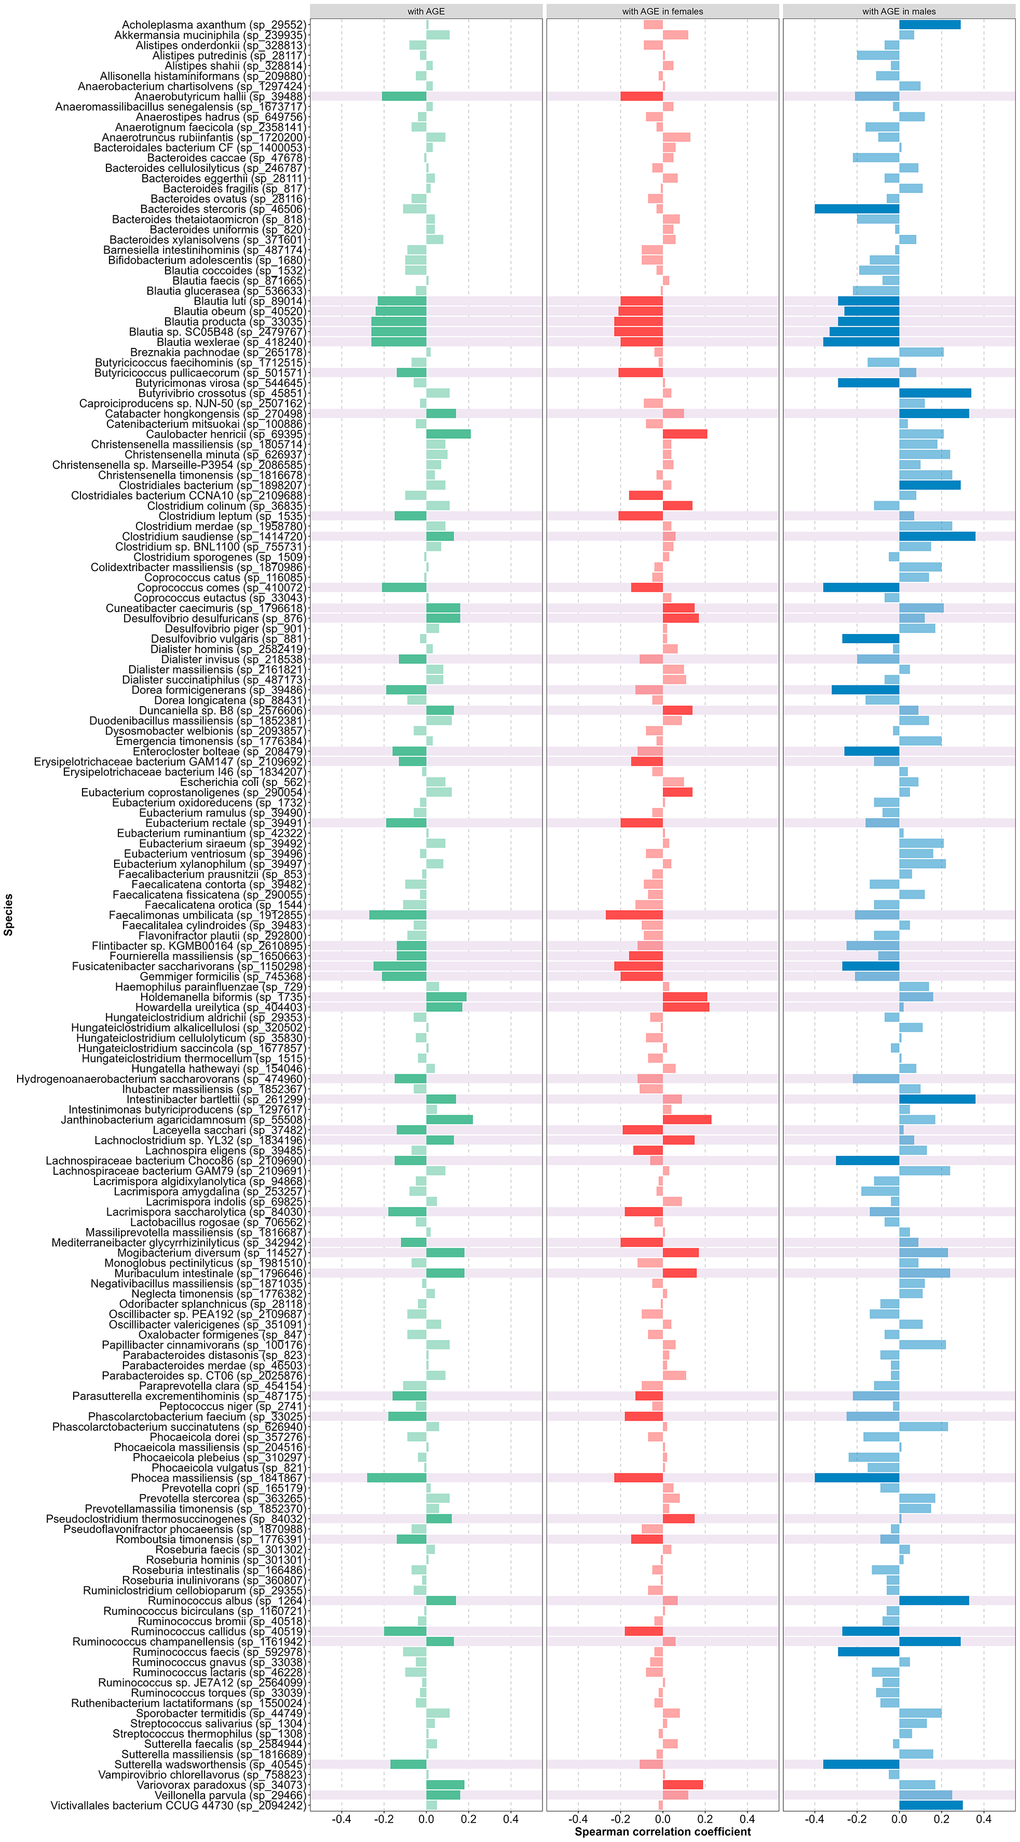
Figure 4.
Correlation coefficient between species presence and age (green – in all cohort, red – in female, blue – in male, light green, red, blue colors – not significant, background color – selected as predictors).